Papers
Topics
Authors
Recent
Search
2000 character limit reached

Optimal Execution with Passive Market Impact

Published 30 Jul 2026 in q-fin.TR | (2607.28323v1)

Abstract: We derive a mesoscopic model for optimal execution with limit orders that incorporates microstructural features of passive price impact. Our framework is based on two empirical observables: the approximately exponential decay of limit-order fill probabilities with distance from the midprice, and the short-term linear response of price changes to order flow imbalance. Combining these ingredients, we obtain a reduced-form passive impact rate that decays exponentially with quote distance. The model describes passive execution at a tactical level, where fills arise from a sequence of quote adjustments that balance execution probability, adverse selection, and opportunity cost. We formulate and solve an optimal liquidation problem in which the trader controls the aggressiveness of passive sell quotes. This generates a trade-off between higher fill intensity and larger accumulated impact on the one hand, and lower impact but greater non-execution risk on the other. Empirical calibration using NASDAQ equities and public FX supports the empirical foundations of the model. We also analyse extensions with heterogeneous decay rates, transient impact, and target execution schedules.
Summary

  • The paper introduces a mesoscopic model where passive (limit) order execution generates systematic price impact that decays exponentially with quote distance.
  • The model derives an explicit optimal quoting strategy that balances fill probability against passive impact and inventory risk.
  • Empirical calibrations on NASDAQ equities and FX data demonstrate parameter sensitivities and validate the simulation-based execution framework.

Optimal Execution with Passive Market Impact: A Technical Overview

Motivation and Context

Optimal execution theory has historically concentrated on modeling the adverse price impact of large (metaorder) executions conducted via market orders, focusing on the interplay between execution costs and inventory risk as in the classic Almgren-Chriss and Bertsimas-Lo models. These market impact models often treat passive (limit order) execution as essentially costless in terms of permanent price impact, viewing it purely as a means to capture spread at the cost of fill risk. However, recent empirical findings and microscopic queue models demonstrate that passive execution strategies—through their impact on order flow imbalance (OFI)—can themselves generate significant systematic price impact, even outside the context of explicit aggressive flow.

This paper provides a rigorous, mesoscopic model of optimal execution with passive market impact, bridging microstructural empirical phenomena with tractable optimal control. The key empirical pillars for the model are:

Both features are confirmed by calibration to NASDAQ equity and FX market data, providing broad cross-market applicability.

Passive Impact Modeling Framework

A stylized model is constructed in which a trader executes a metaorder using a tactical chain of passive (limit) orders, each set at a distance δ\delta from the mid. Execution arises from a repeated process of quote adjustment and reposting, summarized by an exponentially decaying fill intensity:

Λ(δ)=λekδ\Lambda(\delta) = \lambda e^{-k \delta}

Empirical analysis reveals that price impact coefficients β(δ)\beta(\delta) derived from OFI (and especially MLOFI) also display exponential decay with δ\delta:

β(δ)=ξeδ\beta(\delta) = \xi e^{-\ell \delta}

The product of these two rates describes a passive impact rate that aggregates the average price impact per fill as a reduced-form, continuous-time process:

$\eta e^{-m \delta}, \quad \mbox{where } \eta = \xi \lambda, \; m = k + \ell$

This summarizes the inventory, fill intensity, and average passive impact into a tractable state variable for optimal control.

Main Model: Formulation and Solution

The agent seeks to liquidate a block of q0q_0 inventory over horizon [0,T][0,T] by controlling the quote distance δt\delta_t of posted limit sell orders. Fills arrive as jumps of a counted Poisson process with intensity λekδt\lambda e^{-k \delta_t}, and posting at distance Λ(δ)=λekδ\Lambda(\delta) = \lambda e^{-k \delta}0 induces a permanent price drift at rate Λ(δ)=λekδ\Lambda(\delta) = \lambda e^{-k \delta}1. The unaffected midprice follows Brownian motion, with agent's total cash and remaining inventory evolving stochastically. The objective is to maximize terminal cash plus final inventory marked to the (impacted) midprice, penalized for both running and terminal inventory risk:

Λ(δ)=λekδ\Lambda(\delta) = \lambda e^{-k \delta}2

For the equity-calibrated case where Λ(δ)=λekδ\Lambda(\delta) = \lambda e^{-k \delta}3, the model admits a fully explicit solution to the associated HJB equation. The optimal quote is:

Λ(δ)=λekδ\Lambda(\delta) = \lambda e^{-k \delta}4

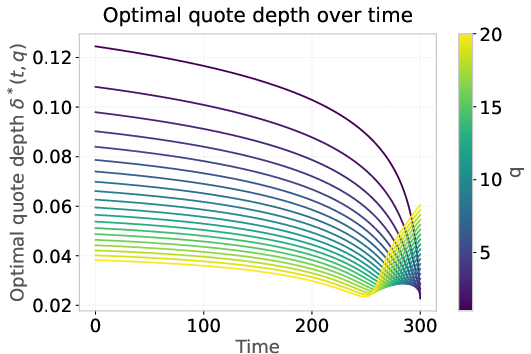
where Λ(δ)=λekδ\Lambda(\delta) = \lambda e^{-k \delta}5 follows a linear ODE system with known initial and boundary conditions. Figure 1

Figure 1: Optimal quote depth Λ(δ)=λekδ\Lambda(\delta) = \lambda e^{-k \delta}6 over time for different inventory levels Λ(δ)=λekδ\Lambda(\delta) = \lambda e^{-k \delta}7.

The model captures a fundamental tradeoff: posting closer to the mid increases execution probability and reduces inventory risk, but raises average passive impact incurred; conversely, posting deeper reduces passive impact but heightens fill risk.

Numerical Analysis and Sensitivity

Empirical illustrations confirm the main economic features of the model:

  • Urgency and Quote Aggressiveness: Higher initial inventory prompts quoting closer to the mid; toward the end of the period, inventory is marked to the impacted price, sometimes making it optimal to avoid incurring further impact and instead absorb inventory penalties.
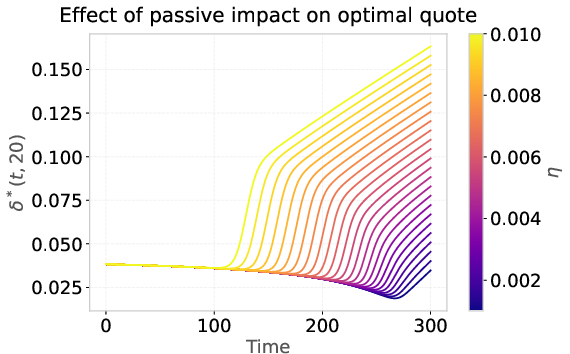
  • Parameter Sensitivities: Increasing the passive impact parameter Λ(δ)=λekδ\Lambda(\delta) = \lambda e^{-k \delta}8 yields less aggressive quoting and lower average liquidation, but does not increase (and may even reduce) implementation shortfall—demonstrating the opportunity cost from cautious execution. Figure 2

    Figure 2: Effect of the passive impact parameter Λ(δ)=λekδ\Lambda(\delta) = \lambda e^{-k \delta}9 on the optimal quote depth β(δ)\beta(\delta)0.

    Figure 3

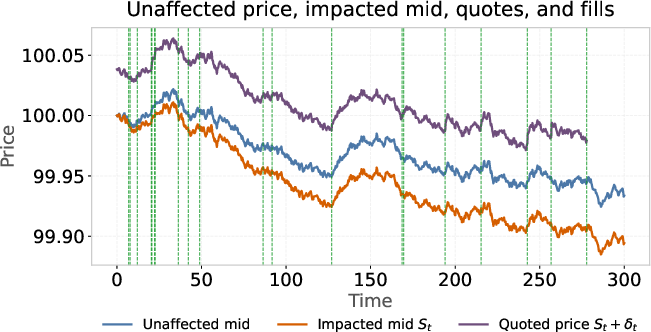
    Figure 3: Simulated unaffected midprice (blue), impacted midprice (red), quoted price (purple), and fill times (green vertical lines) under the baseline strategy.

    Figure 4

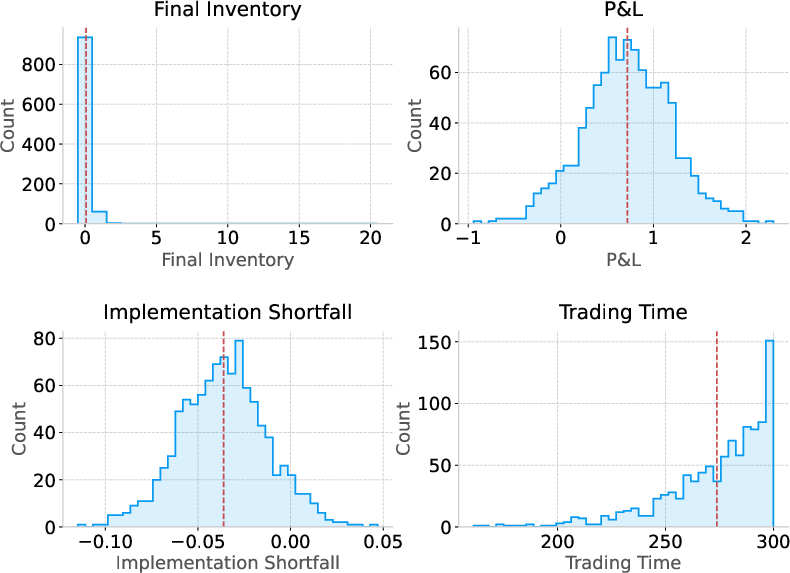
    Figure 4: Monte Carlo diagnostics for final inventory, P&L, implementation shortfall, and trading time for baseline parameters.

Strong numerical evidence is provided in simulation, with performance and risk metrics tracked over thousands of Monte Carlo paths. Results confirm that aggressive quoting under high passive impact leads to partial rather than full liquidation and impact-aware quoting policies.

Empirical Grounding: Cross-Asset Calibration

Calibrations for both US equities and G10/emerging FX pairs demonstrate high generality:

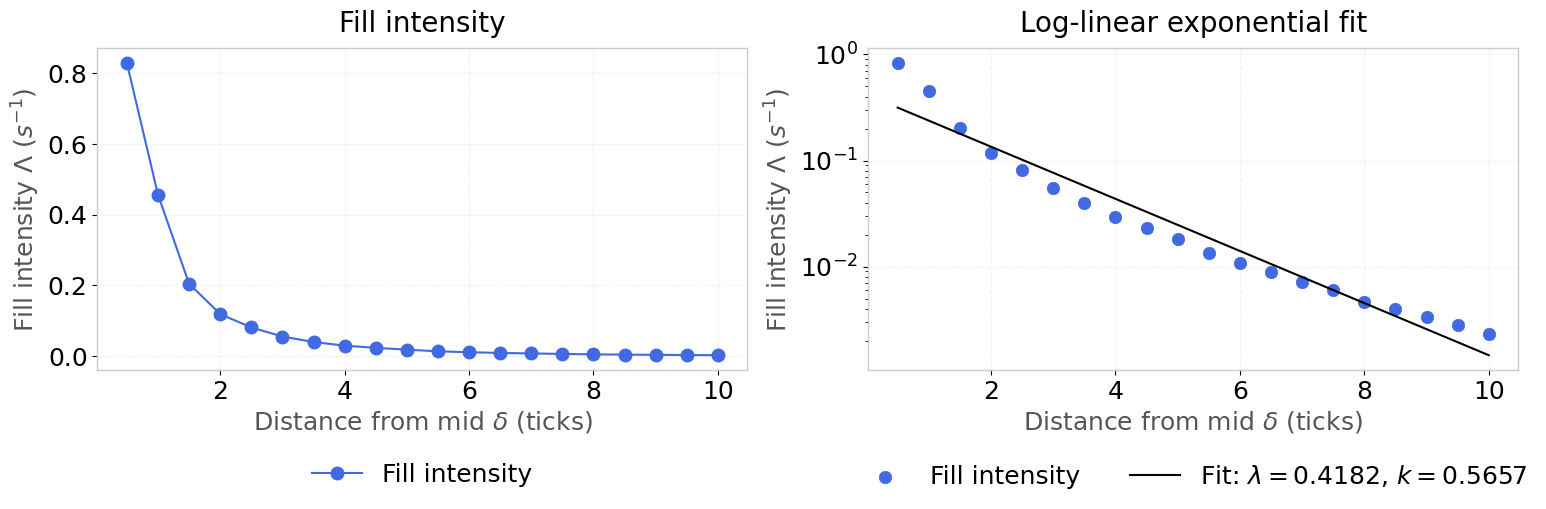
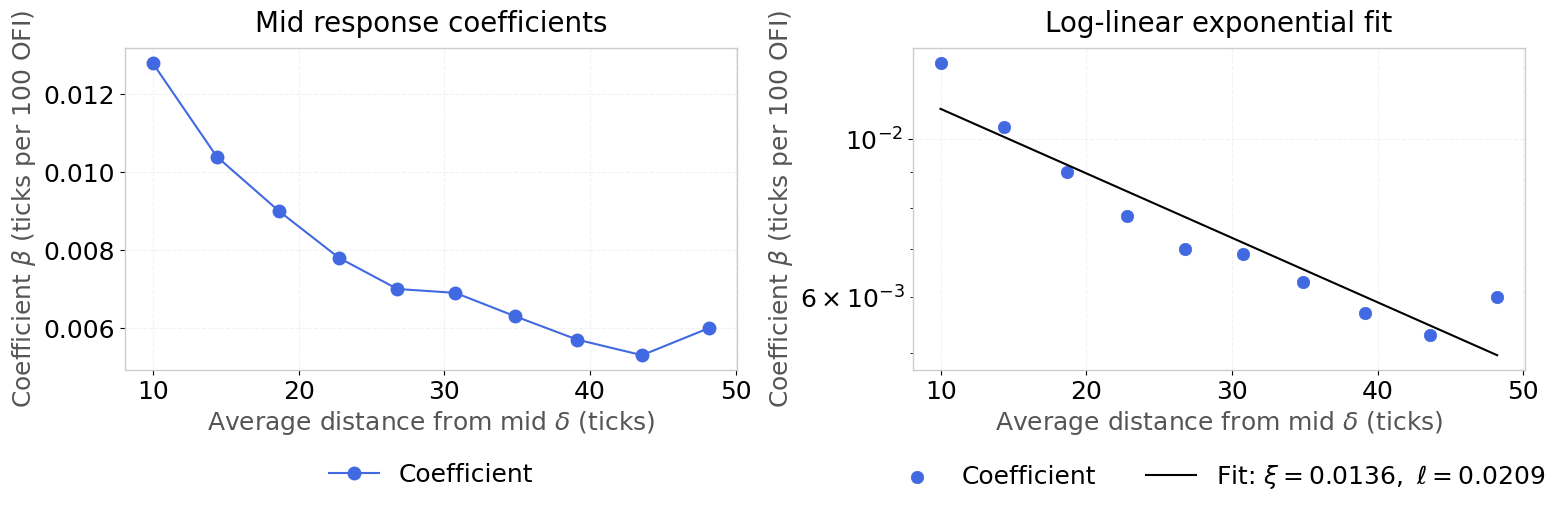
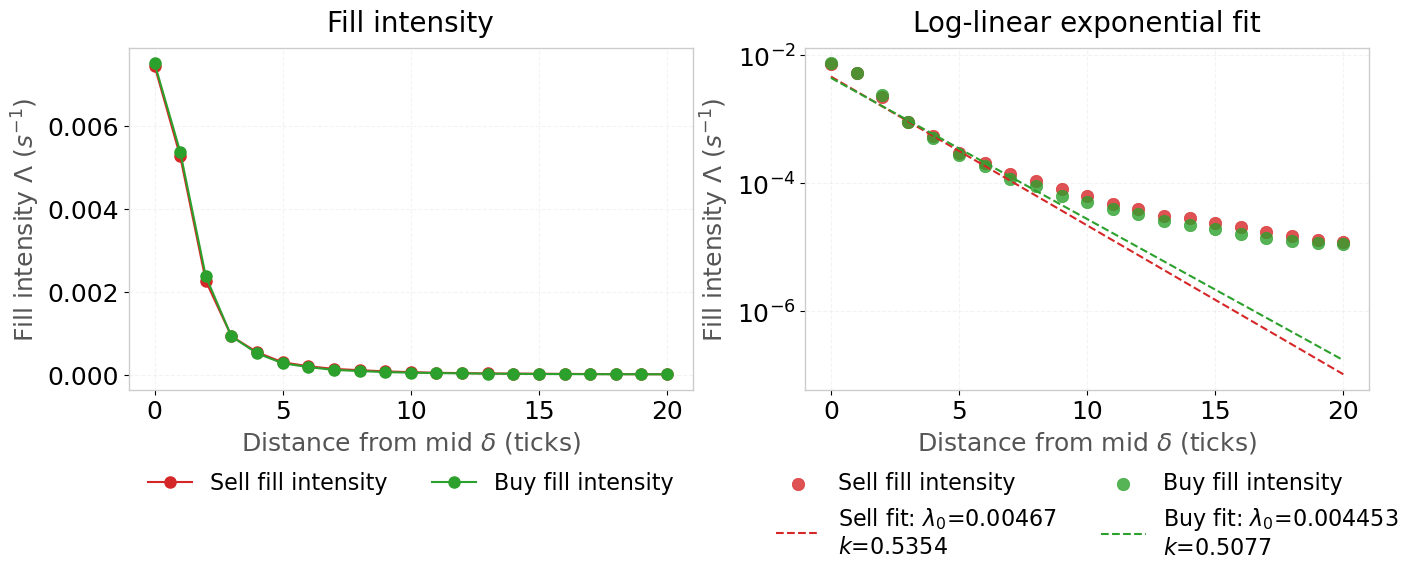
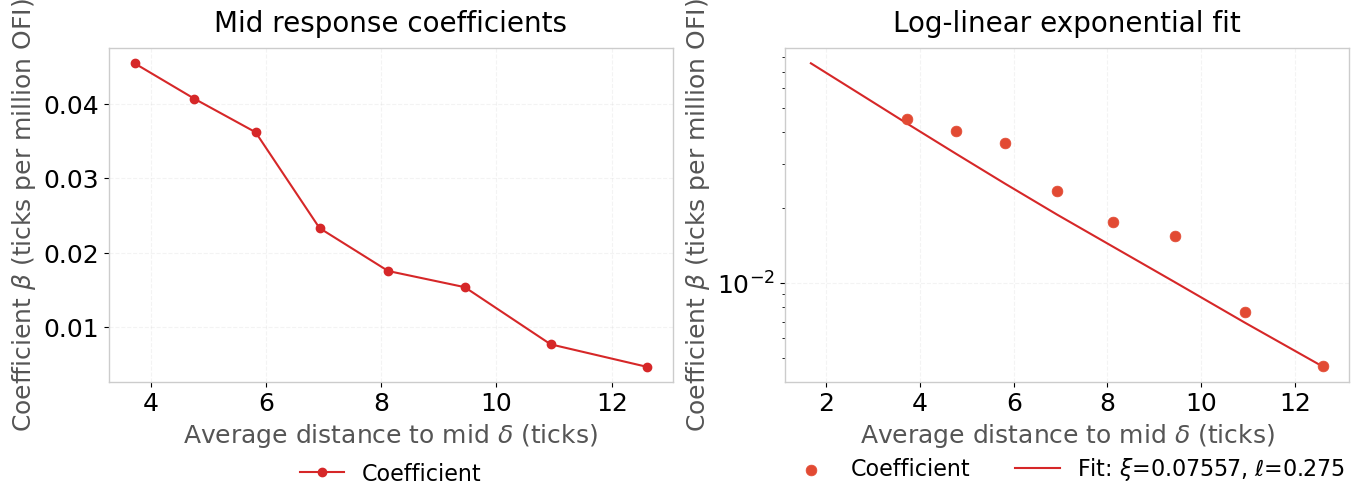
  • Equities: The exponential decay rates for fill intensity β(δ)\beta(\delta)1 are much steeper than those for impact β(δ)\beta(\delta)2, with β(δ)\beta(\delta)3. Empirical fits (Figure 5, Figure 6) support the primary modeling hypothesis.
  • FX: The gap between decay rates is smaller, requiring the more general case β(δ)\beta(\delta)4. Still, exponential decay in both fill probability and impact is evident (Figure 7, Figure 8). Figure 5

    Figure 5: Fill intensity estimation for TSLA, showing empirical fill probabilities and exponential fits.

    Figure 6

    Figure 6: Passive impact estimation for TSLA, showing MLOFI impact coefficients and exponential fit.

    Figure 7

    Figure 7: Fill intensity estimation for GBPUSD, with 10-second bucketed fill intensity and exponential fit.

    Figure 8

    Figure 8: Passive impact estimation for GBPUSD, showing MLOFI price impact coefficients and exponential fit.

These calibrations support both the parametric structure and the adequacy of the mesoscopic execution model across market microstructures: equities (price-time priority LOBs) and FX (fragmented, bilateral, or quote-driven venues).

Model Extensions and Generalizations

Heterogeneous Decay Rates

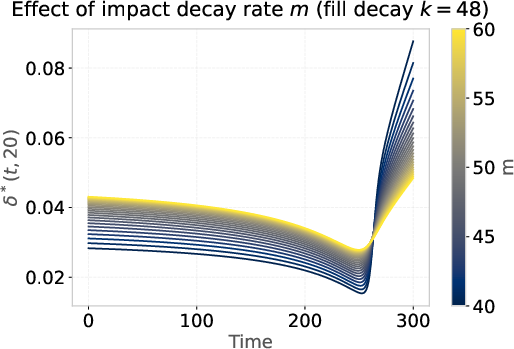
In FX and other contexts where β(δ)\beta(\delta)5, the optimal quote can still be written semi-explicitly, but now involves the principal branch of the Lambert W function due to the misalignment in fill and impact decay rates. This broader class of models accommodates empirically observed differences in market structure and information environments. Figure 9

Figure 9: Effect of the passive impact decay parameter β(δ)\beta(\delta)6 on the optimal quote depth β(δ)\beta(\delta)7.

Transient Impact

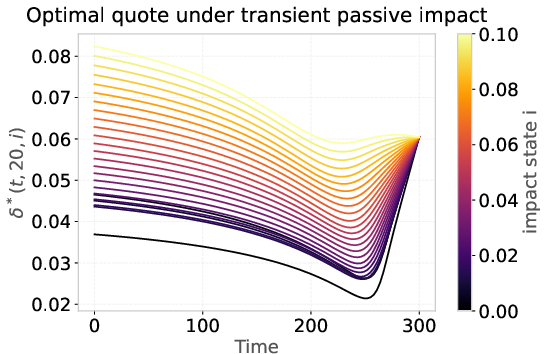
Moving beyond permanent impact, the model admits a specification in which passive impact decays at resilience rate β(δ)\beta(\delta)8. The associated control problem increases in state dimension, and the optimal quoting rule adapts dynamically to the current level of transient (recovering) impact.

Target Execution Schedules

Risk penalties can penalize deviation from deterministic target inventory paths (e.g., TWAP trajectories), yielding optimal strategies that interpolate between classical market order–driven execution and stochastic fill-driven paths. Figure 10

Figure 10: Optimal quote depth β(δ)\beta(\delta)9 under various model extensions and target schedules.

Figure 11

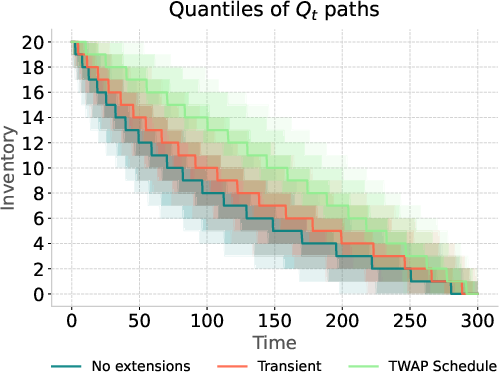
Figure 11: The median path of the inventory δ\delta0 across the baseline, transient impact, and TWAP-target extensions, shading quantiles.

Theoretical Insights and Implications

A distinctive theoretical result is that—contrary to the Almgren-Chriss/MO setting—permanent passive impact does affect trading rates due to nonlinearity in fill probability as a function of quote distance. The optimal path exhibits characteristic convexity, mediated by the joint effects of inventory risk and passive impact. Extensions to transient impact confirm that the optimal profile approaches TWAP as resilience increases.

The explicit, tractable solution in the δ\delta1 case provides analytical benchmarks for both theoretical work and empirical calibration. The modeling architecture supports immediate inclusion of more complex features (state-dependent parameters, adverse selection, cross-asset portfolios). Importantly, the empirical methodology is constructed to be implementable on publicly available L2/L3 market data, enhancing reproducibility.

Limitations and Future Directions

While the reduced-form, tactical model summarizes key economic forces, it bypasses explicit treatment of adverse selection, dynamic order size, multi-venue posting, and asymmetric information. Additionally, fill and impact parameters are held static in the baseline model, whereas in real-world execution they may depend on local microstructure features and market conditions.

The model forms a foundation for both further theoretical extension (such as cross-impact, state-dependent kinetics, and learning-based execution strategies) and practical applications in algorithmic liquidity provision and risk management. Precise calibration to trader-tagged order data and integration with modern reinforcement learning approaches remain open areas.

Conclusion

This paper rigorously formulates and solves an optimal execution problem recognizing that passive trading strategies generate their own systematic price impact at the mesoscopic level. The model unites empirical microstructure regularities with tractable optimal control, showing that optimal limit order execution must balance inventory risk, execution probability, and endogenous market impact. The framework supports a diverse spectrum of market environments and sits naturally between microscopic order-book modeling and coarse empirical calibration, offering both robust theoretical insights and practical implementational guidance for sophisticated algorithmic execution strategies.

Paper to Video (Beta)

No one has generated a video about this paper yet.

Whiteboard

No one has generated a whiteboard explanation for this paper yet.

Explain it Like I'm 14

Overview

This paper studies how to sell a big chunk of shares using limit orders in a smart way. A limit order is like saying “I’ll sell if the price reaches this level.” The twist here is that even “passive” selling (placing patient limit orders rather than rushing to sell at the current price) can still move the market price. The authors build a simple, math-based model that explains and optimizes this effect, then test it on data from US stocks (NASDAQ) and foreign exchange (FX).

What questions did the paper ask?

  • How does placing a sell limit order farther from the current price change: 1) the chance it gets filled, and 2) the way prices shift because of your order?
  • Given those effects, where should a trader place their limit orders over time to sell a large position with good results: avoiding too much price impact but also avoiding not getting filled?

How did they study it? (Methods in everyday language)

Think of selling with limit orders like setting a “trap” for buyers:

  • If you set the trap close to the current price, it’s likely to catch a buyer quickly, but it may also nudge the overall market price down more (because your intentions and the extra supply you show affect others).
  • If you set it farther away (a higher ask price), it’s less likely to be filled soon, but it may push prices less.

Two key real-world facts back up the model:

  1. Fill chance drops fast with distance: The farther your limit price is from the current “midprice” (the average of the best buy and sell quotes), the less likely it is to trade soon. Data suggests this drop is roughly exponential, which means “it falls off very quickly.”
  2. Prices react to order flow: Short-term price changes tend to move in the same direction as the imbalance of buying vs. selling pressure (called “order flow imbalance”). In simple terms: lots of visible sell interest tends to pull prices down a bit, even before those orders actually trade.

The authors combine these two facts into a compact rule:

  • Fill intensity (the “how fast it fills” rate) ≈ λ e{-kδ}
  • Passive price impact rate (the “how much your quoting pushes price”) ≈ η e{-mδ} Here, δ is “distance” of your quote from the midprice (in ticks), and λ, k, η, m are numbers estimated from data. Exponential decay e{-kδ} means each tick farther away reduces the effect by a constant percentage.

Then they pose an “optimal execution” problem:

  • You start with a big inventory to sell by a deadline.
  • At each moment, you choose how far from the midprice to place your sell quote.
  • You trade off three things:
    • Higher fill chance (quote closer) vs.
    • More price impact (hurts your overall selling price) vs.
    • Risk of not finishing on time (inventory risk).

Mathematically, they solve a control problem (using an HJB equation) and, in an important special case where the two decays match (m=km = k), they get a clean, explicit strategy for where to place the quote over time.

What did they find and why it matters?

Here are the main takeaways, explained simply:

  • A simple, data-driven formula for passive impact:
    • The model says passive impact falls off exponentially with quote distance, just like fill chance. This gives traders a clear, tunable “knob” (δ) to balance speed vs. impact.
  • Optimal behavior over time:
    • Early on, when you still have a lot to sell, the best move is to quote closer to the market to get fills faster.
    • Near the end, the strategy often becomes less aggressive (quotes step farther away). Why? Because pushing the price down now hurts the value of all your remaining shares. Sometimes it’s better to risk holding a bit than to damage the price of your entire position.
  • Stronger passive impact → less aggressive quoting:
    • If your quoting is known to move prices more (larger η), the optimal strategy is to back off (place quotes farther away), accept slower fills, and protect the overall selling price.
  • Equity vs. FX calibration:
    • In US stocks (NASDAQ), the data suggests that the “fill chance decay” k is much larger than the “impact decay” ℓ, so mkm \approx k. Practically, that means impact and fill chance drop off at about the same fast rate with distance—making the simple case m=km = k a good fit.
    • In FX, ℓ is more noticeable relative to k, so the gap between impact decay and fill decay is bigger. The paper studies this harder case too and explains why FX market structure (lots of dealer quotes, OTC trading, less detailed public order book info) may lead to different behavior.
  • Link to classic models:
    • In the well-known Almgren–Chriss setup (focused on market orders), permanent impact affects profits but not the trading schedule. Here, because the trader controls quote distance and passive impact is tied to that choice, permanent impact actually shapes the timing/shape of the liquidation curve.

What could this change? (Implications)

  • Better limit-order algorithms: Traders can use the model to choose quote distances that balance speed against price impact, especially when they prefer passive execution.
  • More realistic cost forecasts: Including passive impact can improve estimates of trading costs and reduce nasty surprises.
  • Market-by-market tuning: Since equities and FX show different decay patterns, the same idea adapts to each market’s “micro-physics” of trading.
  • Tactical clarity: The model captures what actually happens in practice—fills usually come from a sequence of quote updates across venues—not a single untouched order waiting in line. This “mesoscopic” view gives practical guidance without needing every microscopic detail of the order book.

Helpful terms in plain language

  • Midprice: The average of the best buy and best sell prices at a moment.
  • Limit order: An order to buy or sell at a specific price or better. Passive limit orders wait for someone to come to your price.
  • Passive impact: The way simply showing (and adjusting) your quoted price and size can nudge the market price, even before you trade.
  • Order flow imbalance: A measure of buy vs. sell pressure. More sells showing/arriving tends to push the price down a bit.
  • Exponential decay (e{-kδ}): Each extra “tick” you move away cuts the effect by a constant fraction, so things drop off quickly with distance.
  • Optimal execution: Finding the best way to split and time a large trade to reduce costs and risks.


Open Problems

We haven't generated a list of open problems mentioned in this paper yet.

Tweets

Sign up for free to view the 1 tweet with 2 likes about this paper.