ARFBench: Benchmarking Time Series Question Answering Ability for Software Incident Response
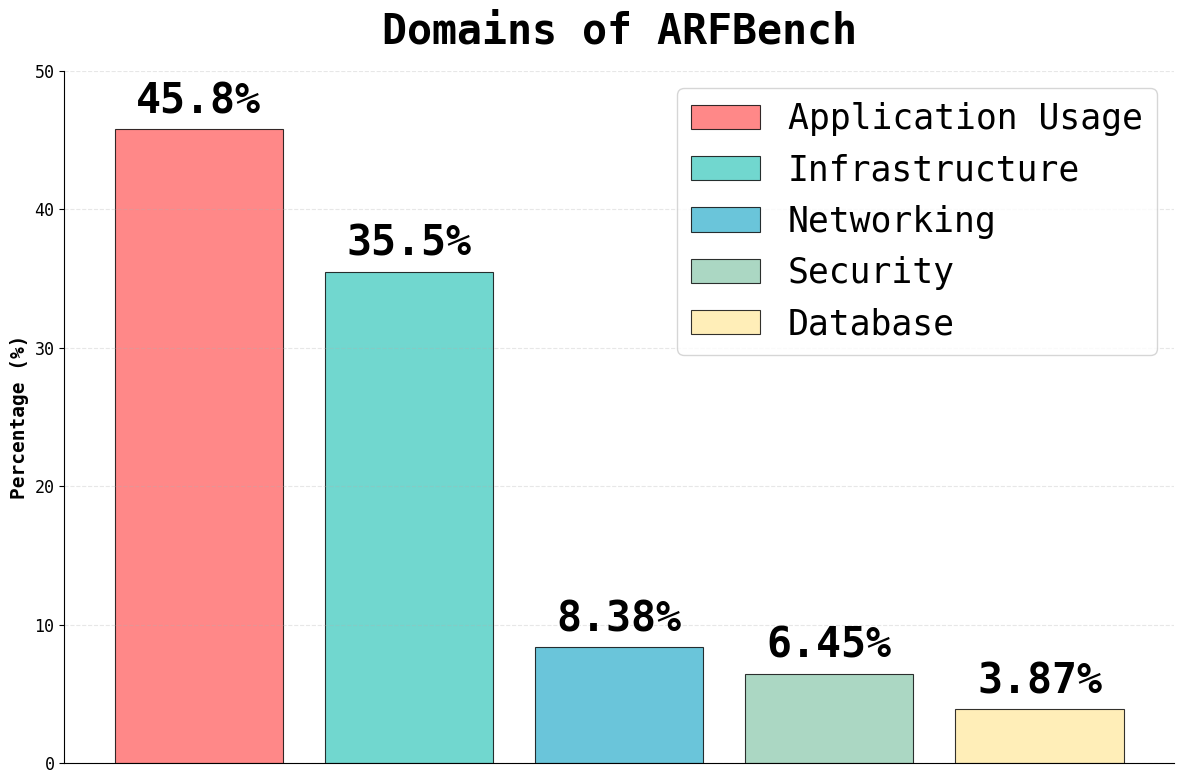
Abstract: Time series question-answering (TSQA), in which we ask natural language questions to infer and reason about properties of time series, is a promising yet underexplored capability of foundation models. In this work, we present ARFBench, a TSQA benchmark that evaluates the understanding of multimodal foundation models (FMs) on time series anomalies prevalent in software incident data. ARFBench consists of 750 questions across 142 time series and 5.38M data points from 63 production incidents sourced exclusively from internal telemetry at Datadog. We evaluate leading proprietary and open-source LLMs, VLMs, and time series FMs and observe that frontier VLMs perform markedly better than existing baselines; the leading model (GPT-5) achieves a 62.7% accuracy and 51.9% F1. We next demonstrate the promise of specialized multimodal approaches. We develop a novel TSFM + VLM hybrid prototype which we post-train on a small set of synthetic and real data that yields comparable overall F1 and accuracy with frontier models. Lastly, we find models and human domain experts exhibit complementary strengths. We define a model-expert oracle, a best-of-2 oracle selector over model and expert answers, yielding 82.8% F1 and 87.2% accuracy and establishing a new superhuman frontier for future TSQA models. The benchmark is available at https://huggingface.co/datasets/Datadog/ARFBench.
Paper Prompts
Sign up for free to create and run prompts on this paper using GPT-5.
Top Community Prompts
Explain it Like I'm 14
Overview
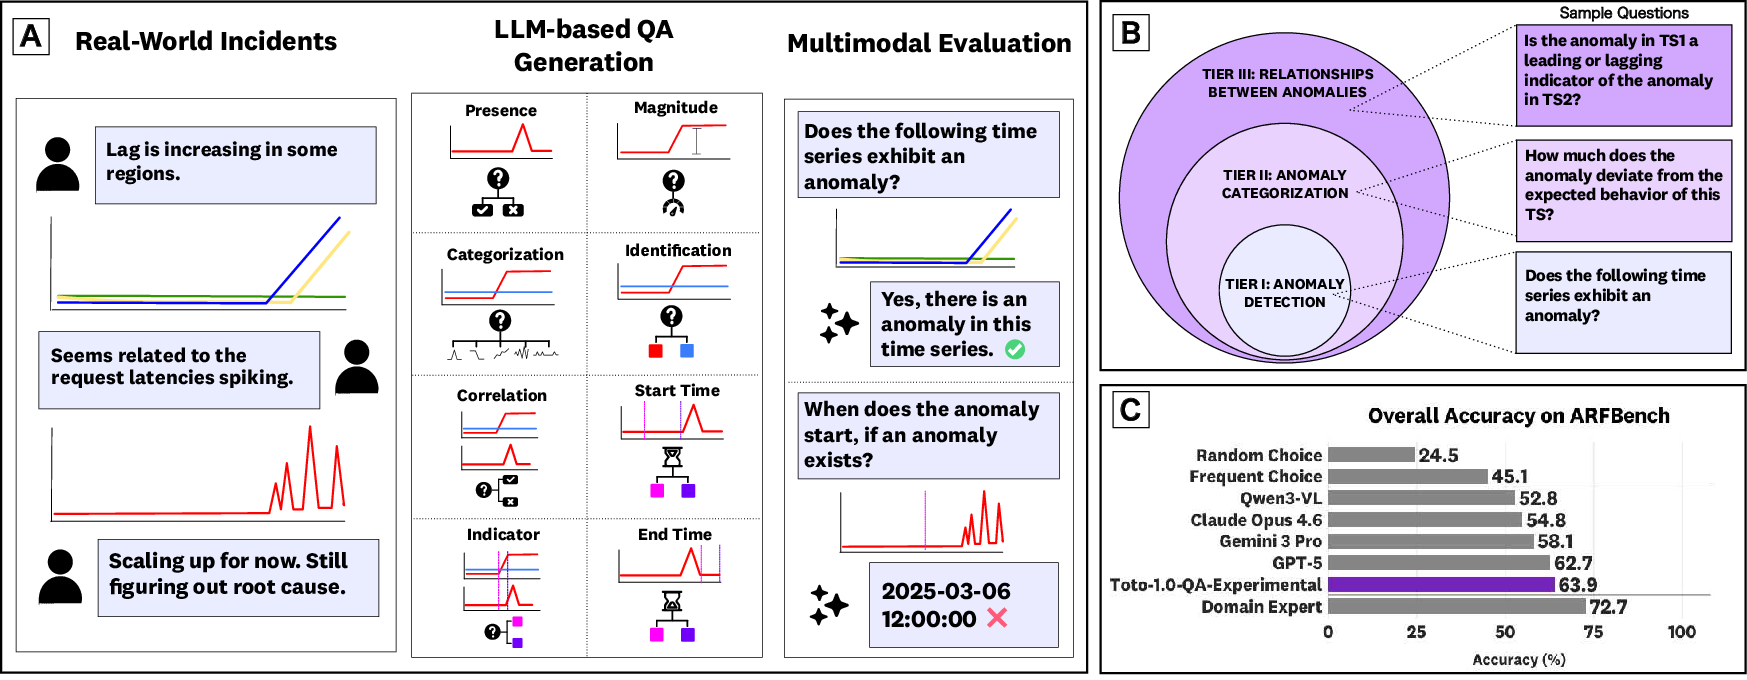
This paper introduces ARFBench, a new way to test how well AI models can answer questions about “time series” data during real software problems (like website outages). Time series are measurements collected over time (for example, CPU usage every minute). When systems break, engineers stare at lots of these timelines to spot weird patterns (called anomalies), figure out what went wrong, and fix it fast. ARFBench turns that real-life process into 750 multiple-choice questions built from 63 real incidents at Datadog, so we can see which AI models actually help.
What questions does the paper try to answer?
- Can today’s big AI models understand and reason about real, messy time series data the way engineers do during incidents?
- Which kinds of AI work best: models that read text (LLMs), models that look at pictures and read text (VLMs), or special time-series models?
- If we combine different types of models—or combine models with human experts—do we get better results?
- How should we fairly test these models on the kinds of questions engineers actually ask?
How did the researchers build and test it?
To make this practical and realistic, they used real incident data from Datadog and turned it into questions that mimic what engineers ask in the moment. Here’s how it works, explained in everyday terms:
- Time series as “system health charts”: Think of each time series like a heart-rate chart, but for software (CPU, errors, traffic, etc.). Sometimes these charts show strange spikes or drops—those are anomalies.
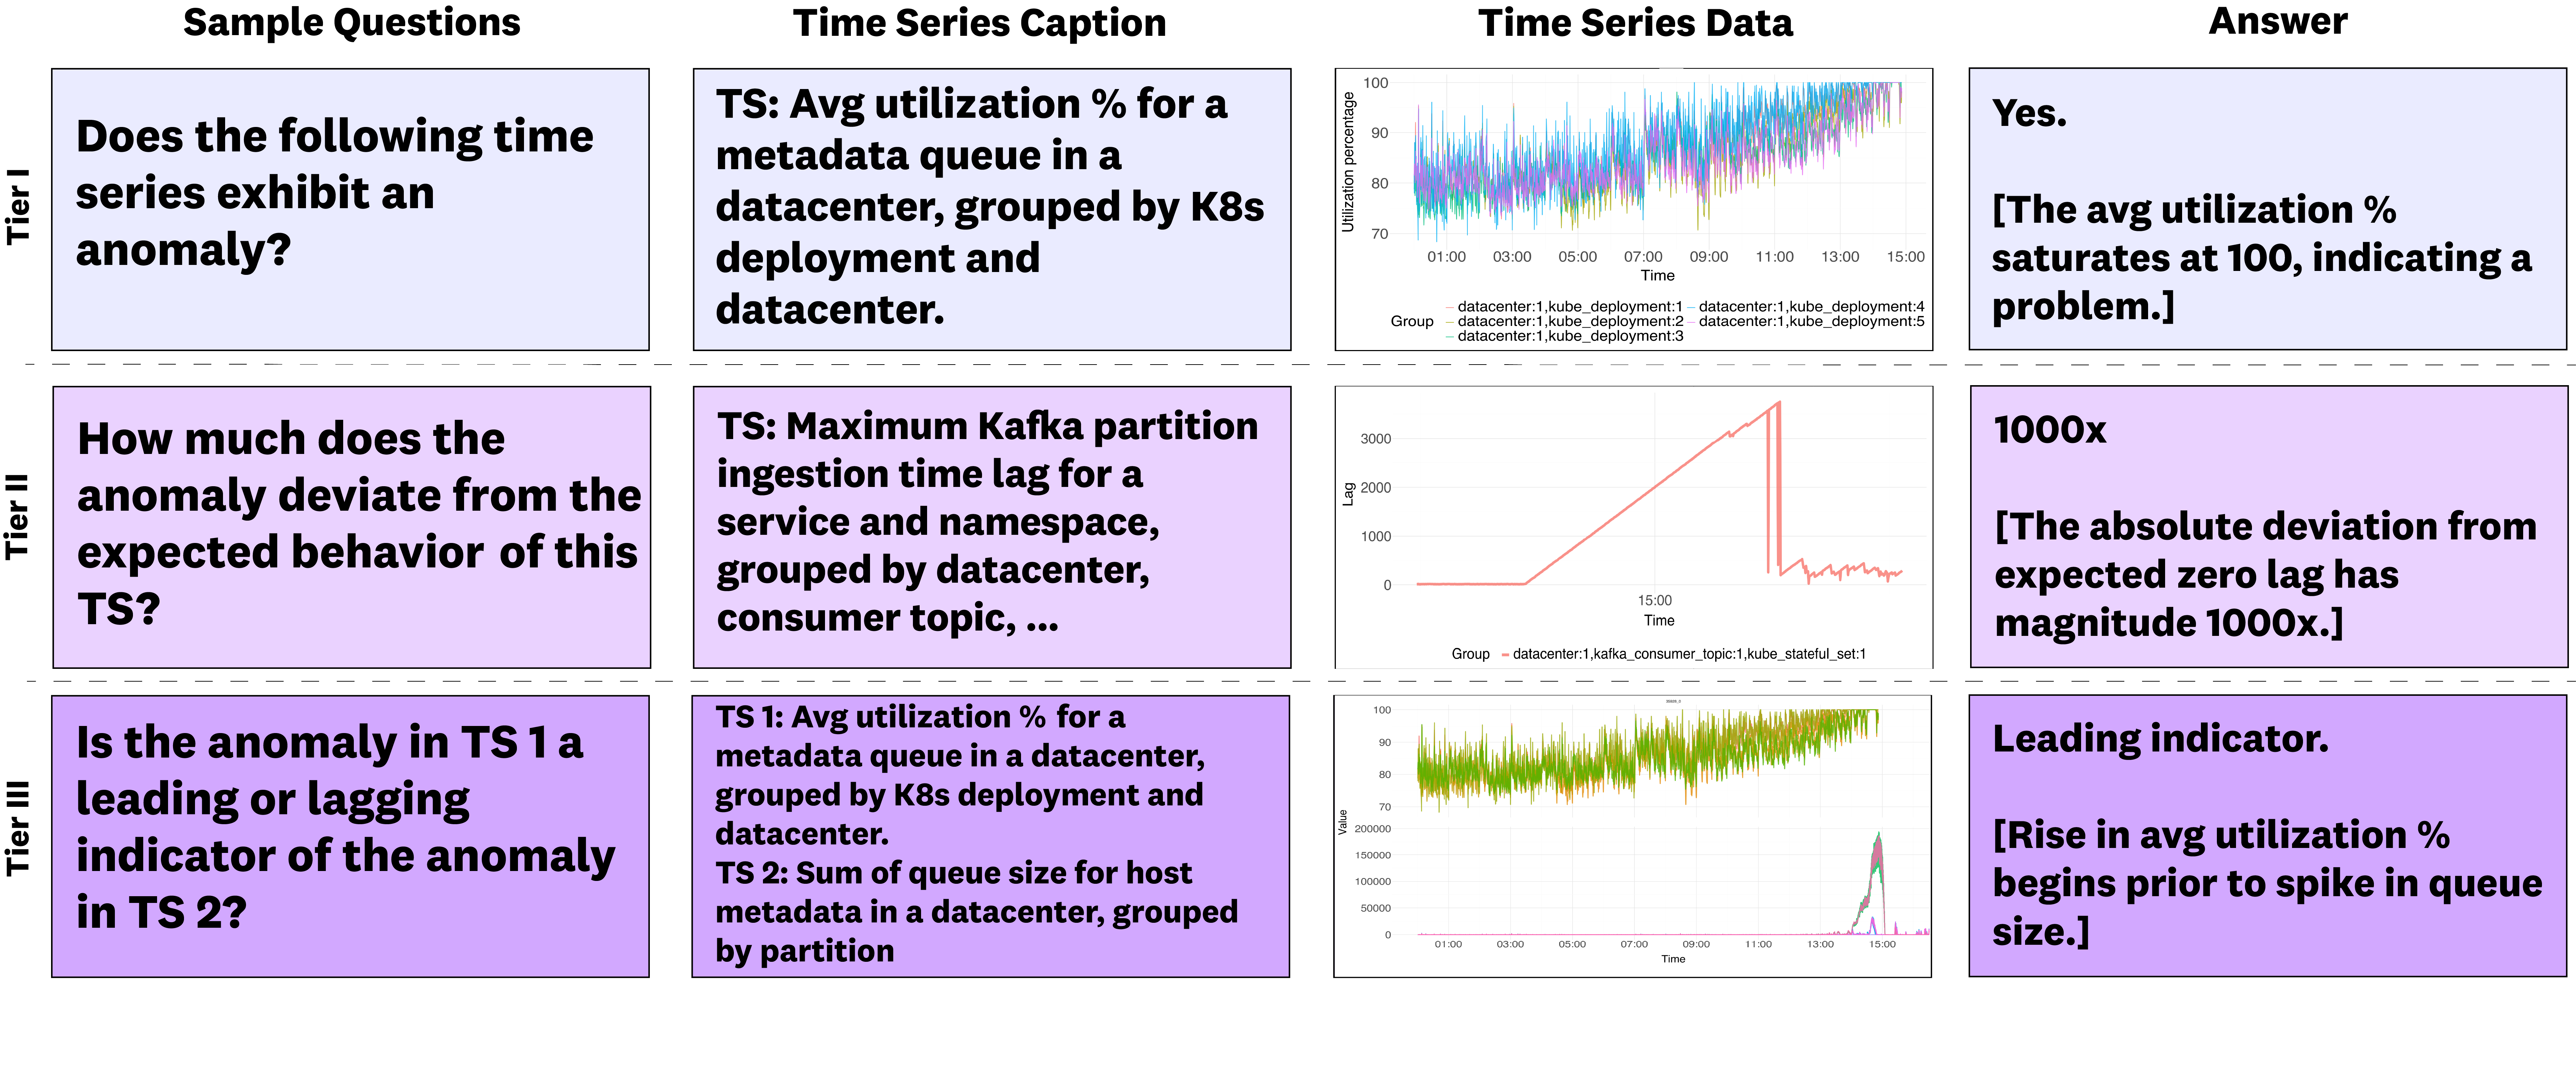
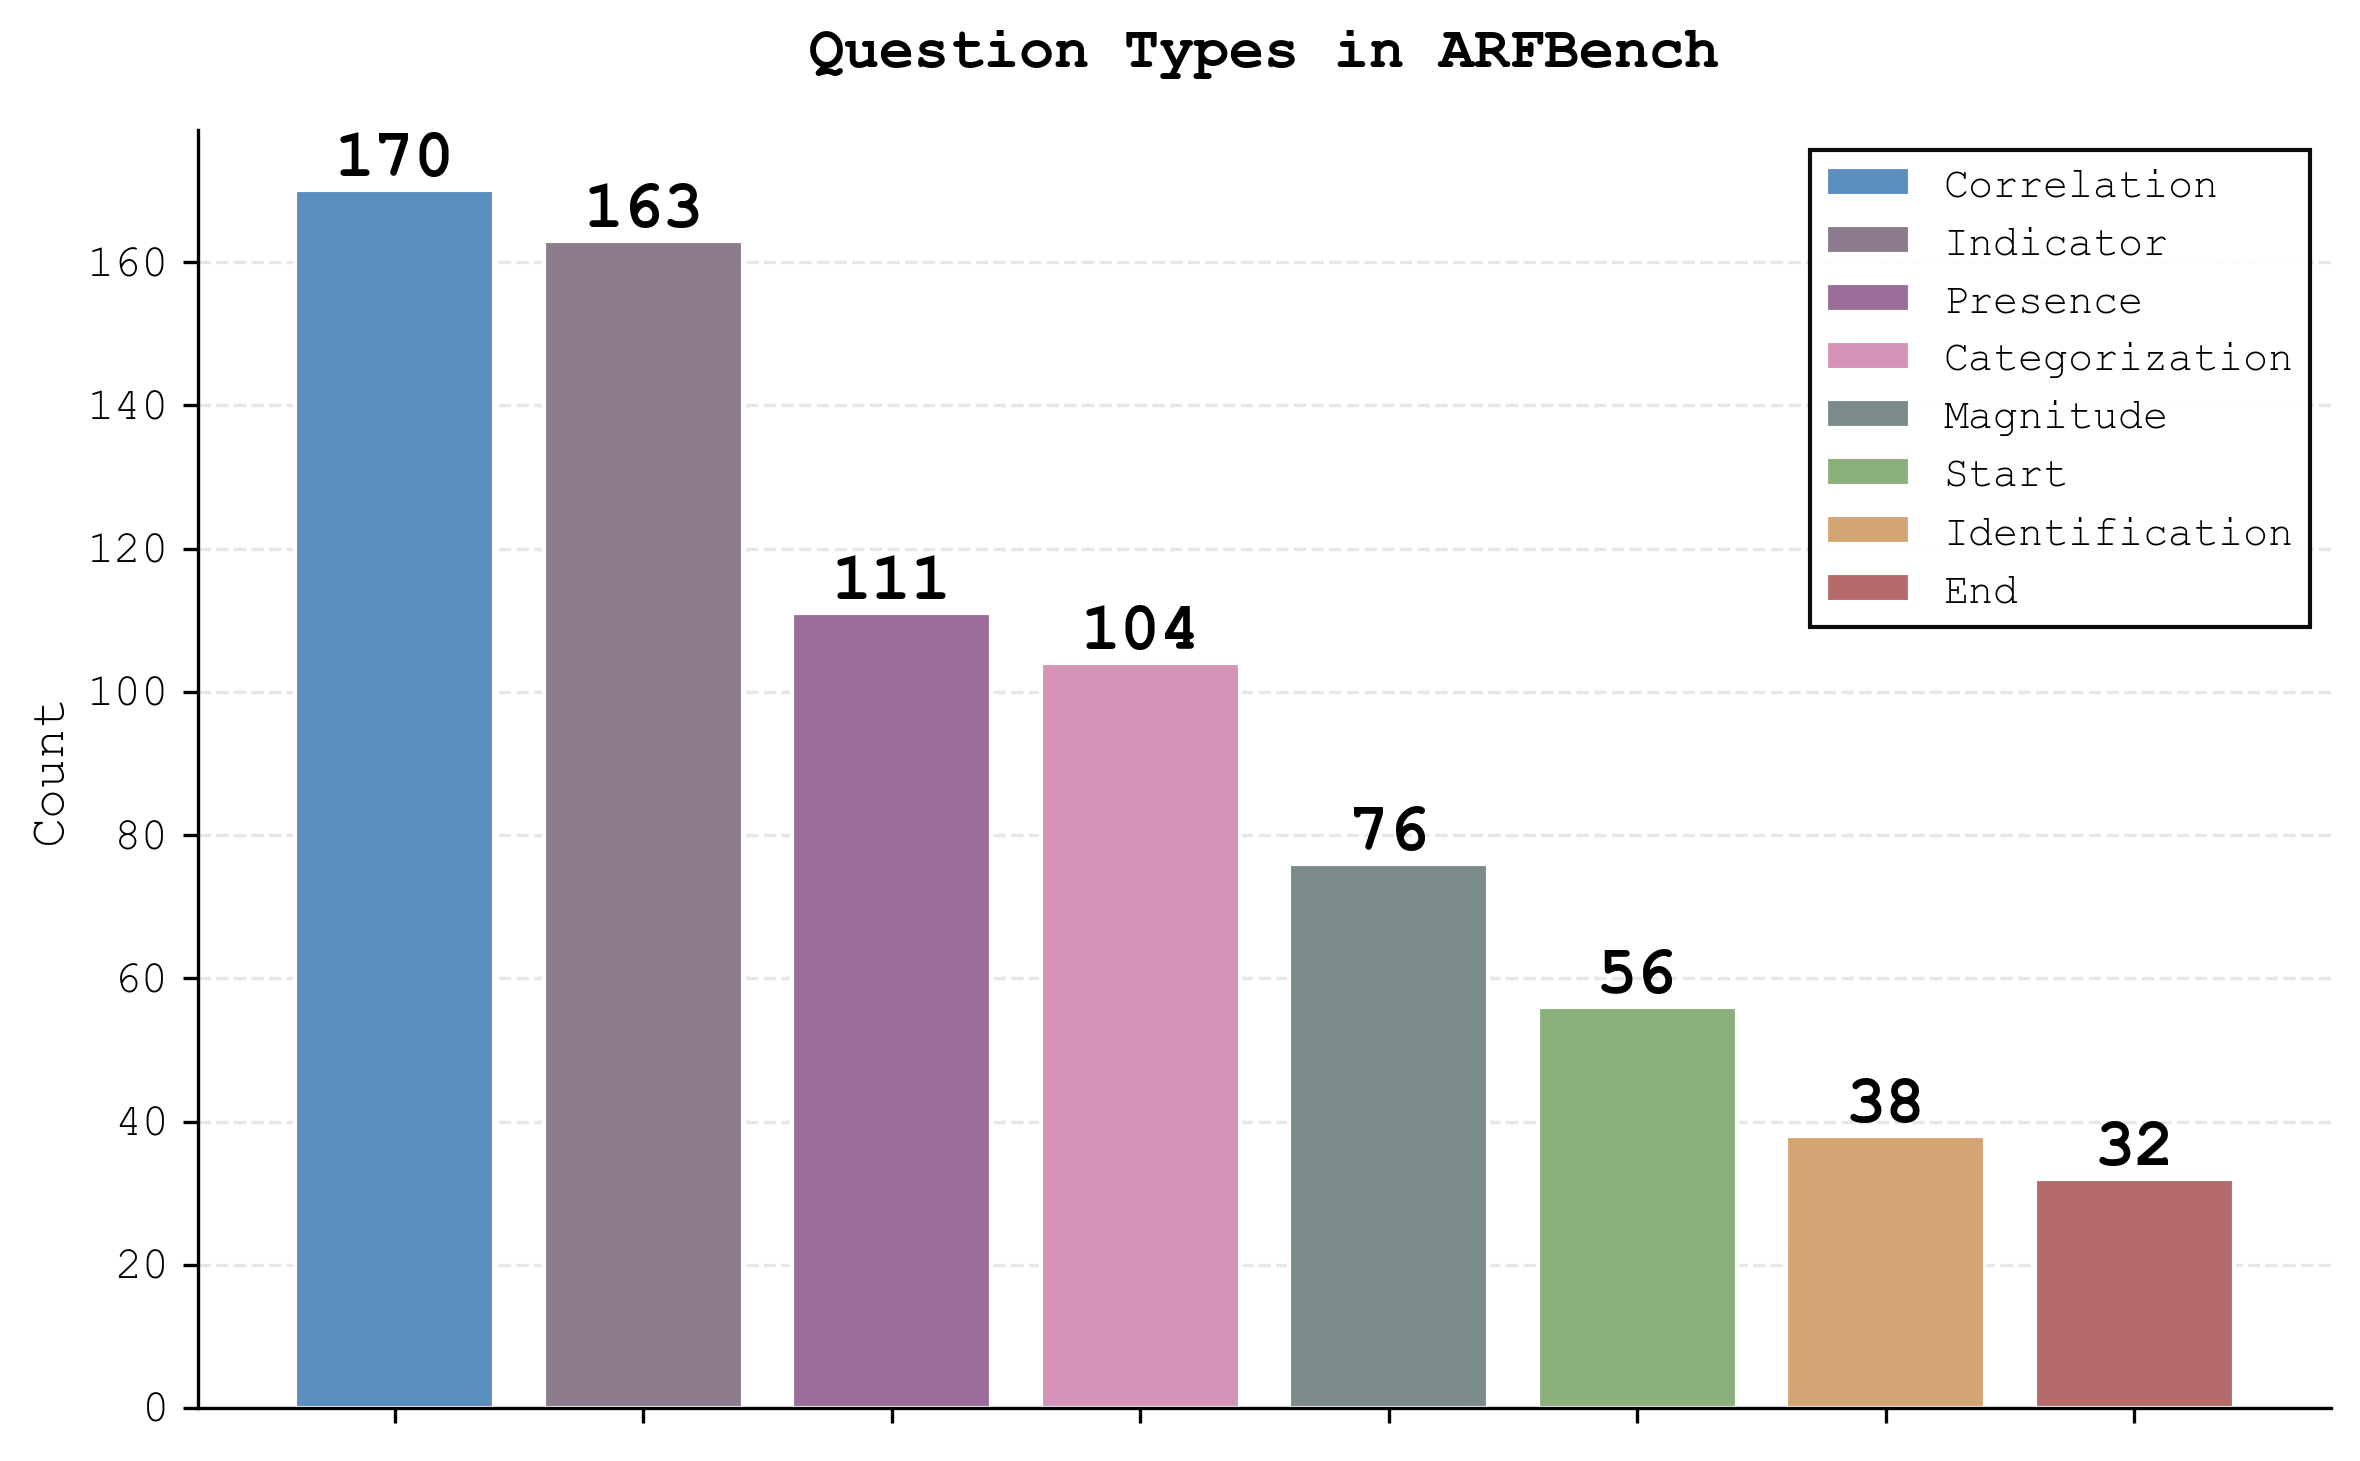
- Three levels of questions (like levels in a game):
- Tier I: Simple detection—Is there anything weird?
- Tier II: Details—How big is the weird change? When did it start or end? Which line (channel) is weird if there are many?
- Tier III: Relationships—Do two charts move together? Does one change before the other (leading vs. lagging)?
- Multiple-choice format: Instead of asking models to draw exact start/end times (which people often disagree on), the questions use choices like “Starts at 11:05,” “Starts at 11:20,” etc. This avoids arguing over tiny boundary details and tests reasoning, not perfect timing.
- Context matters: Each question includes a short, safe summary of what the chart represents (for example, “error rate by datacenter”). That’s important because whether something is “weird” depends on what it measures and what else is happening.
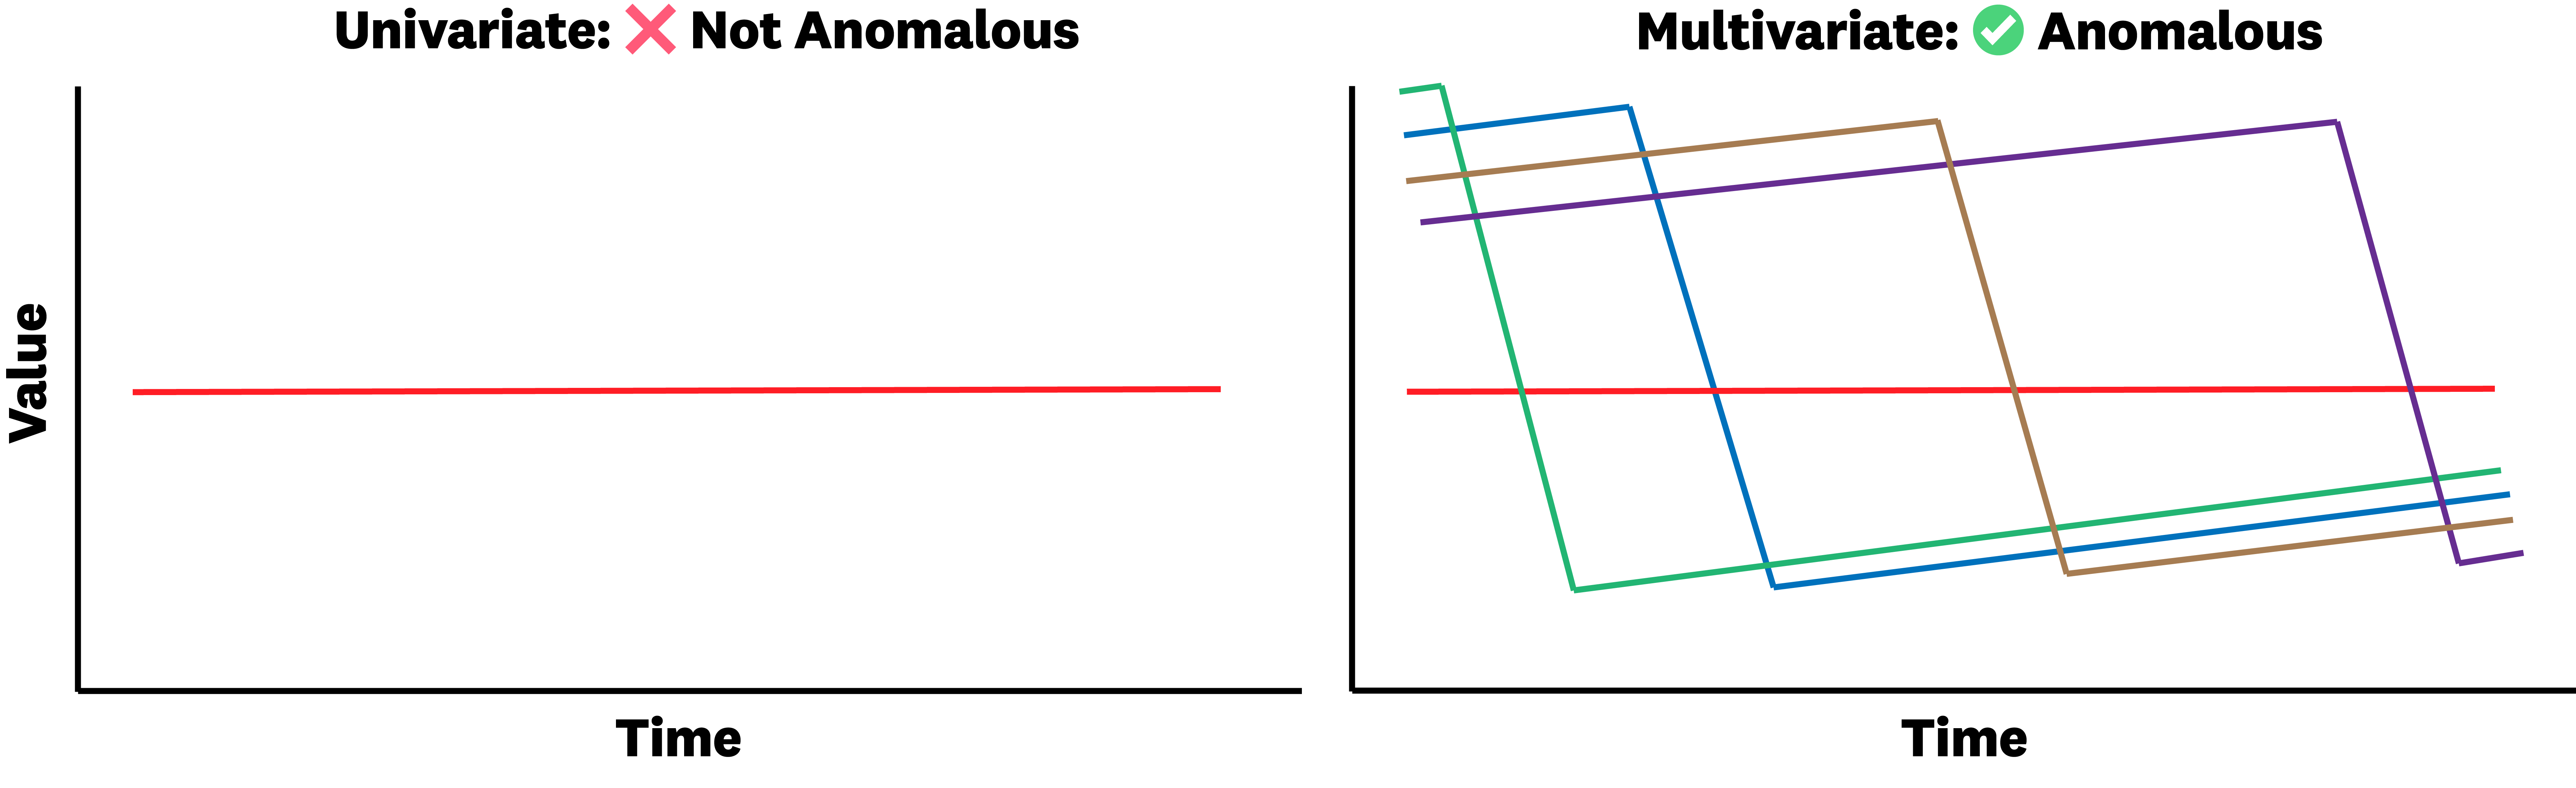
- Realistic, multivariate data: Many charts have lots of lines (channels)—sometimes thousands—like error rates per datacenter or per service. Models must decide what’s weird in the group, not just in isolation.
- How questions were made: An AI assistant (an “oracle” VLM) drafted answer choices using the chart plus the incident discussion (with private details stripped). Then humans checked and fixed everything to ensure correctness and privacy.
- Training data for model experiments: Besides the benchmark, the team created:
- 12,000 synthetic (fake but controlled) examples by injecting known anomalies.
- 395 real labeled examples from different incidents to fine-tune models.
- How performance was measured:
- Accuracy: percent of questions answered correctly.
- Macro-F1: a fairness score that checks if the model does well across all answer types, not just the common ones. This prevents “always pick the most common answer” tricks from looking good.
What did they find?
- Vision-LLMs (VLMs) lead: Models that can “see” charts and read text beat text-only models. The best general-purpose model they tested (called GPT-5 in the paper) got about 62.7% accuracy and 51.9% macro-F1—much better than random guessing.
- A hybrid model was very competitive: The authors built a new model by combining:
- a time-series foundation model (trained to understand system metrics), and
- a vision-LLM (good at reading charts and text).
- After some extra training on synthetic + real examples, this hybrid (Toto-1.0-QA-Experimental) matched or beat top models on accuracy (63.9%) and was close on macro-F1 (48.9%). It especially did well on the hardest “relationship” questions.
- Humans and models are good at different things: Domain experts did better overall than most models, but they and the models made different mistakes. When you combine a top model with a human expert and pick the best of their two answers, the “model-expert oracle” reached 87.2% accuracy and 82.8% macro-F1—well above either alone.
- Multivariate data is hard: Charts with many channels (like dozens or even thousands of lines) challenge models because they must spot the odd one out in context.
- Text-only models lag behind: LLMs that only read text did worse than models that also “see” the charts.
Why does this matter?
- Faster, smarter incident response: Better AI that understands time series can help engineers spot problems quicker, choose the right next steps, and reduce costly outages.
- Specialized + multimodal is the future: The strong results from the hybrid model suggest that combining time-series know-how with visual and language skills is a powerful direction.
- Humans + AI > either alone: Since people and models make different mistakes, pairing them can push performance to “superhuman” levels on this kind of task.
- A realistic, public testbed: ARFBench gives researchers and companies a tough, realistic benchmark grounded in real incidents, encouraging progress that transfers to the real world.
If you want to explore or build on this work, the dataset, leaderboard, and code are publicly available:
Knowledge Gaps
Knowledge gaps, limitations, and open questions
The paper introduces ARFBench and reports promising results, but several concrete gaps and open questions remain:
- Domain scope and external validity
- Benchmark data come exclusively from Datadog’s internal observability metrics; generalization to other organizations, tooling, and infrastructure stacks is untested.
- Only metrics are considered; integration with other incident modalities (logs, traces, events) is absent, limiting ecological validity for incident response.
- Dataset scale and coverage
- ARFBench is relatively small (750 QA pairs from 63 incidents, 142 time series); coverage of rare anomaly types and long-tail incident patterns is unclear.
- Tier/category balance and label distributions are skewed (evidenced by frequent-choice strength in Tier I/III); per-subgroup performance and difficulty calibration are not reported.
- Annotation quality and reproducibility
- The “oracle” VLM used to propose answer choices and putative labels is unspecified; reproducibility and potential circular bias toward that model’s priors are unresolved.
- Human verification is described but lacks inter-annotator agreement, adjudication protocol, and quality-control statistics; label noise is not quantified.
- Multiple-choice framing and construct validity
- Tasks are reduced to multiple choice with semantic bins, which sidesteps anomaly boundary ambiguity but may oversimplify real tasks (e.g., precise range localization, graded severity, uncertainty).
- The benchmark does not evaluate explanations or reasoning faithfulness; correctness-only scoring may hide shortcutting or surface-cue exploitation.
- Input representation and visualization effects
- Models are fed plots or tables, but the impact of plot style (axes, scaling, color, overplotting, legend ordering) on performance is not systematically studied.
- Handling of extreme multivariate cases (up to 2,283 channels) via visualization likely suffers from occlusion; best practices for representing high-dimensional series remain open.
- Context utilization and ablations
- Captions are derived from sanitized query strings; how much each context component (caption, tag names, historical window) contributes to performance is not quantified via ablations.
- Incident timeline text is used for generation but not at inference; the utility and risks of giving richer contextual evidence at test time remain unexplored.
- Metrics and evaluation protocol
- Only accuracy and macro-F1 are reported; calibration, confidence, abstention/deferral behavior, and cost-sensitive metrics (critical in incident triage) are not evaluated.
- No analysis of systematic error modes by anomaly type, time window length, channel count, or noise level is provided.
- Human baseline limitations
- The user study has only four participants (two domain experts), drawn from the same organization; broader human baselines and external annotators are needed for robust comparisons.
- Only a 25% subset was assessed; statistical power and variability across question types are not fully characterized.
- Correlation vs. causation and higher-order reasoning
- Tier III focuses on correlation and lead/lag; causal attribution, root-cause analysis, and confounder handling are not assessed.
- Tasks do not evaluate multi-hop temporal reasoning across more than two series or interventions/counterfactuals.
- Temporal/interactive setting
- ARFBench evaluates static snapshots; real incident response is iterative and interactive. No benchmarks of stepwise reasoning, tool use, or multi-turn TSQA are provided.
- TSFM–VLM modeling and training details
- The TSFM–VLM hybrid shows promise, but ablations isolating the contributions of the TSFM, VLM, projection layers, and each training stage (SFT vs RLVR) are limited; generality across different TSFMs/VLMs is unknown.
- Training relies on a small real set (≈207 labeled, augmented to 395) plus 12k synthetic series from Gaussian noise; realism gap and overfitting risks are not addressed with cross-domain or OOD evaluations.
- Synthetic data realism
- Synthetic anomalies are injected into Gaussian noise with simple magnitude scaling; diversity and fidelity to production anomaly morphologies (e.g., nonstationarity, bursts, regime shifts) are not validated.
- Model–expert collaboration
- The “model–expert oracle” is theoretical; practical selectors for when to trust the model vs defer to humans (and their deployment cost/latency trade-offs) are not developed or evaluated.
- Reproducibility and accessibility
- Some evaluated models are proprietary (e.g., GPT-5), hindering reproducibility; release status of post-trained hybrid weights is unclear.
- Prompt sensitivity and seed variance are not reported; standardized prompting and robustness to prompt changes remain open.
- Robustness and security
- Robustness to plot perturbations, missing data, scaling changes, or adversarial artifacts (e.g., misleading legends) is not examined.
- Effects of query sanitization on task difficulty and potential leakage of subtle cues in captions are not quantified.
- Scaling and efficiency
- The impact of time window length and channel count on performance and compute is not characterized; efficient encodings for very long, high-dimensional series remain an open design space.
- Multilingual and cross-cultural generalization
- All context appears to be in English; performance with multilingual captions and tags (common in global operations) is untested.
- Benchmark evolution
- Guidance for expanding ARFBench to include new tasks (e.g., remediation recommendation, anomaly ranking, forecasting under incident conditions) and additional modalities is not specified.
Practical Applications
Immediate Applications
The following applications can be deployed now by leveraging ARFBench, the TSQA task design, and the demonstrated hybrid TSFM–VLM post-training approach.
- Industry (Software/Observability/AIOps): Benchmark-driven model selection and acceptance testing
- What: Use ARFBench to evaluate, compare, and regression-test incident copilots, VLMs, and TSQA pipelines before deployment.
- Tools/products/workflows: Internal ARFBench leaderboard; CI checks that gate model updates on Tier II–III performance; per-category accuracy/F1 SLAs.
- Assumptions/dependencies: Task/domain match with production telemetry; data anonymization; ability to ingest multivariate plots or TS embeddings.
- Industry (Software/Observability): Incident TSQA copilot embedded in on-call tooling
- What: A chat assistant in Slack/PagerDuty/Datadog/Grafana that answers targeted questions about anomaly presence, start/end, magnitude, type, correlation, and lead/lag between metrics during incidents.
- Tools/products/workflows: Few-shot VLM baseline (e.g., Qwen3-VL, GPT-4/5 family) with prompt templates; chart rendering and tag-aware captions; RAG over incident timelines.
- Assumptions/dependencies: Reliable chart export for high-variate series; context length management; access controls for sensitive incident data.
- Industry (Observability vendors): Hybrid TSFM–VLM plugin for dashboards
- What: Deploy a TSFM encoder (e.g., Toto) + VLM text decoder hybrid (as in Toto-1.0-QA-Experimental) to handle long, multivariate series and output succinct answers/rationales.
- Tools/products/workflows: Variate embedding MLP and projection layers; LoRA adapters; staged SFT + RLVR (DAPO) training; synthetic + small real data recipes.
- Assumptions/dependencies: TSFM availability; GPU budget for joint inference; domain adaptation to customer metrics.
- Industry (AIOps/SRE): Confidence-aware human-in-the-loop triage using model–expert arbitration
- What: Route low-confidence or high-impact questions to humans and auto-accept high-confidence model answers; optionally pick between human/model answers via a simple selector.
- Tools/products/workflows: “Model–Expert Arbiter” microservice; calibrated confidence scoring; UX in incident rooms that shows rationale and confidence band.
- Assumptions/dependencies: Confidence calibration; governance and audit trails; monitoring for automation bias.
- Academia/Industry (ML Ops): Synthetic TSQA data generation at scale
- What: Bootstrap post-training with synthetic multivariate anomalies and templated questions before adding small, high-quality real examples.
- Tools/products/workflows: Anomaly injection pipeline; templated Q/A generation; RLVR with verifiable rewards (JSON-based correctness).
- Assumptions/dependencies: Coverage of realistic anomaly types; distribution shift from synthetic to production mitigated via small real datasets.
- Industry (Observability): Context-enriched alerts and dashboards
- What: Automatically summarize metric queries/tags into human-readable captions to improve incident comprehension and reduce false positives.
- Tools/products/workflows: LLM-based query summarizer; tag normalization; embedding captions alongside plots in alert payloads.
- Assumptions/dependencies: Access to metric query text and tags; PII redaction; quality control on summaries.
- Industry (Observability/Analytics): Multivariate anomaly reasoning modules
- What: Add modules that exploit structured groupings (datacenter, pod, service) to classify “which channels are anomalous” and “is this variate anomalous in context.”
- Tools/products/workflows: Variate-aggregation MLPs; per-group anomaly categorization; class-to-playbook mapping.
- Assumptions/dependencies: Stable tagging taxonomy; sufficient historical context; visualization updates to highlight group outliers.
- Education/Training (SRE/DevOps): TSQA drills and certification
- What: Use ARFBench-style QA tiers for onboarding, skills assessment, and periodic readiness drills focusing on anomaly reasoning and cross-metric correlation.
- Tools/products/workflows: Web-based exam using ARFBench-like items; item banks by tier/category; automated scoring and feedback.
- Assumptions/dependencies: Licensing or internal dataset creation; alignment with team runbooks; accessibility for non-domain experts.
- Cross-domain operations (Energy/Finance/Industrial IoT): Analyst-facing time-series Q&A on dashboards
- What: Allow analysts to ask “is this spike abnormal?”, “when did it start?”, “does signal A lead signal B?” directly on SCADA/market-risk dashboards.
- Tools/products/workflows: VLMs over chart images; optional TSFM–VLM for long multivariate feeds; domain-specific prompt seeds.
- Assumptions/dependencies: Domain adaptation and vocabulary; data permissions; risk controls for decision support.
- Daily life (Consumer/IoT/Personal health): Personal time-series Q&A
- What: Provide natural-language Q&A over wearables, home energy, or router telemetry (e.g., “Was there an unusual heart-rate pattern last night?”).
- Tools/products/workflows: On-device or cloud VLMs over charts; simple anomaly templates; privacy-preserving summarization.
- Assumptions/dependencies: Data connectors to devices; user consent and privacy; lightweight models for mobile/edge.
Long-Term Applications
These opportunities require additional research, scaling, or engineering before broad deployment.
- Industry (Software, Industrial IoT, Healthcare): Superhuman TSQA via model–expert ensembles and learned selectors
- What: Train selectors/judges to choose between multiple models and human inputs, operationalizing the observed complementarity to exceed either alone.
- Tools/products/workflows: Meta-learner for arbitration; reasoned uncertainty; continuous learning from postmortems.
- Assumptions/dependencies: Joint datasets with human and model responses; robust confidence estimation; latency/cost budgets.
- Industry (AIOps): Autonomous incident response agents
- What: Couple TSQA outputs (presence, type, correlation, lead/lag) with playbooks to propose or execute mitigations (e.g., rollback, traffic shift).
- Tools/products/workflows: Agent framework with guardrails; closed-loop validation; rollback safety; policy-based approvals.
- Assumptions/dependencies: High precision on Tier II–III tasks; change management; rigorous testing/sandboxing.
- Industry/Academia (Observability): Unified multimodal anomaly reasoning across metrics, logs, and traces
- What: Extend TSQA to joint reasoning over heterogeneous observability data, aligning signals across modalities and time.
- Tools/products/workflows: Joint encoders for time series + text + events; cross-modal correlation/causality modules.
- Assumptions/dependencies: Data integration and time alignment; label scarcity for multi-modal incidents; compute.
- Research (ML): General-purpose TSFM–VLM architectures for time-series reasoning
- What: Pretrain scalable hybrids over large multivariate corpora to natively handle long horizons, many channels, and diverse semantics.
- Tools/products/workflows: Foundation TS encoders; efficient variate pooling; curriculum data from synthetic→real; open evals.
- Assumptions/dependencies: Access to broad, de-identified datasets; training budgets; standardized benchmarks beyond observability.
- Policy/Standards (Regulators, Procurement): TSQA benchmarks as reliability and safety criteria
- What: Use domain-specific TSQA benchmarks to certify AI assistants for critical operations (utilities, healthcare IT, transportation).
- Tools/products/workflows: Sector-specific task suites; reporting requirements on per-tier F1/accuracy; incident auditable logs.
- Assumptions/dependencies: Stakeholder consensus on tasks/thresholds; mechanisms for third-party audits; privacy frameworks.
- Industry (Predictive maintenance/Operations): Causal discovery and prognostics from lead/lag and correlation tasks
- What: Use Tier III capabilities to map precursor signals and early warnings, feeding maintenance schedules or capacity planning.
- Tools/products/workflows: Causal graph learning atop TSQA outputs; intervention-aware validation; decision-support dashboards.
- Assumptions/dependencies: Causal confounder control; sufficient interventions for validation; domain expertise.
- Edge/Robotics/Manufacturing: On-device TSQA for real-time monitoring
- What: Deploy compressed hybrids that answer anomaly questions on-device for latency-sensitive equipment or robots.
- Tools/products/workflows: Quantization/distillation of TSFM–VLM; streaming variate embeddings; fallback to cloud for hard cases.
- Assumptions/dependencies: Hardware constraints; ruggedized inference; privacy/security requirements.
- Education/Workforce Development: Standardized TSQA curricula and credentials
- What: Formalize tiered question types into learning outcomes and practical exams for SREs, analysts, and operators across sectors.
- Tools/products/workflows: Open courseware; proctored exams; scenario-based labs using synthetic + real cases.
- Assumptions/dependencies: Industry adoption; maintained item banks; fairness/accessibility.
- Public sector (Smart cities/Utilities): Natural-language anomaly monitoring for infrastructure
- What: City engineers query sensor networks (traffic flow, water pressure, grid load) for anomalies and cross-signal relationships.
- Tools/products/workflows: Domain-tuned TSQA copilot; policy-compliant data sharing; incident timeline capture for learning.
- Assumptions/dependencies: Data governance and privacy; domain labels; resilience to sensor noise.
Notes on feasibility and dependencies:
- High-variate, long time series require either plot strategies tailored for VLMs or TSFM-based embeddings; hybrids mitigate context-length limits.
- Context matters: captions/tags and incident timelines significantly improve reasoning quality; data pipelines for summarization and de-identification are key.
- Synthetic data accelerates post-training but must be augmented with real, context-rich incidents to avoid overfitting to artificial patterns.
- Human–AI collaboration benefits from calibrated confidence, auditability, and clear UX to counter automation bias.
- Generalization outside observability (e.g., healthcare, finance, energy) requires domain-specific vocabularies, safety constraints, and additional evaluation.
Glossary
- Anomaly detection: The task of identifying significant deviations from expected behavior in time series. "Time series anomaly detection is the task of proactively predicting or reactively finding significant deviations from expected behavior and trends in time series"
- Anomaly injection: The process of inserting artificial anomalies into data to create controlled training or evaluation scenarios. "and often use synthetic anomaly injection."
- Bootstrapped 95% CIs: Confidence intervals estimated by resampling (bootstrapping) to quantify uncertainty in metrics. "Bootstrapped 95\% CIs resampled over 1000 batches of are provided for overall accuracy and F1."
- Compositional anomaly reasoning: Reasoning that combines multiple anomaly-related subtasks (e.g., detection, characterization, relationships) into multi-step analysis. "tasks are designed to evaluate compositional anomaly reasoning, with questions organized into three tiers of increasing difficulty"
- Cross-metric anomaly correlation: Assessing whether anomalies across different metrics are related in timing or pattern. "such as anomaly categorization and cross-metric anomaly correlation."
- DAPO: A PPO-style reinforcement learning recipe for post-training LLMs with verifiable rewards. "Stage 3 continues training from the Stage 2 checkpoint using RLVR with the DAPO recipe"
- Expert annotations: Human expert-authored evidence or labels that ground the benchmark’s QA pairs. "each QA pair is supported by expert annotations and additional incident context"
- Few-shot prompting: Supplying a small number of exemplars in a prompt to guide model behavior without full fine-tuning. "We use a few-shot prompting method (Appendix \ref{app: test-prompt}) for all models"
- Foundation models (FMs): Large pre-trained models that can be adapted to many tasks, often across modalities. "multimodal foundation models (FMs)"
- Label imbalance: Unequal frequency of classes in data, which can bias accuracy and necessitate robust metrics. "account for the label imbalance inherent in incident data"
- Leading/Lagging Indicator: A relationship where one time series consistently precedes (leads) or follows (lags) another in anomalous behavior. "Tier III difficulty (Correlation, Leading/Lagging Indicator) targets paired time series reasoning."
- LoRA: Low-Rank Adaptation, a parameter-efficient fine-tuning technique for large models. "we trained a different LoRA \cite{hu2022lora} adapter for the text decoder"
- Macro-F1: The unweighted mean of per-class F1 scores, emphasizing balanced performance across classes. "we compute overall, per-tier, and per-category accuracy and multiclass macro-F1."
- Model-expert oracle: A hypothetical selector that picks the correct answer from either a model or a human expert when either is correct. "We define a model-expert oracle, a best-of-2 oracle selector over model and expert answers"
- Multimodal: Involving multiple data modalities (e.g., text, images/plots, time series) for understanding and reasoning. "a TSQA benchmark that evaluates the understanding of multimodal foundation models (FMs)"
- Multivariate: Refers to time series with multiple channels/variables that must be analyzed jointly. "ARFBench includes highly multivariate series"
- Nonstationary: Statistical properties (e.g., mean, variance) change over time rather than remaining constant. "Observability time series are highly nonstationary and complex"
- Observability: The practice of monitoring systems via metrics, logs, and traces to assess software health. "observability metrics, or time series used to monitor the health of production software"
- Oracle VLM: A vision-LLM used during dataset construction to generate and select putative labels using full context. "We use the oracle VLM for the generation, filtering, and verification steps"
- PPO (Proximal Policy Optimization): A reinforcement learning algorithm that uses clipped policy updates for stable training. "a PPO-style asymmetric clipped objective."
- Reinforcement learning (RL): A framework where models learn by receiving rewards for actions, used here for post-training VLMs/LLMs. "reinforcement learning (RL) post-trained VLMs"
- Reinforcement learning with verifiable rewards (RLVR): RL setup where rewards are computed from objectively verifiable outputs (e.g., exact correctness). "we pose ARFBench as a time series reinforcement learning with verifiable rewards (RLVR) task."
- Semantic answer classes: Canonical label bins used to normalize varying raw answer choices across questions for consistent evaluation. "we map raw answer choices to predefined sets of semantic answer classes"
- Supervised fine-tuning (SFT): Training a pre-trained model on labeled data for a specific task. "The models were first trained with supervised fine-tuning (SFT) on the synthetic data"
- Telemetry: Automatically collected operational data (e.g., metrics) from production systems. "sourced exclusively from internal telemetry at Datadog"
- Time-range prediction problem: Framing anomaly detection as predicting precise start/end times of anomalies. "ARFBench does not evaluate anomaly detection as a time-range prediction problem."
- Time series encoder: A neural component that transforms raw time series into embeddings for downstream models. "Most time series LLMs feed time series as input to a time series encoder before passing the embedded input along to an LLM backbone."
- Time series foundation models (TSFMs): Pretrained models specialized for time series understanding, used here in hybrid architectures. "combining time series foundation models (TSFMs) with VLMs."
- Time series question-answering (TSQA): Asking natural-language questions to infer or reason about time series properties. "Time series question-answering (TSQA), in which we ask natural language questions to infer and reason about properties of time series"
- Variate: An individual channel/variable within a multivariate time series. "The high number of variates in ARFBench data poses major problems"
- Vision-LLM (VLM): A model that jointly processes visual inputs (e.g., plots) and text for reasoning/QA. "vision-LLMs (VLMs)"
- Zero-shot baseline: A model evaluated without task-specific training, relying only on pretraining and prompt context. "This allows for a zero-shot baseline that allows the model to ``cheat"."
Collections
Sign up for free to add this paper to one or more collections.

