- The paper presents SADU, a benchmark constructed from 154 curated diagrams with 2,431 QA pairs to assess VLMs on diagram recognition and reasoning tasks.
- The study finds that state-of-the-art VLMs achieve best accuracy around 70%, revealing significant challenges in handling diagram complexity and structured spatial information.
- Results highlight critical failure modes like counting errors and retrieval inconsistencies, underscoring the need for improved domain-specific prompts and spatial reasoning.
Benchmarking Vision-LLMs for Software Architecture Diagram Understanding
Motivation and Problem Setting
Software architecture diagrams serve as essential design artifacts in the software engineering lifecycle, encoding structural, behavioral, and data-centric information about system components and their interactions. Despite the proficiency of contemporary LLMs in code-generative tasks, the diagram-centric stages of software engineering remain vastly underexplored, particularly in the context of machine comprehension of visual artifacts. The paper presents SADU ("Software Architecture Diagram Understanding"), a benchmark specifically constructed to quantitatively evaluate VLMs (Vision-LLMs) on diagram-aware tasks, probing both recognition and reasoning in a modality closely tied to design semantics.
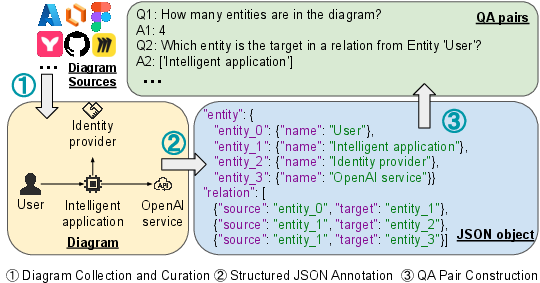
Figure 1: Overview of the SADU construction pipeline.
SADU Benchmark: Construction and Scope
SADU comprises 154 diagrams spanning behavioral, structural, and ER (Entity–Relationship) families collected from varied sources: Azure Architecture documentation, PyUNML, and several diagram-design platforms. Careful curation ensured high visual quality and coverage diversity, discarding low-resolution, unreadable, or non-architectural artifacts. Each diagram is annotated in a machine-readable JSON schema capturing entities, relations (with directionality and labels), clusters, attributes, and methods, establishing deterministic ground-truth for evaluation.
A set of 2,431 question-answer pairs targets 24 subtype templates, split between counting (e.g., entity cardinality) and retrieval (e.g., correct relation extraction). The QA pairs are designed to probe the models' ability to perform both perceptual recognition and higher-order reasoning.
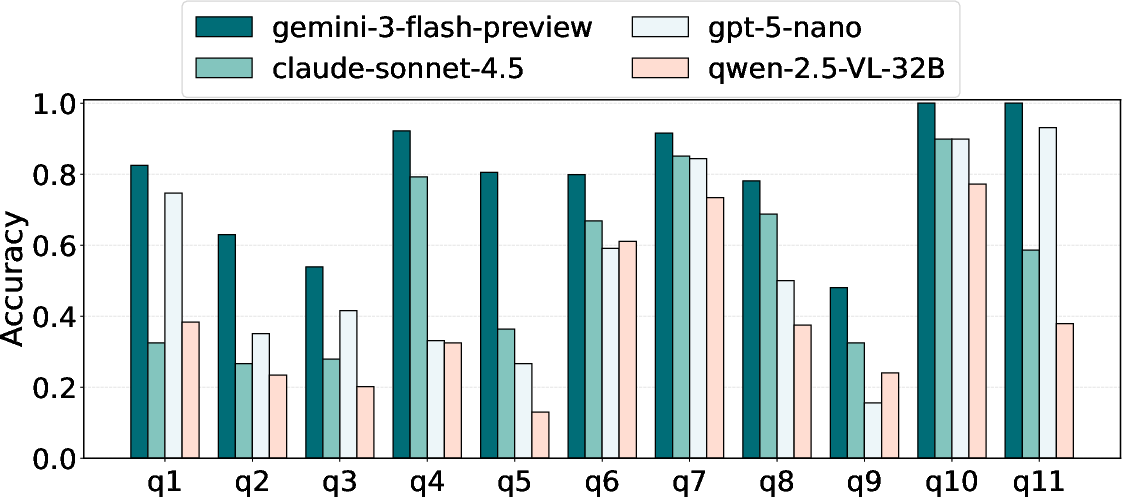
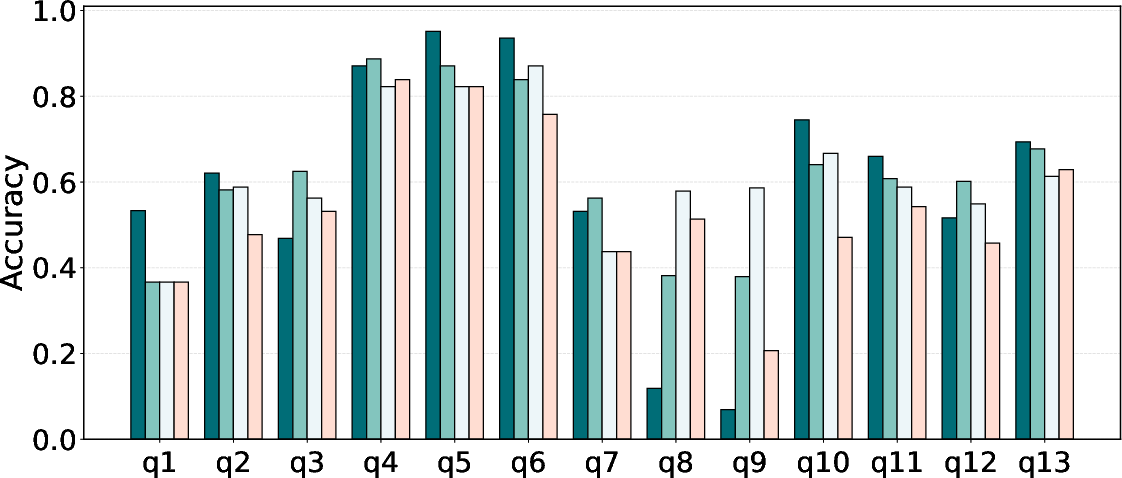
Figure 2: Distribution and definitions for counting questions across software architecture diagrams in SADU.
Experimental Design and VLM Evaluation
The study evaluates 11 VLMs across the Gemini, Claude, GPT, and Qwen families, encompassing both proprietary (e.g., gemini-3-flash-preview, claude-sonnet-4.5, gpt-5-nano) and open-weight models (e.g., qwen-2.5-VL-32B/7B/3B). Each QA task is prompted with explicit domain definitions and answering constraints, ensuring standardized input and facilitating robust comparative analysis. Model outputs are assessed by both rule-based deterministic scoring (exact match, tolerance, F1, subset/superset behaviors) and LLM-as-a-judge evaluation, the latter providing a more flexible semantic assessment.
Empirical Results and Analysis
Aggregate Model Accuracy
Empirical results indicate that software architecture diagram understanding remains an unsolved challenge for current VLMs. The strongest model, gemini-3-flash-preview, attains an overall accuracy of only 70.18%, followed by Gemini variants and Claude/gpt-5-nano in the mid-50% range. Open-source models (Qwen family) and lighter OpenAI variants perform substantially worse. Notably, higher model capacity does not guarantee higher efficiency—gpt-5-nano uses nearly 1,500 completion tokens per request, yet fails to outperform Gemini in accuracy.
Accuracy varies strongly by diagram type: ER diagrams are comparatively easier (e.g., gemini-2.5-flash reaches 82.54%), while behavioral diagrams induce greater model variance. Diagram complexity negatively correlates with accuracy, emphasizing the difficulty of visually dense or structurally intricate artifacts.
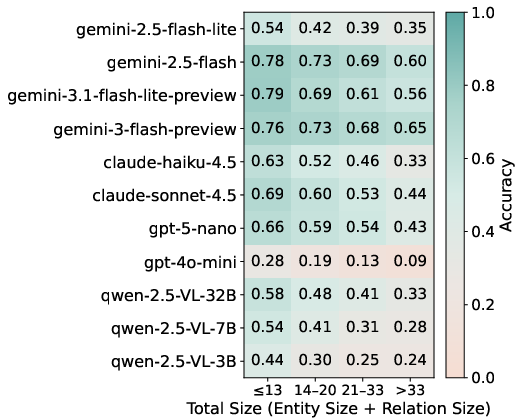
Figure 3: Model accuracy as a function of diagram complexity (entity and relation count).
Counting and Retrieval Failure Modes
Counting errors are predominantly near-miss (off-by-one/two) for stronger models (MAE ≤1), but degrade sharply for weaker models (MAE ≥3). Stronger VLMs maintain balanced bias in counting, while weaker models systematically under-count elements in complex diagrams, often missing entire clusters or relations. Tolerance-based metrics reveal that even when exact match fails, most errors for the strongest models remain within two counts.
Retrieval tasks are notably harder; even the best models frequently omit relevant elements (high subset rates) or introduce extraneous ones (superset errors are more prevalent in weaker models). Precision and recall metrics confirm partial lexical similarity is commonplace, but semantic grounding is inconsistent.
Prompting and Reasoning Configuration
The inclusion of domain-specific definitions in prompts yields substantial accuracy gains; explicit answering rules exert smaller but measurable effects. Absent definitions or rules, accuracy declines significantly. Interestingly, reasoning configuration (thinking levels) does not monotonically improve accuracy—Gemini's low thinking setting coupled with full prompt achieves the best result (72.85%). Overthinking phenomena (task confusion, scope inflation) induce more errors at higher reasoning levels, observed as both over-deliberated and erroneously substituted answers.
Evaluation Protocol Consistency
LLM-as-a-judge and rule-based scoring are highly correlated (≈90%+ agreement for most models), but LLM judges are more permissive for numerically or lexically “close” answers, and can occasionally accept semantically inconsistent responses that diverge from gold annotation.
Case Study: Visual Relation Reasoning
Hard cases such as long, multi, non-rightward, and overlapping arrows introduce significant visual grounding challenges in SADU. Strongest models (Gemini-3.1-flash-lite-preview) achieve up to 93.33% on Long Arrow but drop drastically (20–33%) on Overlap Arrow and Non-Rightward Arrow cases. These failures highlight brittleness in relational parsing and spatial inference. Models seldom generalize robustly to non-standard connector layouts, suggesting that visual relational semantics are a critical bottleneck in VLM architecture diagram understanding.
Limitations
The SADU benchmark omits fine-grained spatial annotation, restricting the granularity of failure-mode analysis, especially for visual ambiguity caused by layout geometry. Some diagrams may have appeared in VLM training corpora, but diversity and task focus are argued to mitigate memorization risk.
Implications and Future Directions
The findings indicate that current VLMs lack the structured reasoning and spatial abstraction required for robust diagram understanding, with practical deployment in high-stakes engineering settings not yet viable. Accurate comprehension of architecture diagrams is necessary for consistent upstream–downstream alignment in software development; current models remain unreliable.
Future developments should target architecture-aware visual reasoning, spatially grounded multimodal parsing, and domain-adaptive prompting strategies. Integration of geometric features, relational embeddings, and intent-level schema extraction will be crucial. SADU establishes a rigorous foundation for subsequent benchmarks and architectural AI workflows, enabling systematic measurement of progress.
Conclusion
Software architecture diagram understanding is a fundamentally different challenge from generic VQA, requiring invariance under layout complexity, visual ambiguity, and domain abstractions. SADU reveals a substantial accuracy gap and numerous structured failure modes in current VLMs. The benchmark and analyses provide actionable baselines and guidance for accelerating progress toward reliable diagram-aware AI systems in software engineering.