Volatility in Prediction Markets: A Structural Approach
Abstract: Forward-looking volatility forecasts are central inputs to derivatives pricing, market making, risk management, and volatility-linked trading strategies, with ARCH and GARCH models serving as the canonical workhorses. Such models are natural in standard asset markets, where prices are positive-valued stochastic processes and volatility is typically inferred from return dynamics. Prediction markets have a different structure: prices are bounded probabilities, payoffs are binary, and contracts resolve at known deadlines. We develop and estimate a volatility model tailored to binary prediction markets. The model combines two economic mechanisms: a Wright-Fisher deadline-resolution component, capturing how remaining binary uncertainty is forced to resolve over time, and a Glosten-Milgrom order-flow component, capturing volatility from informed trading as reflected in spreads and volume. Using a large panel of Kalshi contracts, we show that these structural variables carry substantial forecasting power. Plain ARCH/GARCH benchmarks are dominated by structural specifications; combining the structural model with residual GARCH dynamics gives the best overall forecasts. The model also provides an interpretable measurement framework: volatility is highest near fifty-fifty prices, rises near resolution, and varies across categories with the timing and discreteness of information arrival. Economics contracts are closer to smooth deadline-resolution dynamics, while sports contracts exhibit more event-concentrated, jump-like behavior. Across major categories, category-specific fitting does not systematically improve out-of-sample performance, suggesting that the structural specification transfers beyond the pooled headline result.
Paper Prompts
Sign up for free to create and run prompts on this paper.
Top Community Prompts
Explain it Like I'm 14
What this paper is about (big picture)
This paper studies how much prices in prediction markets are likely to move in the near future. A prediction market is a place where people trade “yes/no” contracts about future events (like “Will Team A win?”). The price is a probability between 0 and 1 (or 0% to 100%). Volatility here means “how big a price change is likely over the next hour or day.” Knowing this matters for traders, market makers, and anyone using these prices to make decisions.
The main questions the authors ask
In simple terms, the paper asks:
- Can we build a better model for predicting how much a prediction-market price will move soon?
- What makes these prices move: the ticking clock toward the event deadline, or bursts of informed trading (seen in spreads and volume), or both?
- Do common stock-market volatility tools (like ARCH/GARCH) work well here, or do we need a model designed specifically for prediction markets?
- Do the same ideas work across different topics (sports, politics, economics), or do we need separate models for each category?
How they approach the problem (methods in plain language)
The authors create a model tailored to yes/no prediction markets. It has two parts (think of them as two engines powering price movement):
- Deadline-resolution engine (the “clock”)
- Idea: As the event’s deadline gets closer, the remaining uncertainty must resolve. If the price is near 50%, we’re most unsure; if it’s near 0% or 100%, we’re mostly sure.
- The model uses a simple shape for uncertainty: p(1 − p), which is highest at p = 0.5 and lowest at 0 or 1.
- It also speeds things up as the deadline approaches: less time left means faster resolution.
- Put simply: the closer we are to the event, and the closer the price is to 50–50, the more the price is likely to move.
- Order-flow engine (the “trading tells”)
- Idea: Prices also move because of informed traders. Two signals of this in order books are:
- The bid–ask spread (s): the gap between the best buy and sell quotes. Wider spreads often mean market makers fear being picked off by informed traders.
- Trading volume (V): more trading can mean more information arriving.
- The model links these to extra volatility: more volume and a bigger spread mean larger likely moves.
Putting the two engines together
- The model’s one-step volatility (the predicted size of the next move) is the sum of the two parts:
- Deadline part: p(1 − p) divided by time left (τ)
- Order-flow part: a constant K times a function of volume times (s2)/4
- In a compact formula:
- h2 ≈ p(1 − p)/τ + K * ν(V) * s2/4
- Here, ν(V) is a simple way to turn volume into “how often info arrives,” and K is a fitted strength parameter.
What data they used and how they checked their model
- Data: A large set of hourly data from Kalshi (a prediction market) from August 2021 to April 2026, across many topics (sports, politics, economics, etc.). For each hour and contract, they observe price, spread, volume, and time to deadline.
- Target: Predict the size of the next hour’s price change.
- Evaluation: They turn each volatility forecast into a 95% prediction interval (a “likely range” for the next price). They score each interval using the Winkler score, which:
- Rewards intervals that are narrow (sharp)
- Penalizes intervals that miss the actual price (so you can’t just make them super wide)
- They also compare their model with standard ARCH/GARCH models (popular in stock markets), and with hybrid versions that add GARCH dynamics on top of the new structural model.
What they found (key results) and why it matters
Here are the main takeaways, explained in everyday terms:
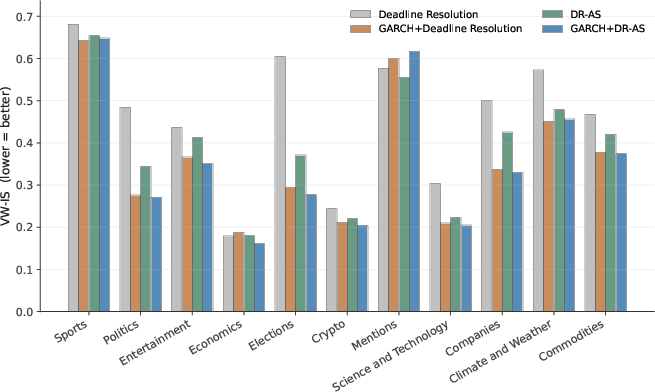
- The specially designed model beats the stock-market standards.
- Models that only use generic time-series patterns (plain ARCH/GARCH) perform much worse.
- Even the simple deadline part, p(1 − p)/τ, already improves a lot over those benchmarks.
- Adding the order-flow part (spread and volume) improves forecasts further.
- The best overall forecasts come from combining the structural model with a little leftover GARCH (to catch any remaining clustering).
- What drives volatility in prediction markets?
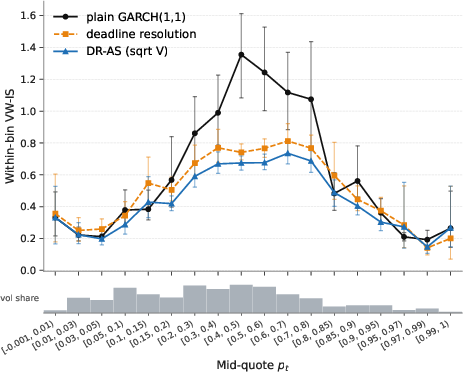
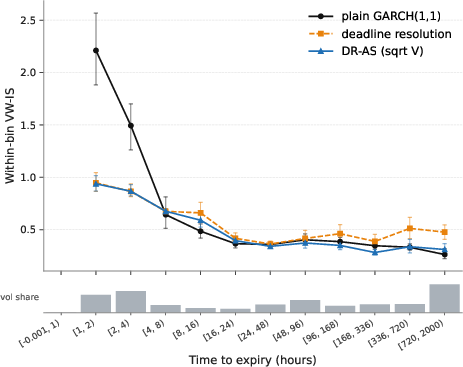
- It’s highest near 50–50 prices and increases as the deadline gets closer. This matches the idea that uncertainty must resolve by the event date.
- Spreads and volume matter together: wide spreads plus high activity signal extra volatility from informed trading.
- The model is interpretable and transfers across topics.
- Economics contracts often follow a smoother “countdown” pattern as the deadline approaches.
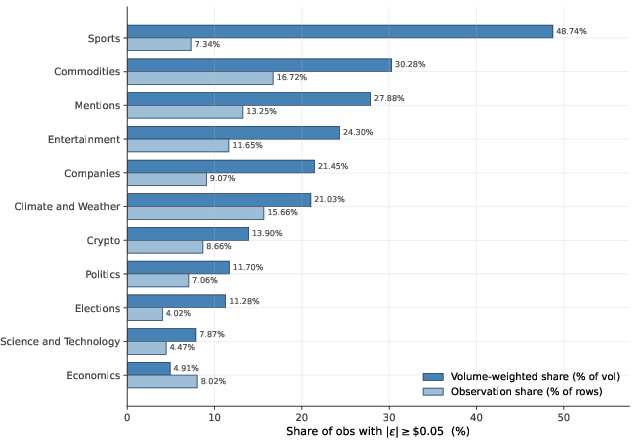
- Sports contracts are more jumpy (big moves around games or announcements).
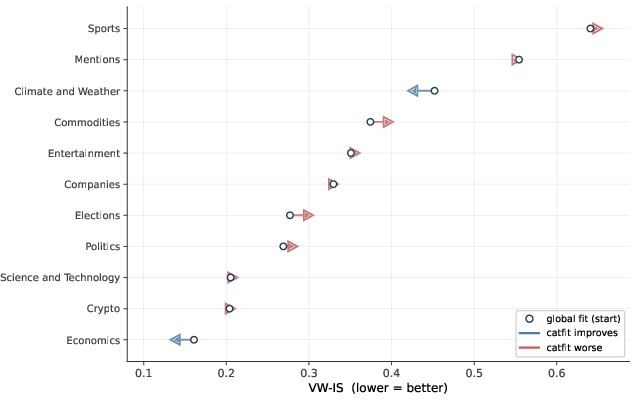
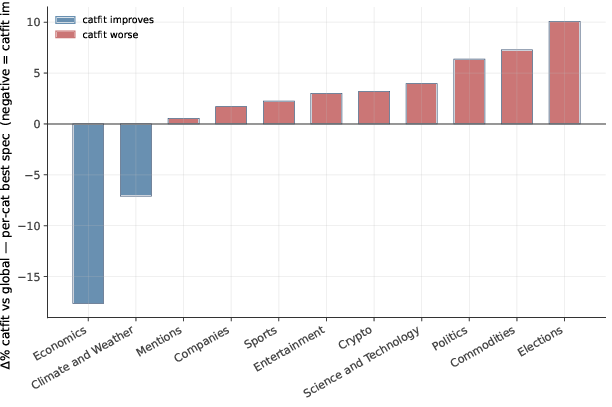
- Fitting separate versions for each category usually doesn’t beat one globally fitted model—so the approach generalizes well.
- Big picture performance
- The one-parameter structural model (closed-form) outperforms a plain GARCH(1,1) by about 34% on their main accuracy score.
- The best hybrid (structural + GARCH) performs best overall.
Why this matters (implications and impact)
- Better risk management and quoting: Market makers can set smarter spreads and inventory limits if they know how much prices are likely to move soon.
- More useful forecasts: Users of prediction-market probabilities (like policymakers, companies, and journalists) can judge whether a current probability is stable or likely to swing soon.
- Pricing new products: A good volatility model helps design and price derivatives on prediction markets (for example, options on probabilities).
- Practical and portable: Because the model uses variables prediction markets already produce (price, time to deadline, spread, volume) and works across categories, it can be widely applied.
- Research bridge: The paper shows that prediction markets are not just like stock markets. Their special features—probability prices, binary outcomes, and known deadlines—need their own models, and those models work better.
In short: If you want to know not just what the market thinks now, but how much that belief might change soon, you need a volatility model built for prediction markets. This paper builds one, shows it’s accurate, explains why it works, and demonstrates that it generalizes across many types of events.
Knowledge Gaps
Knowledge gaps, limitations, and open questions
Below is a single list of concrete gaps and open questions that remain unresolved and could guide future research.
- Cross-channel dependence: The additive variance decomposition assumes conditional orthogonality between the deadline-resolution and order-flow channels. Develop and identify a model that allows Cov(ΔpP, ΔpQ | F_t) ≠ 0, especially around scheduled announcements where public signals and informed trading co-move. Propose instruments or event-time identification to estimate this covariance.
- Structural identification of adverse selection: The DR-AS order-flow term absorbs multiple effects into a single scale K and uses s2/4 as a reduced-form proxy. Identify the informed-trader share α and price-impact separately using trade-level signed order flow, order imbalance, and depth data; test the exact Glosten–Milgrom correction 1 − α2(2p − 1)2 in practice.
- Endogeneity of spreads and volume: Spreads s_t and volume V_t are jointly determined with volatility and anticipated information. Model their joint dynamics (e.g., a system for (h_t2, s_t, V_t)) or use instruments (e.g., fee/tick changes, time-of-day fixed effects, exogenous outages) to isolate causal effects on volatility.
- Activity mapping ν(V): The choice of ν(V) is ad hoc (constant, log, sqrt, linear). Learn ν(·) nonparametrically or from microfoundations (e.g., linking trade size, duration between trades, and order-book depth to the arrival intensity of information-sensitive orders). Compare against Hawkes-based intensity models.
- Microstructure richness beyond spread and volume: Incorporate additional order-book features—depth at multiple levels, slope, imbalance, cancellations, queue position dynamics, and realized price impact—to refine the order-flow variance channel.
- Scheduled-event hazard modeling: Integrate known event calendars (economic releases, game starts, debates, earnings) via a time-varying information clock or hazard that spikes at scheduled announcements. Test whether a piecewise or stochastic information clock outperforms the deterministic 1/(T − t) design.
- Jump components: The DR channel is a continuous diffusion; sports and other categories exhibit jump-like moves. Add a jump-diffusion or marked point process component to capture event-driven discontinuities and assess improvements over the additive DR-AS diffusion.
- Random or early resolution times: The model assumes a known deterministic deadline T and spends the entire variance budget by T. Many contracts resolve early (clinching) or face uncertain/extended deadlines. Generalize to stochastic stopping times and test the implied variance budget when resolution occurs at τ < T.
- Zero-update probability: The headline target conditions on active updates. Build a two-part model that jointly predicts the probability of a zero move and, conditional on movement, the move size; quantify the incremental gains vs. current robustness checks.
- Distributional shape and interval construction: Forecasts are mapped to symmetric 95% intervals via a normal reference, despite bounded prices and asymmetric risk near 0/1. Estimate full predictive distributions (e.g., via transformed-space models, beta or truncated-normal families, or quantile regressions) and evaluate with CRPS and multi-quantile calibration, not just Winkler intervals.
- Multi-horizon forecasting: The paper targets 1-hour horizons. Evaluate and model volatility across multiple horizons (intra-minute to multi-day) and study how structural vs. residual dynamics scale with horizon.
- Time-of-day and diurnal patterns: Spreads, volume, and information flow exhibit strong intraday cycles. Add time-of-day and weekday effects (and platform-specific trading windows) to the variance and arrival-intensity components.
- Price grid and tick-size effects: Kalshi’s discrete tick and minimum spread floors can induce zero moves and mechanically widen spreads. Model the impact of tick granularity on both DR and AS channels and correct for the discrete grid in estimation.
- Risk premia and non-neutral pricing: Prices are treated as risk-neutral posteriors. Test for and, if present, model risk premia, budget constraints, fees, and inventory costs that may bias p_t away from E[Θ | F_t] and confound volatility inference.
- Residual clustering interpretation: Adding ARCH/GARCH to DR-AS improves forecasts, but the source of residual clustering is unclear. Diagnose whether it reflects omitted microstructure variables, jump clustering, or misspecified information clocks; test alternative error dynamics (e.g., stochastic volatility, FIGARCH).
- Category heterogeneity and portability: While pooled GARCH+DR-AS performs well across categories, category-specific mechanisms (e.g., tightly scheduled sports vs. diffuse macro) may call for distinct clocks and jump structures. Systematically test category- or contract-type–specific parameters and structures, including duration normalization.
- Cross-contract linkages: Many events have mutually exclusive claims or logically related markets. Build multivariate volatility models that respect no-arbitrage constraints (e.g., sum-to-one across outcomes) and exploit cross-claim information to refine per-claim volatility forecasts.
- External validity across platforms and mechanisms: Validate the model on other venues (e.g., Polymarket’s AMM-based markets) to test robustness to different microstructure rules, fee schedules, and user bases.
- Early-warning/event-study diagnostics: Use high-frequency event studies around known announcements to separately measure DR vs. AS contributions, cross-channel covariance, and jump intensity, and to stress-test the model under extreme information flows.
- Parameter stability and structural breaks: Examine temporal stability of K and other parameters, especially around platform policy changes, fee/tick adjustments, liquidity provision programs, and major macro cycles.
- Alternative transforms and belief diffusions: Compare Wright–Fisher vs. other belief-martingale specifications (e.g., logistic, probit, arcsine transforms) in pooled and category-specific fits; test implied boundary behavior and variance shapes directly.
- Robust evaluation suite: Complement VW-IS with non–volume-weighted scores, tail-coverage diagnostics (e.g., 99% intervals), conditional coverage by p, τ, s, and V bins, and decision-relevant utility metrics for market makers and hedgers.
- Joint modeling of price and spread dynamics: Rather than using s_t as an exogenous predictor, specify and estimate a joint system for (p_t, s_t, V_t) where spreads respond to anticipated adverse selection, inventory, and volatility; test dynamic Glosten–Milgrom variants with inventory costs.
- Option/derivative pricing implications: Translate the volatility forecasts into prices for prediction-market options or structured products; back-test against observed derivatives (where available) or synthetic payoffs to assess economic value.
- Data access and granularity: The study uses hourly aggregates and closing quotes. Assess gains from full message-level data (order submissions, cancellations, trades) and mid-interval snapshots to better align modeled events with realized microstructure.
- Handling early clinching and path dependence: Model the pathwise dynamics when outcomes effectively clinch before formal resolution (e.g., run-rate models in sports, vote-share tallies), and measure how clinching changes the remaining variance vs. the DR budget identity.
- Robustness to active-update weighting: Results are volume-weighted; evaluate sensitivity to alternative weighting schemes (equal weights, open-interest weights) to ensure conclusions are not driven by high-activity episodes alone.
- Practical deployment for quoting: Translate the model into real-time market-making heuristics (e.g., setting spreads as a function of DR-AS forecasts), quantify P&L impacts, and study adverse-selection vs. inventory trade-offs in live settings.
Practical Applications
Immediate Applications
The paper’s structural volatility model (DR-AS) for binary prediction markets—combining a Wright-Fisher deadline-resolution term and a Glosten-Milgrom order-flow term—and the demonstrated gains from adding residual GARCH dynamics enable several deployable use cases across sectors.
Finance and Market Infrastructure
- Market-making and liquidity provision on prediction markets (e.g., Kalshi, Polymarket)
- Use case: Set spreads, sizes, and inventory buffers based on hourly volatility forecasts h derived from DR-AS or GARCH+DR-AS, reflecting current price p, time-to-resolution τ, spread s, and volume V.
- Tools/workflow: Integrate a DR-AS library into quoting engines; compute h each hour (or more frequently), adjust quoting bands and max order size, and alter fee/edge when h spikes near p≈0.5 or close to the deadline.
- Dependencies/assumptions: Access to reliable order-book data (bid/ask, volume) and resolution times; stationarity of K and ν(V) across venues/categories; conditional orthogonality between channels may be imperfect around major news.
- Trading/risk strategies on prediction markets
- Use case: Volatility-timing and event-risk strategies (e.g., long/short “vol” via straddle-like trades across correlated contracts) exploiting systematic rises in h near p≈0.5 and as τ→0, and cross-category differences (smooth vs jumpy categories).
- Tools/workflow: Signal engine computing h and expected interval widths; position sizing and stop-loss logic that scales with predicted h; backtesting with Winkler interval score-based evaluation.
- Dependencies/assumptions: Sufficient liquidity to express views; ability to borrow/lend inventory or structure delta-neutral combinations; category effects transferring out of sample.
- Exchange risk management and surveillance
- Use case: Hourly VaR and liquidity risk gauges for the contract book; dynamic risk limits that throttle leverage or fee rebates as forecast h increases.
- Tools/workflow: Feed DR-AS/GARCH+DR-AS h into risk dashboards; alerts when VW-Cov deviates from target coverage or when spread/volume-driven AS term spikes without corresponding public info.
- Dependencies/assumptions: Real-time data pipelines; stable calibration; governance for dynamic parameter updates.
- Data products and analytics
- Use case: Sell a “Probability Volatility Feed” with 95% bands and category-level indices; embed interval bands in client dashboards and terminals.
- Tools/workflow: API endpoints providing h, [L,U] intervals, decomposition into DR vs AS components; Grafana/Plotly dashboards; client SDKs.
- Dependencies/assumptions: Commercial rights to redistribute venue data; SLAs for latency/uptime; standardized metadata for τ and contract taxonomy.
Software and Platforms
- UI/UX enhancements for consumer platforms
- Use case: Display 95% prediction intervals around current probability, with “expected movement next hour/day” badges; notify users when volatility spikes before key events.
- Tools/workflow: Frontend widgets fed by an internal DR-AS service; push notifications based on threshold rules on h.
- Dependencies/assumptions: Clear user education to avoid misinterpretation; clipping to [0,1] interval; guardrails against over-alerting.
- Execution and smart-order routing
- Use case: Route orders to times/venues with lower predicted h to reduce slippage for large orders; schedule execution away from pre-announced high-h windows (e.g., debates, data releases).
- Tools/workflow: Incorporate h into routing heuristics and TWAP schedulers; pre-trade impact models using the AS term K·ν(V)·s²/4.
- Dependencies/assumptions: Venue-level transferability of K and ν(·); stable microstructure conditions during execution windows.
Academia and Research
- Teaching and replication in econometrics/market microstructure
- Use case: Course modules and problem sets on bounded-probability volatility, Wright-Fisher processes, and spread/volume-based adverse selection; replication on public Kalshi-like datasets.
- Tools/workflow: Open-source code for DR-AS fitting and interval scoring; datasets with p, τ, s, V by hour.
- Dependencies/assumptions: Availability of suitably granular public data; reproducibility across categories/time.
- Benchmarking for binary-event forecasting research
- Use case: Use DR-AS as a structural baseline to compare new models (e.g., latent state-space, jump-diffusions) via Winkler interval scores and coverage diagnostics.
- Tools/workflow: Standardized evaluation harness with expanding-window backtests and paired bootstrap comparisons.
- Dependencies/assumptions: Comparable sampling frequencies and definitions of “active updates.”
Policy, Government, and Communications
- Risk communication and monitoring
- Use case: Government/NGO dashboards showing both market-implied probabilities and expected near-term volatility for elections, macro releases, or weather-linked events to contextualize uncertainty.
- Tools/workflow: Public dashboards with p and 95% intervals; alerts to communications teams when h indicates high likelihood of sharp moves.
- Dependencies/assumptions: Legal/regulatory acceptance of prediction-market signals; appropriate disclaimers about model assumptions.
- Supervisory analytics for venues
- Use case: Regulators evaluate whether fee structures/spreads reflect adverse-selection risk (AS term); monitor for anomalies where s and V imply high AS variance absent corresponding public drivers.
- Tools/workflow: Supervisory data feeds; variance decomposition reports.
- Dependencies/assumptions: Data-sharing arrangements; clarity on how orthogonality violations affect interpretation.
Daily Life and Commercial Decision-Making
- Journalistic reporting and expert commentary
- Use case: Report “probability ± expected move” to avoid overinterpreting single-point probabilities ahead of scheduled events.
- Tools/workflow: Embeddable widgets and newsroom APIs with h-based bands.
- Dependencies/assumptions: Editorial standards for uncertainty communication.
- Sports and entertainment bettors
- Use case: Adjust stake sizing and timing based on h—avoid placing large bets immediately before high-h windows (games, announcements).
- Tools/workflow: Mobile tools showing expected volatility windows per contract.
- Dependencies/assumptions: Access to timely data; user education on short-horizon risk.
- Corporate planning around event risk
- Use case: Treasury/comms teams plan announcements or hedges around high-volatility windows for economic prints, regulatory decisions, or weather events when relevant PMs exist.
- Tools/workflow: Calendar overlays of predicted h; thresholds for delaying comms or adjusting inventory.
- Dependencies/assumptions: Sufficiently liquid and relevant contracts; internal governance.
Long-Term Applications
These applications require additional research, scaling, new products, or regulatory developments before widespread deployment.
New Financial Products and Markets
- Options and variance products on prediction probabilities
- Concept: List options on PM probabilities and variance futures/swaps priced off DR-AS/GARCH+DR-AS to create a “probability vol” asset class.
- Potential tools/products: Standardized implied-vol surfaces for bounded prices; model-consistent Greeks under absorbing boundaries.
- Dependencies/assumptions: Regulatory approval; sufficient liquidity; robust handling of boundary behavior and jumps near resolution.
- AMM designs with endogenous volatility-aware fees
- Concept: CFMMs that adjust fees as a function of h to mitigate adverse selection and inventory risk.
- Tools/workflow: On-chain or exchange-integrated oracles of h; formal stability proofs under volatility feedback.
- Dependencies/assumptions: Reliable, manipulation-resistant h feeds; community/governance acceptance.
- Cross-exchange vol indices and ETFs
- Concept: Aggregated “Event Volatility Index” across categories (e.g., Macro, Elections, Sports) powering ETPs or indices.
- Tools/workflow: Data aggregation, normalization, category weights, rebalancing rules.
- Dependencies/assumptions: Harmonized data access and methodologies; investor demand; compliance.
Advanced Risk, Compliance, and Surveillance
- Manipulation and anomaly detection
- Concept: Use deviations from the structural relationship (DR vs AS components) to flag potential manipulation or undisclosed information flows.
- Tools/workflow: ML detectors trained on residuals (z_i) and structural-component shifts; escalation pipelines.
- Dependencies/assumptions: Ground truth labels; stable microstructure; false positive management.
- Volatility-based capital/risk regimes for PM venues
- Concept: Regulatory capital, leverage, or margin rules that scale with predicted h.
- Tools/workflow: Standardized risk frameworks; industry benchmarks for acceptable coverage and interval scores.
- Dependencies/assumptions: Policy consensus on PMs; validated models across venues.
Methodological Extensions
- Multi-outcome and combinatorial markets
- Concept: Generalize DR-AS to multinomial outcomes and combinatorial markets with shared constraints; develop variance kernels on the simplex with deadline clocks.
- Tools/workflow: Wright-Fisher generalizations; spread/volume mappings for multi-asset books.
- Dependencies/assumptions: New theoretical work; richer data; estimation stability.
- Jumps and event time modeling
- Concept: Hybrid diffusion–jump models that explicitly capture event-concentrated categories (e.g., sports), integrated with structural channels.
- Tools/workflow: Jump-diffusion estimation; change-point detection; interval-score evaluation adapted to jumps.
- Dependencies/assumptions: High-frequency data; robust identification of public vs private information shocks.
- ML–structural hybrids
- Concept: Feed DR, AS, and τ features into LSTM/Transformer models to capture nonlinearities/clustering while retaining interpretability; output calibrated intervals.
- Tools/workflow: Feature engineering pipelines; conformal prediction for interval calibration.
- Dependencies/assumptions: Sufficient training data per category; overfitting controls; interpretability safeguards.
- Transfer to other bounded-probability domains
- Concept: Apply the structural volatility logic to other probabilities with deadlines or absorbing states (e.g., FDA approvals, credit event probabilities, ad click-through in campaign windows).
- Tools/workflow: Map domain-specific “deadline” and “order-flow” analogs; recalibrate ν(V).
- Dependencies/assumptions: Availability of analogous microstructure/activity metrics; validation against outcomes.
Decision Support and Hedging
- Corporate/event hedging solutions
- Concept: Structured hedges for firms exposed to event probabilities (policy changes, regulatory decisions, weather), priced via DR-AS and managed with residual dynamics.
- Tools/workflow: Advisory platforms; standardized hedging contracts; reporting on expected move windows.
- Dependencies/assumptions: Legal frameworks permitting such hedges; counterparty infrastructure.
- Public planning and resilience
- Concept: Use volatility forecasts to schedule public communications, mobilize resources, or run scenario exercises around high-uncertainty windows for critical events.
- Tools/workflow: Integrated planning dashboards; SOPs keyed to h-thresholds.
- Dependencies/assumptions: Institutional adoption; evidence on decision impact.
Cross-Cutting Assumptions and Dependencies
- Data access and quality: Requires timely, accurate bid/ask, volume, and resolution times; mid-quote availability reduces noise vs last-trade prices.
- Model transferability: Parameters (e.g., K, ν(V)) may be venue- and category-specific; category-specific refits did not consistently add value in the paper but should be validated before new deployments.
- Structural assumptions: Conditional orthogonality between deadline and order-flow channels is simplifying; it can break around major scheduled news or coordinated trading.
- Market heterogeneity: Economics-like contracts exhibit smoother deadline dynamics; sports-like contracts show more jumps; jump-handling extensions may be needed for some categories.
- Evaluation discipline: Use calibrated interval scoring (e.g., Winkler score) and coverage checks; beware of simply widening bands to hit nominal coverage.
- Legal/regulatory environment: Productization (especially derivatives and automated fee changes) may require approvals and clear risk disclosures.
Glossary
- Activity proxy: A function of trading volume used to scale the frequency of information-sensitive events in the order-flow component. "four activity proxies, "
- Adverse selection: The idea that informed traders exploit private information, causing market makers to face losses on average and quote wider spreads. "a Glosten-Milgrom adverse-selection (AS) component"
- Archak--Ipeirotis benchmark: A structural volatility specification for binary prediction markets based on latent belief dynamics and a probit-Brownian shape. "Archak--Ipeirotis benchmark"
- ARCH: Autoregressive Conditional Heteroskedasticity, a time-series model where conditional volatility depends on past squared shocks. "ARCH and GARCH models serving as the canonical workhorses"
- Bid-ask bounce: Short-term oscillation in transaction prices due to trades alternating between bid and ask, rather than fundamental value changes. "bid--ask bounce"
- Bid-ask spread: The difference between the best ask and best bid quotes, reflecting liquidity and adverse selection. "bid-ask spreads ()"
- Brownian motion: A continuous-time stochastic process with independent, normally distributed increments, used to model random fluctuations. "Here, is a Brownian motion."
- Cluster bootstrap: A resampling method that preserves dependence within clusters (e.g., contracts) when estimating uncertainty for comparisons. "contract-cluster bootstrap intervals"
- Conditional orthogonality: An assumption that two sources of innovations (public and order-flow channels) are uncorrelated given the information set. "Conditional orthogonality."
- Counting process: A stochastic process that counts the number of discrete events (e.g., information-sensitive trades) up to time t. "let be the counting process of information-sensitive order-flow events"
- Deadline-resolution channel: A volatility component capturing how remaining binary uncertainty resolves as the known deadline approaches. "Wright-Fisher deadline-resolution channel"
- Diffusion limit: The continuous-time limit of a discrete information or learning process that yields a diffusion (stochastic differential equation) model. "yield the diffusion limit"
- Euler-Maruyama step: A numerical discretization scheme for approximating solutions to stochastic differential equations over small time steps. "an Euler-Maruyama step"
- Expanding-window design: An evaluation procedure where models are re-estimated each period using all prior data, then tested out-of-sample. "a monthly expanding-window design"
- Filtration: A growing sequence of sigma-algebras representing the accumulation of information over time. "with filtration "
- GARCH: Generalized ARCH, extending ARCH to allow conditional variance to depend on both past shocks and past variance. "GARCH(1,1) plain"
- Glosten-Milgrom: A microstructure framework where market makers set prices based on the probability of informed trading inferred from order flow. "Glosten-Milgrom order-flow component"
- Information clock: A time-change that accelerates information arrival as the deadline approaches, ensuring resolution by a fixed time. "the deterministic information clock"
- Likelihood ratio: A measure comparing the probability of observed order flow under different states, used to update beliefs. "The likelihood ratio of a buy order is "
- Market maker: A competitive, risk-neutral liquidity provider who sets bid and ask quotes to break even given the risk of informed trading. "A competitive risk-neutral market maker breaks even"
- Martingale: A stochastic process whose conditional expectation equals its current value, reflecting fair-game properties under the given filtration. "is a bounded -martingale"
- Microstructure variables: Order-book and trading-activity measures (e.g., spreads, volume) that reflect information and liquidity at high frequency. "The microstructure variables are weaker drivers in isolation"
- Mid-quote: The average of the best bid and best ask, often used as a less noisy proxy for the efficient price. "the end-of-hour mid-quote"
- Mixture-of-distributions: A view that volume proxies for information arrival, linking trading activity to return volatility. "the mixture-of-distributions tradition"
- Order book: The set of standing bids and asks; its state variables (e.g., spread) contain information about liquidity and informed trading. "Order-book variables add further information"
- Order flow: The sequence and direction of trades (buys or sells) used to infer private information and drive volatility. "information-sensitive order-flow events"
- Paired bootstrap: A resampling strategy that recomputes scores on the same resampled evaluation units for two models to compare them fairly. "paired bootstrap comparisons"
- Posterior probability: The updated probability of the event given current information, interpreted as the prediction-market price. "the prediction-market price is the posterior probability"
- Prediction interval: A range around the forecast that is expected to contain the next realization with a given probability. "the prediction interval it implies for the next-hour price"
- Price-impact: The expected change in price due to a trade; here scaled by the squared half-spread to capture adverse-selection effects. "adverse-selection price-impact scale"
- Probit-Brownian shape: A volatility shape that models belief dynamics via a probit transform driven by Brownian motion. "probit-Brownian shape "
- Risk-neutral distribution: A probability measure under which asset prices equal discounted expectations of payoffs; here used to interpret prices as probabilities. "Interpreting as the risk-neutral distribution"
- Standardized shock: A unit-variance innovation that scales the price change once conditional volatility has been accounted for. "z_i is a unit-variance standardized shock."
- Variance-budget identity: An expression relating future variance to the integrated instantaneous variance over time under the model. "variance-budget identity"
- Volume-weighted interval score: An evaluation metric that averages interval scores weighted by traded volume to emphasize risk-relevant observations. "volume-weighted interval score"
- Winkler interval score: A proper scoring rule for prediction intervals that penalizes both excessive width and misses. "Winkler interval score"
- Wright-Fisher diffusion: A belief-martingale diffusion on [0,1] with absorbing boundaries at 0 and 1, modeling binary uncertainty dynamics. "the neutral Wright-Fisher diffusion"

