- The paper introduces a functional SPDE model for spot electricity prices, framing observed prices as local averages of a latent process.
- It develops a novel rolling-window estimator that adjusts for mean-reversion and propagation effects, accounting for 40% of weekly variation.
- Empirical results reveal clear diurnal volatility patterns, significant principal components, and limited unconditional leverage effects.
Detailed Analysis of "The fine structure of electricity price volatility" (2605.13320)
Overview and Motivation
This paper presents a comprehensive characterization of electricity price volatility in European spot markets, leveraging high-dimensional panel data from three structurally distinct generation zones: Germany, Norway (NO2), and Spain. The authors reframe electricity price modeling by interpreting the panel of day-ahead prices as local averages of a latent stochastic process, modeled as a solution to a stochastic partial differential equation (SPDE) over the time-of-day continuum. This functional approach captures the diurnal, cyclical, and mean-reverting dynamics that are intrinsic to electricity prices but elusive in standard finite-dimensional time series models.
By integrating advances from infinite-dimensional stochastic calculus, the study supplies novel estimators for weekly integrated variance at the delivery-period level, explicitly handling mean-reversion and semigroup-smoothing artifacts. The methodology is then operationalized to produce empirical volatility decompositions, principal component analyses, and leverage diagnostics across the three regions, generating new insight into the fine structure of spot price volatility and its energy-system drivers.
Let Pt∈Rd denote the day-ahead spot price curve, with each component Pt(i) corresponding to a delivery period (hourly or sub-hourly). The observed Pt(i) is posited as a local average of an unobserved L2(S1)-valued process Xt(⋅)—a mild solution to the SPDE:
dXt=μtdt+AXtdt+σtdWt
where A generates a C0 semigroup, μt is a predictable drift, and σt is the volatility operator controlling the amplitude and structure of the noise term Pt(i)0 (cylindrical Wiener process).
The observed prices are modeled as
Pt(i)1
which leads to a local averaging operator Pt(i)2 mapping Pt(i)3 to Pt(i)4.
The key volatility proxy is a rolling-window realized covariation (RCV) estimator,
Pt(i)5
where Pt(i)6 are increments of the observed local averages, and Pt(i)7 is the window size.
The authors provide a careful decomposition of the conditional expectation of RCV, identifying three bias components not present in classical multivariate volatility estimation:
- Innovation (semigroup-weighted integrated variance of the shocks)
- Propagation (mean-reversion-induced variation)
- Drift (non-stationary predictable effects)
They develop a plug-in estimator that corrects for propagation effects using estimated semigroup matrices, yielding adjusted RCVs that more accurately reflect genuine price innovation volatility.
Empirical Results and Structural Insights
Covariation Matrix Structure and Mean-Reversion
Panel-level RCV and its propagation-adjusted counterpart exhibit substantial structural differences, with mean-reversion (propagation) effects contributing approximately 40% of total observed weekly variation across all zones.
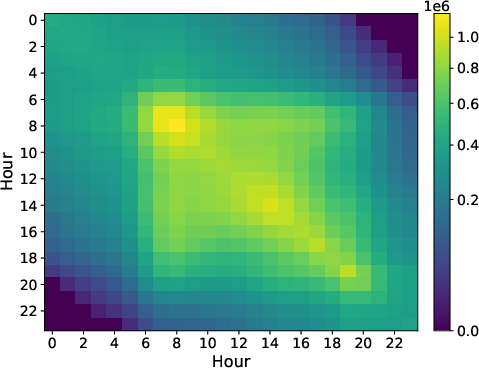
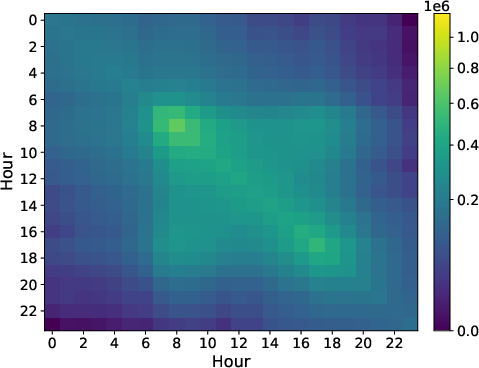
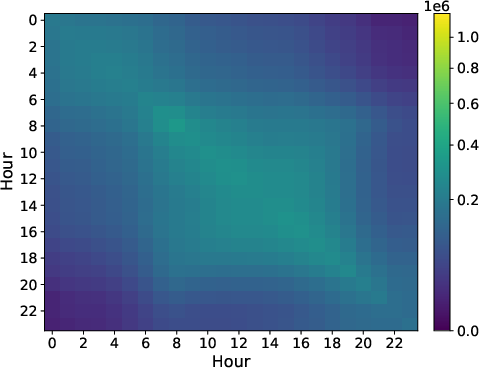
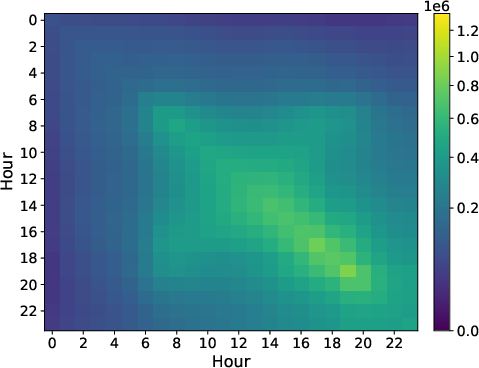
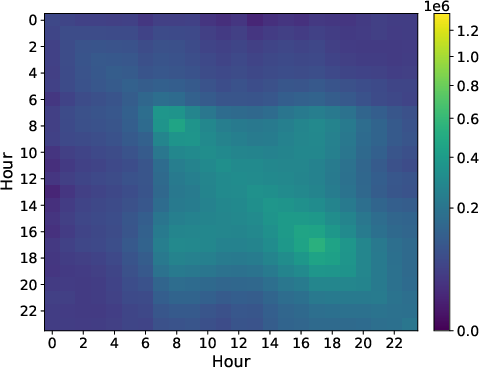
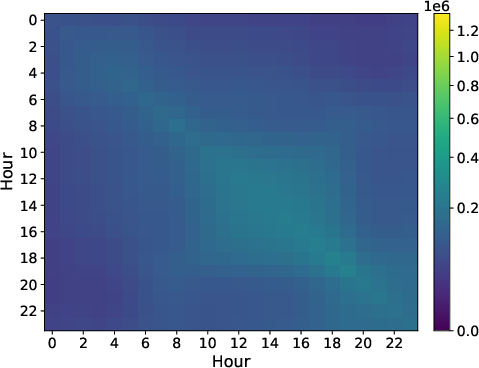
Figure 1: Matrices depicting the average of rolling weekly realized covariation Pt(i)8.
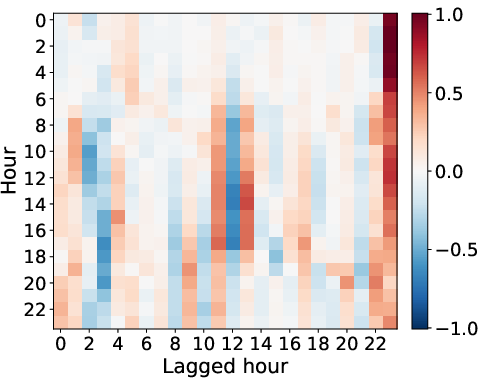
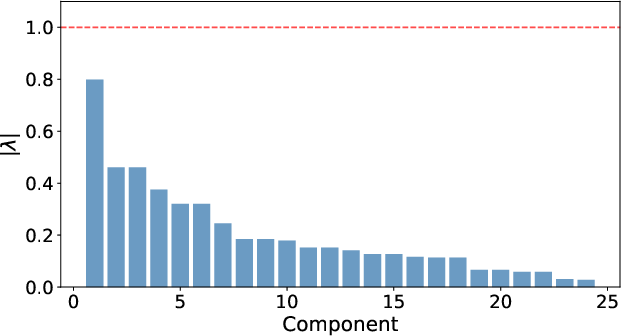
Figure 2: Estimated semigroup matrix Pt(i)9 for the German generation zone—off-diagonal structure reveals cross-hour dependence and slow persistence of common shocks.
German spot price mean-reversion is notably hour-dependent, with early-morning prices inheriting more predictable mean-reversion-driven structure compared to late-day periods, a pattern strongly correlated to time-to-delivery uncertainties.
Conditional Volatility Patterns
The diagonal elements of the propagation-corrected RCV (integrated variance for each delivery period) display pronounced time variation and clustering, co-moving with periods of high spot price levels.
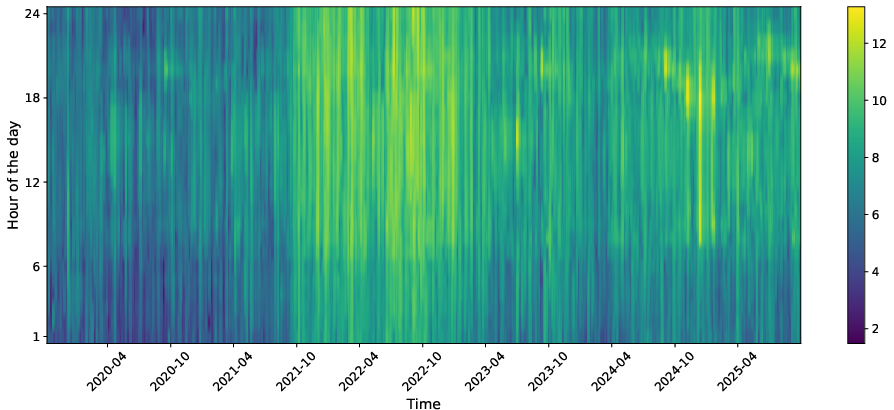
Figure 3: Heatmap of logarithm of estimated weekly RCV, Pt(i)0, for Germany—shows strong volatility clustering and spike periods.
Principal Component Decomposition
Principal component analysis of the adjusted RCV matrices reveals that six to eight factors account for 95% of variance. The first factor captures over 60% and is interpretable as a "level" factor with a pronounced late-day peak, mirroring evening demand and market uncertainty.
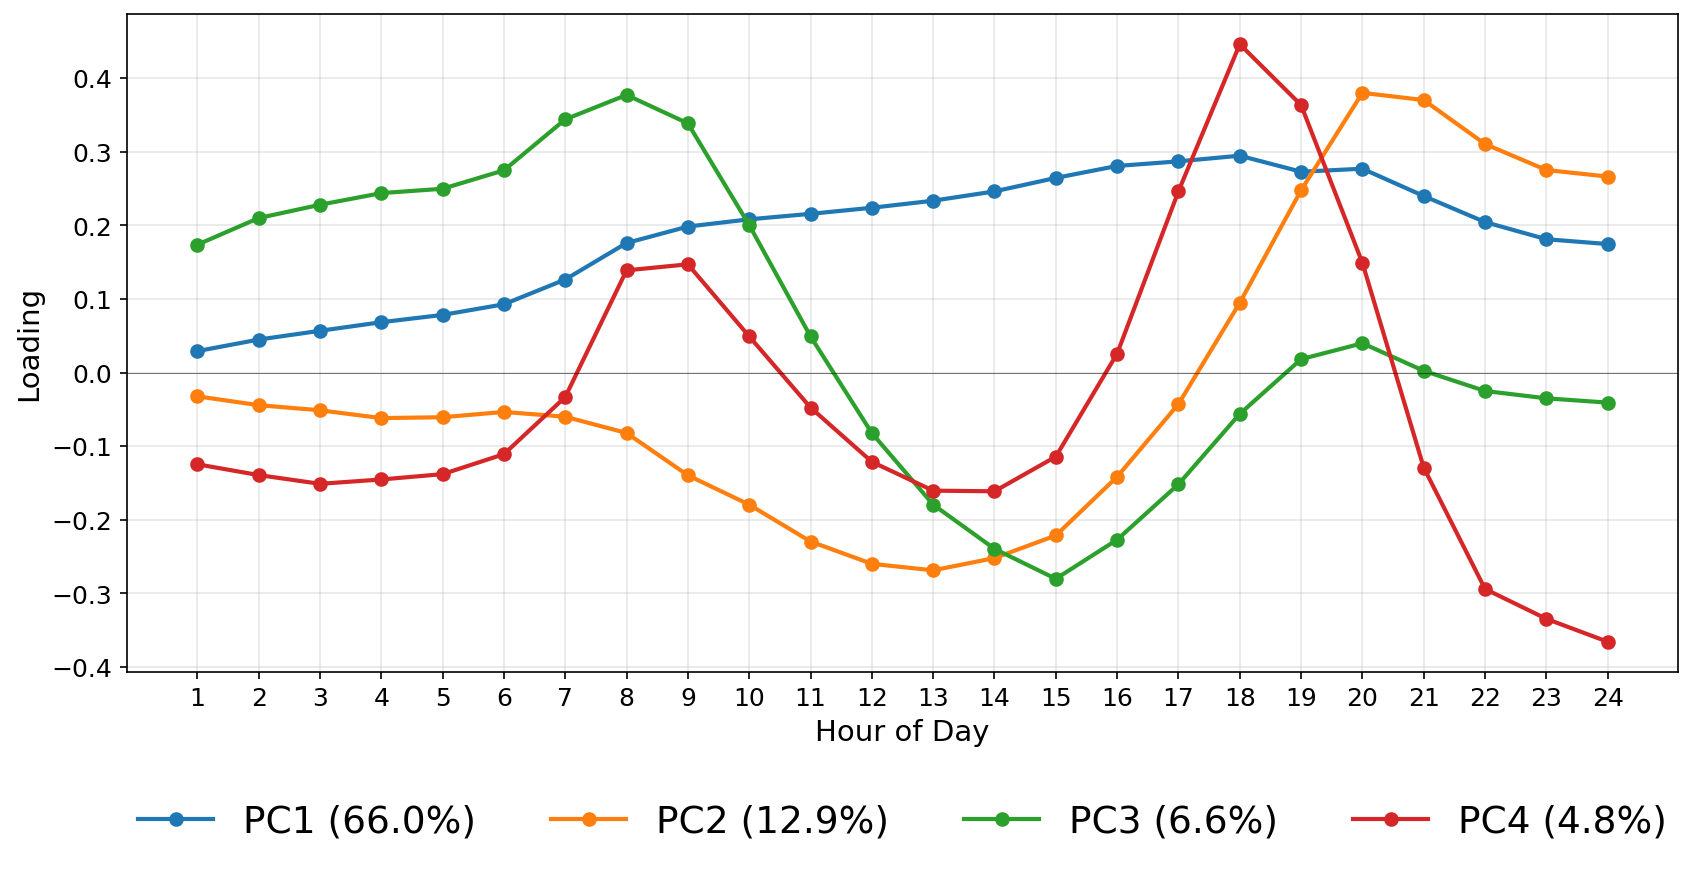
Figure 4: First four factor loadings in the German generation zone. Level factor (PC1) captures diurnal volatility structure; further factors encode inter-period co-movement and specific hour-level effects.
The loadings are highly stable over time, suggesting persistent and interpretable structure to electricity volatility profiles.
Propagation Share and Its Drivers
Propagation share (portion of total volatility attributable to mean-reversion) is maximal for early hours and declines steadily throughout the day, matching increasing time-to-delivery and supply/demand forecasting error.
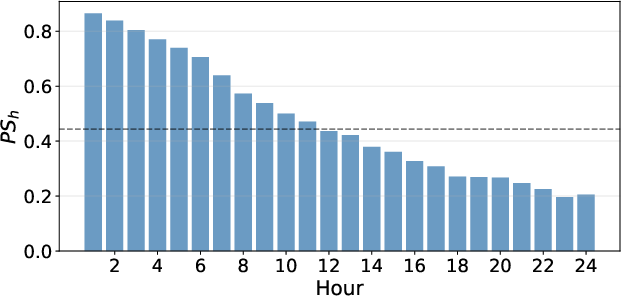
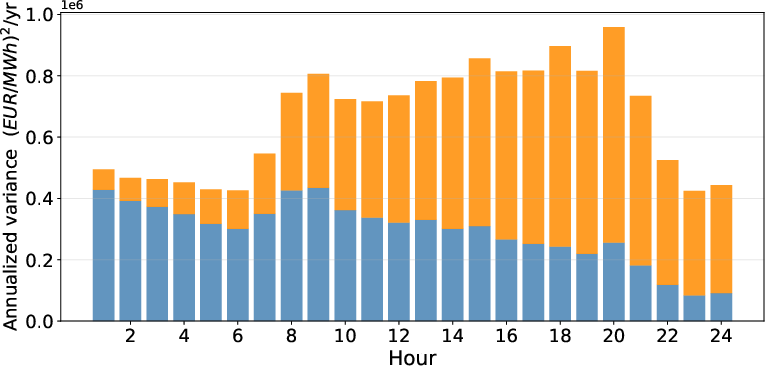
Figure 5: Propagation share per hour (left) and total variance decomposition into propagation (blue) versus innovation (orange) effects (right), for Germany.
Regression analyses implicate forecast error in renewable generation (especially solar) and hour-of-day as key determinants of declining propagation share. This highlights a strong link between operational forecasting uncertainty and spot market unpredictability.
Leverage Effect in Electricity Prices
The so-called inverse leverage effect—i.e., positive correlation between price shocks and volatility—is rigorously tested. The evidence for unconditional inverse leverage is weak; asymmetric volatility responses to positive vs negative price shocks are largely absent or explained by price-level scaling and state dependence.
Strong-form leverage (asymmetry not explained by mean-reversion or price level) is statistically insignificant after correction:
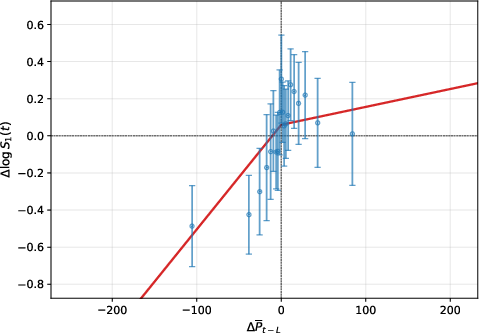
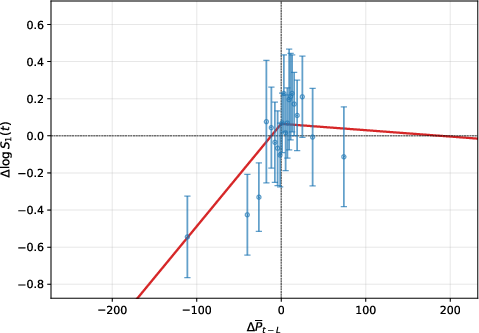
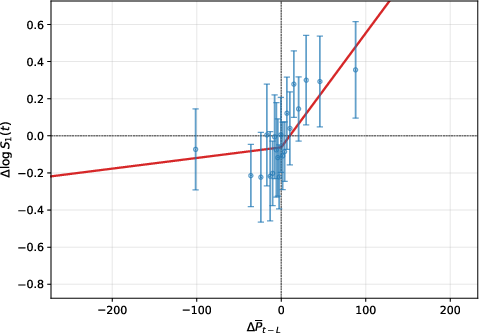
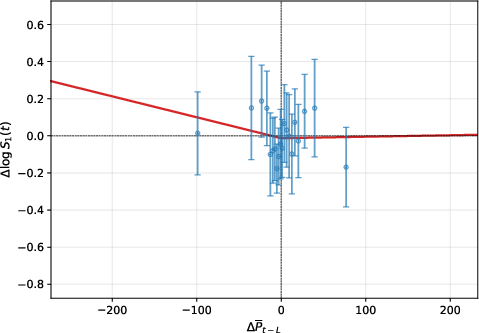
Figure 6: Unconditional regression, Wald test p-value for Pt(i)1 of Pt(i)2—marginal evidence of asymmetry vanishes upon state adjustment.
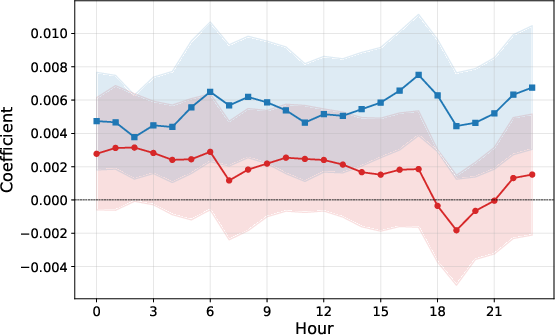
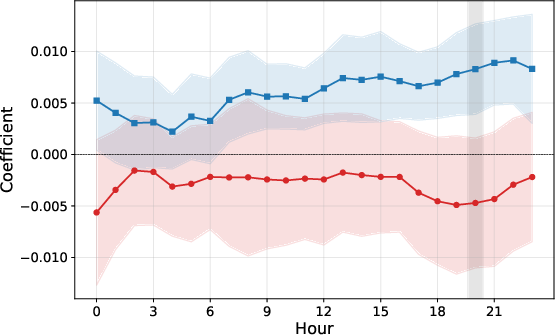
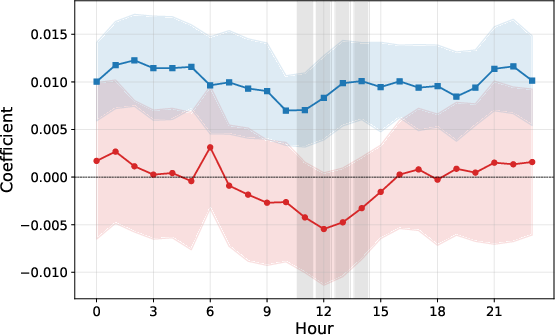
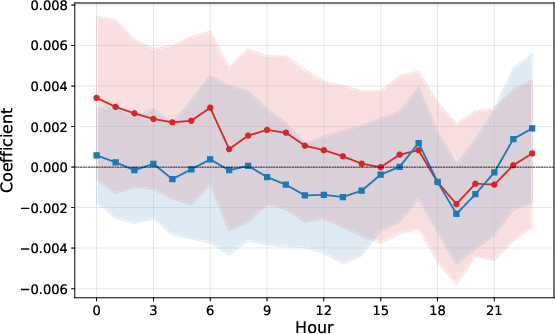
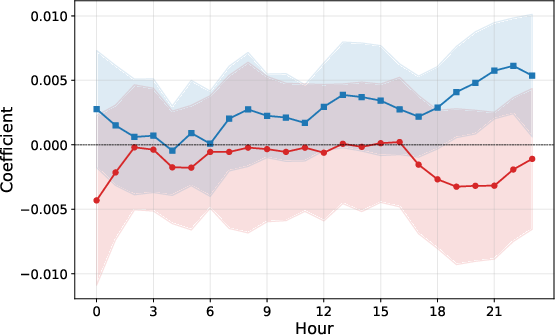
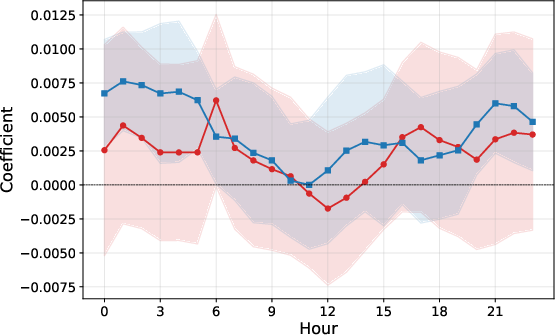
Figure 7: Functional leverage curves for individual hours—very limited evidence of hour-specific leverage once state variables are controlled.
Fuel Mix and Market Specificity
Regression analysis on principal volatility factors and contemporaneous generation data indicates strong zone-specific dependencies. In Germany, high price levels and renewable forecast errors associate tightly with volatility; in Norway, hydro generation's regulatory flexibility dampens volatility; in Spain, solar uncertainty is the main driver.
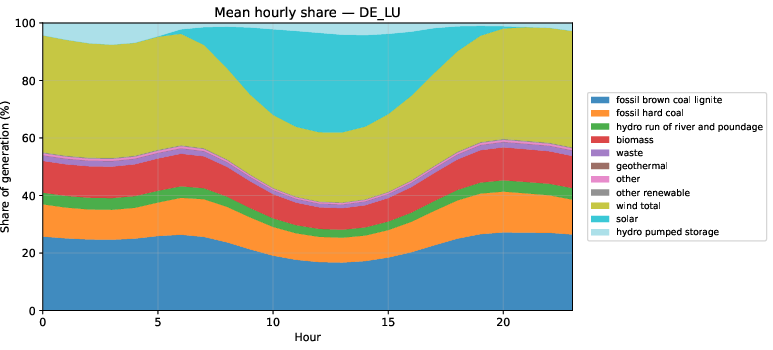
Figure 8: The relative share of various fuel sources in the German generation zone.
Implications, Limitations, and Future Research
Modeling Implications: The work demonstrates that functional-statistical representations informed by physics of market operation are essential for capturing high-resolution electricity volatility structure. Generic finite-dimensional or multivariate approaches understate the roles of mean-reversion, propagation effects, and the market-specific interaction with energy system fundamentals.
Empirical Modeling: Accurate risk estimation for hedging and derivative pricing in electricity markets must accommodate diurnal variance structure, zone-specific generation mixes, and the unique propagation dynamics described. The state-dependent relationship between volatility and price changes undermines structural GARCH-style leverage specifications for these markets.
Theoretical Extensions: The identified semigroup structure calls for further mathematical investigation into the SPDE dynamics underpinning market observables. Uncovering tighter conditions under which the proposed propagation-innovation decomposition is sharp could yield more precise risk metrics.
Forecasting and Market Design: Improved volatility models may inform market design adjustments, especially as renewables increase supply-side uncertainty. The connections found between renewable forecast error and volatility reinforce the value of investment in improved forecasting technology, storage, or market mechanisms to buffer renewables-driven volatility.
Open Directions
- Cross-border coupling: Extension to markets with stronger interzonal coupling.
- Shorter settlement intervals: Adaptation to quarter-hourly or finer-granularity trading.
- Market stress and regime shifts: Robustness during periods of extreme stress or regulatory change.
- Integration with real-time markets: Bridging day-ahead and real-time volatility modeling.
Conclusion
This paper introduces a functional SPDE-based framework for accurately characterizing and decomposing the volatility structure of electricity spot prices. The approach reveals the dominance of propagation (mean-reversion) in total volatility, the strong diurnal and zone-specific patterns in integrated variance, and provides robust evidence against the existence of large, unconditional leverage effects after adjusting for observable market states. The empirical and methodological results suggest that both practical risk management and theoretical modeling in electricity markets require dedicated tools attuned to the unique high-dimensional and state-dependent nature of price dynamics.

