Volatility Forecasting and Return Prediction under Market Regimes: Evidence from High-Frequency Chinese Equity Data
Abstract: This study investigates whether regime-dependent volatility forecasting and machine-learning-based return prediction can be jointly integrated to improve both statistical forecasting performance and economic strategy outcomes in equity markets. Using high-frequency CSI 300 Index data from 2005 to 2023, a sequential twostage framework is developed. In the first stage, realized volatility is modeled using regime-augmented HARQ specifications combined with Markov-switching GJR-GARCH filtering to capture long-memory dynamics, asymmetry, and structural market regimes. In the second stage, volatility forecasts, regime indicators, and return-related predictors are incorporated into an XGBoost return-prediction model estimated through a strictly walk-forward out-of-sample procedure. The empirical results demonstrate that regime-aware volatility forecasting consistently outperforms baseline HARQ models across forecast evaluation metrics and is generally supported by formal forecast comparison tests. In contrast, return predictability remains weak, state-dependent, and concentrated primarily in low-volatility regimes. Although naive predictive trading strategies generally fail after accounting for realistic transaction costs, carefully designed implementations incorporating volatility scaling, low-volatility gating, threshold calibration, and turnover controls can improve defensive economic performance. The findings suggest that the practical value of predictive systems in financial markets may depend less on generating strong unconditional return forecasts and more on transforming weak state-dependent signals into economically robust portfolio allocation rules. Overall, the study contributes by integrating econometric volatility modeling, regime classification, machine-learning return prediction, and implementation realism within a unified framework.
Paper Prompts
Sign up for free to create and run prompts on this paper using GPT-5.
Top Community Prompts
Explain it Like I'm 14
Overview: What this paper is about
This paper tries to answer a big practical question in investing: can we predict how “bumpy” the stock market will be (its volatility), and can we also use that information to predict tomorrow’s returns well enough to build better trading strategies? The authors study this using very detailed data (every 5 minutes) from the CSI 300 Index, a major stock index in China, covering 2005 to 2023.
In short: they build a two-step system. First, they forecast volatility while paying attention to different “market moods” (calm vs. turbulent). Second, they feed those volatility clues into a machine-learning model to predict returns and test trading rules that try to be realistic about costs and risks.
Objectives: The key questions in simple terms
- Can we forecast market volatility more accurately if we recognize that markets switch between different regimes (like calm and stormy periods)?
- If we have better volatility forecasts and know the likely regime, does that help a machine-learning model predict next-day returns?
- Even if return predictions are weak, can careful strategy design (risk controls, fewer trades, only trading in calmer times) turn small signals into safer, more useful investment rules after real costs?
Methods: How they did it (with everyday analogies)
Think of the market like the weather:
- Volatility is how stormy the market is (big ups and downs = stormy; small moves = calm).
- Returns are like tomorrow’s temperature change—harder to predict than whether it will be stormy.
The researchers used a two-stage approach:
Stage 1: Forecast the “storminess” (volatility)
- Data: 5-minute price data for the CSI 300 Index from 2005–2023. They only used active trading hours, skipping overnight gaps and the midday break, so the measurements reflect true trading activity.
- Measuring volatility: They built a daily “realized variance” by summing up squared 5-minute moves. They also used:
- Realized quarticity: a measure of how much volatility itself jumps around (think: forecast uncertainty about the storm’s strength).
- Jump measures: to capture sudden big moves (like surprise gusts of wind).
- HARQ model (simple idea): Predict today’s volatility using a blend of recent volatilities from different horizons—yesterday, last week, and last month—plus quarticity. This is like saying, “weather today depends on weather yesterday, the last week, and the last month.”
- Regimes (market moods): Markets often switch between calm and stormy states. To detect these, they modeled the HARQ leftover errors with a Markov-switching GJR-GARCH:
- Markov-switching: a way to estimate the chance we’re currently in “calm” vs. “stormy” mode, based only on past and current information.
- GJR-GARCH: captures the fact that “bad news” tends to increase volatility more than “good news” of the same size (markets get more nervous on drops than on rises).
- Student-t noise: allows for fat tails (rare but very big moves).
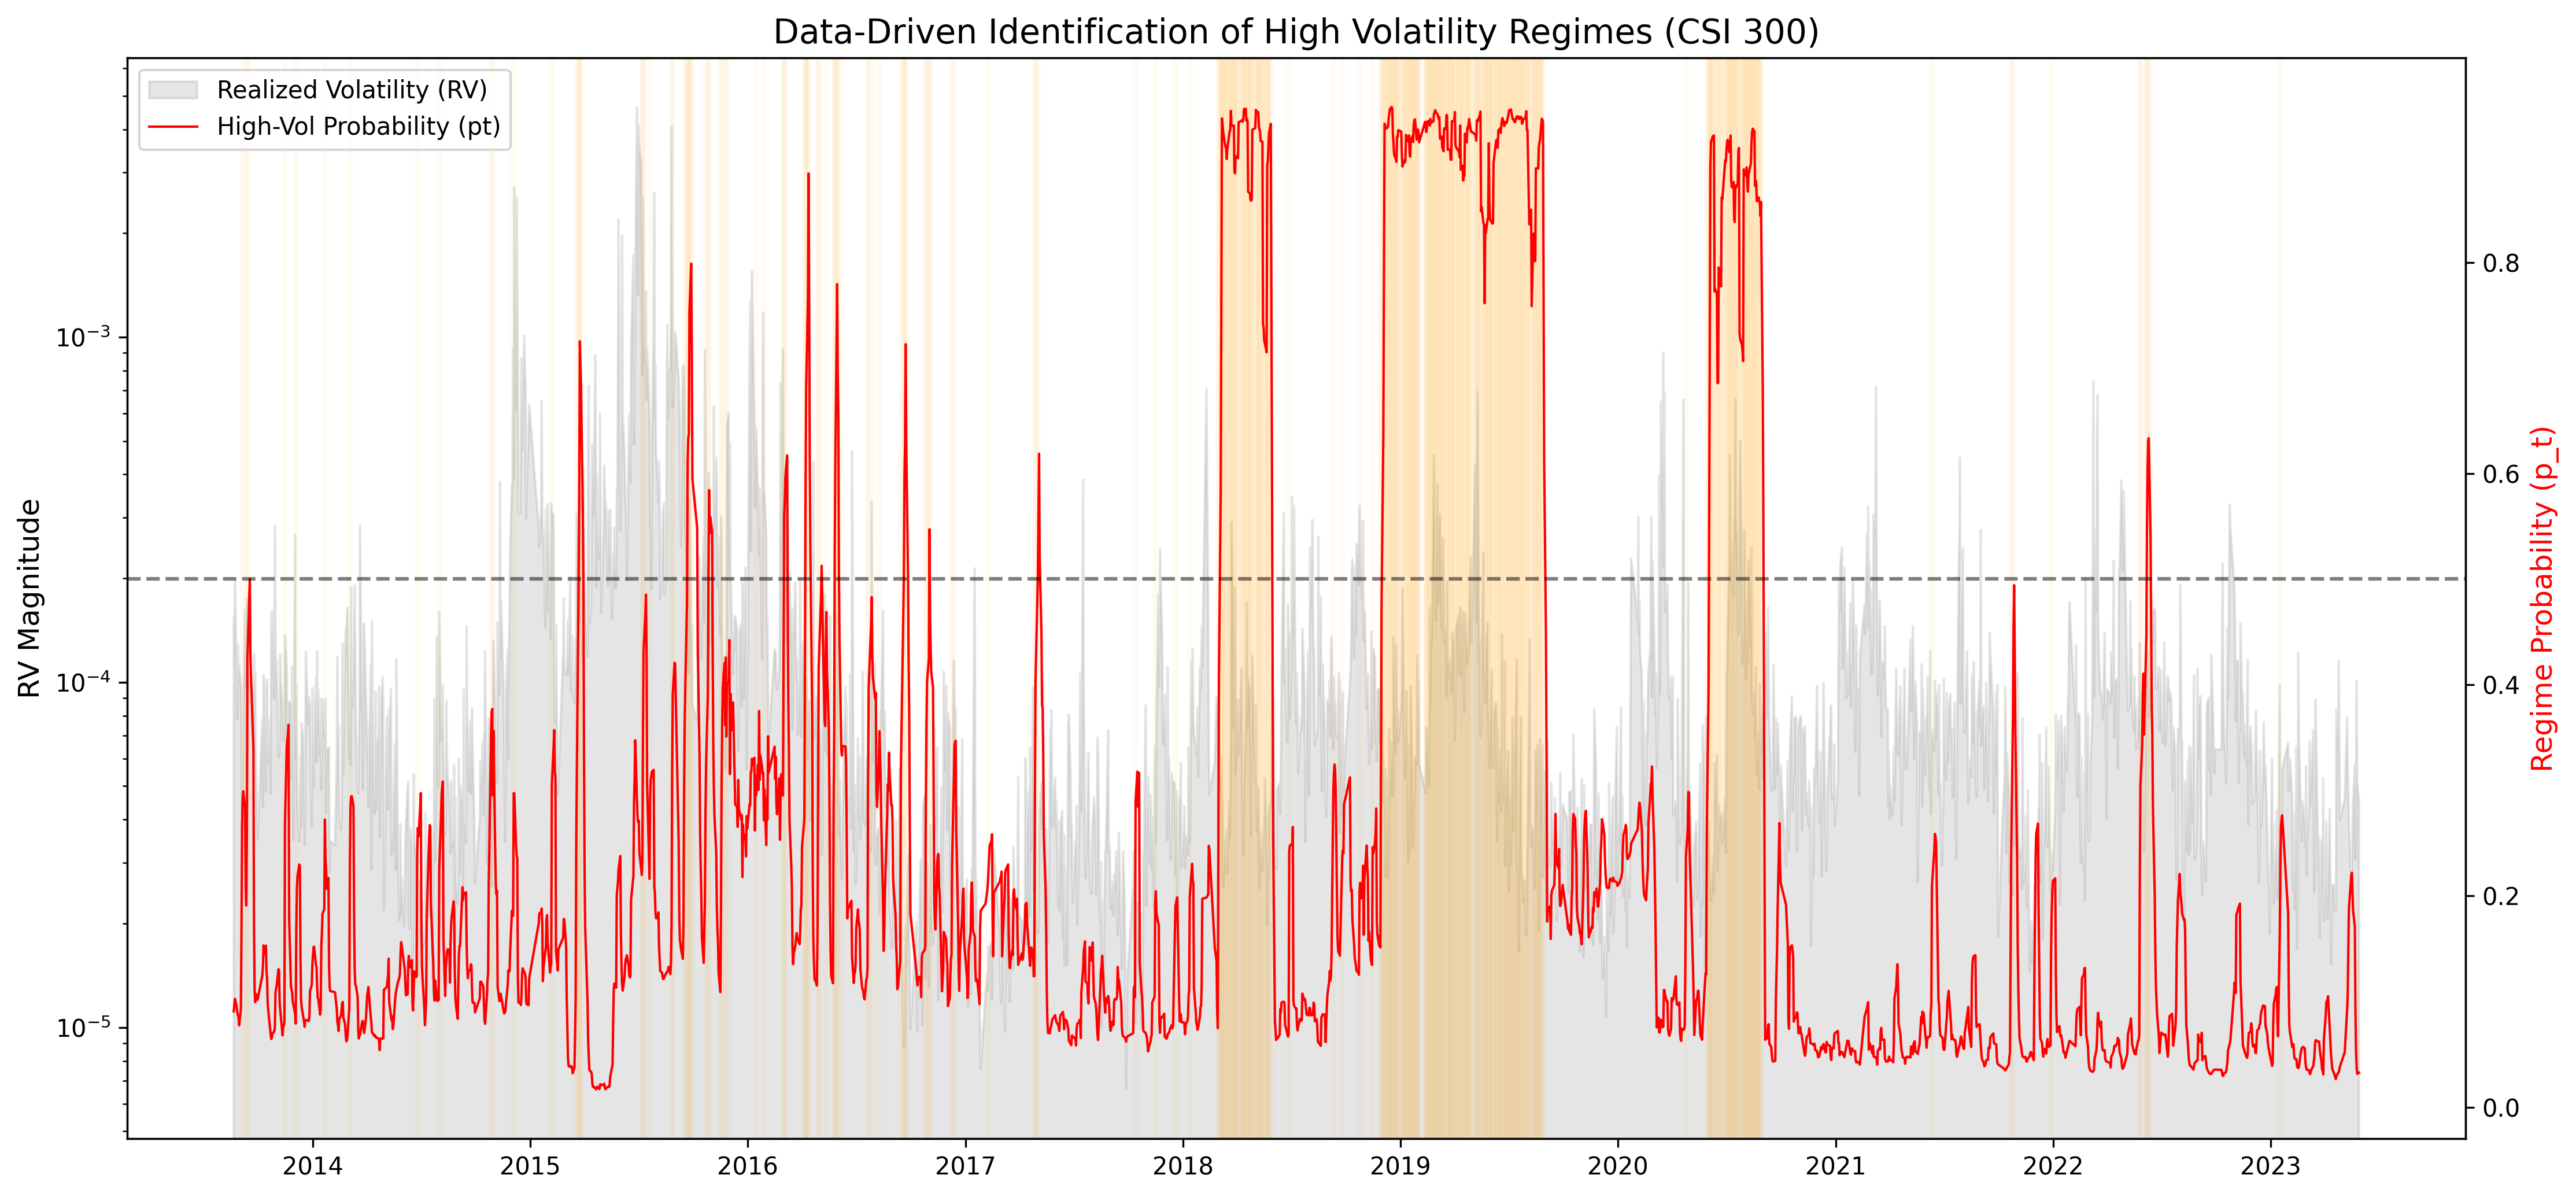
- Then they fed the estimated “probability of being in the high-volatility regime” back into the volatility model. This makes the volatility forecast “regime-aware,” letting it adapt as the market mood changes.
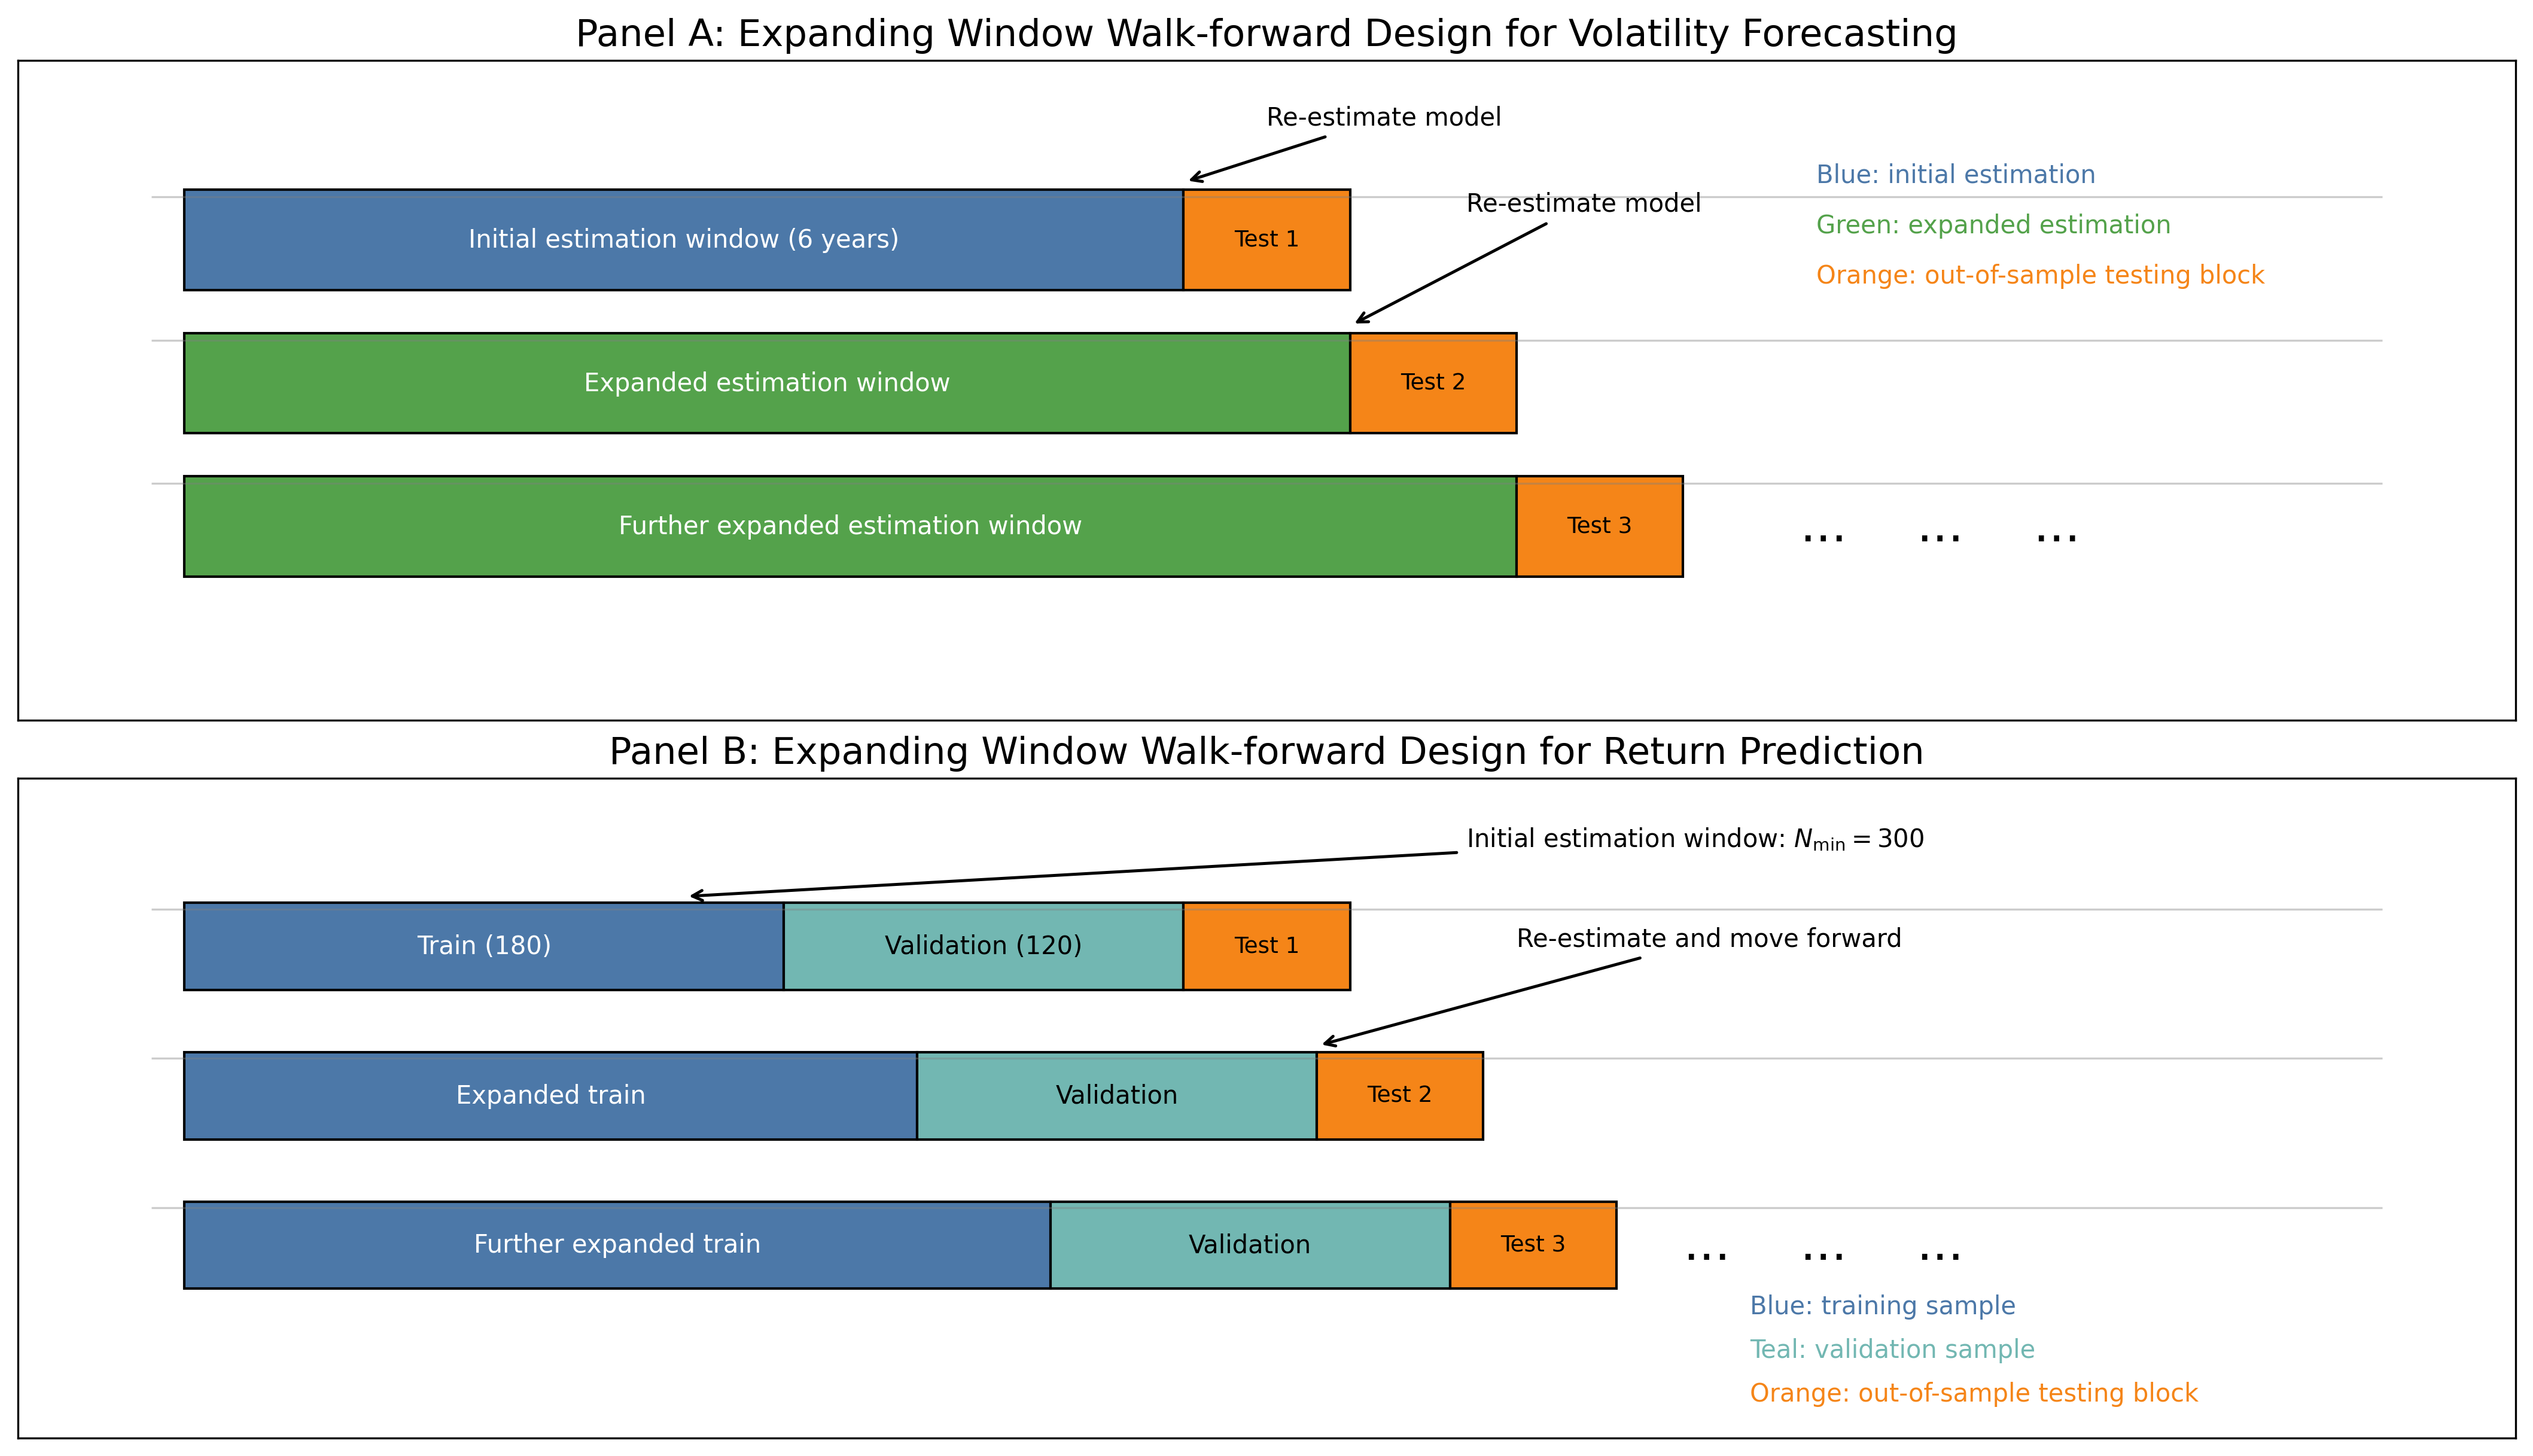
All of this was done in a “walk-forward” way: they always trained with past data and tested on future data, just like real life. No peeking ahead.
Stage 2: Predict next-day returns using machine learning
- Model: XGBoost, a popular tree-based machine-learning method. It’s good at finding patterns that can be nonlinear (not simple straight lines) and can combine many clues.
- Inputs (predictors): a small, carefully chosen set, including:
- The regime-aware volatility forecast,
- The current and recent volatility measures (and quarticity),
- The probability we are in a high-volatility regime (and its recent values),
- Jumps,
- Recent return patterns (like short-term momentum or reversal).
- Training style: Also walk-forward. They split each training period into “train” and “validation” chunks, tuned the model conservatively, and re-trained every quarter. This reduces overfitting (the model memorizing noise) and matches how you’d trade in real time.
Strategy design: Turning forecasts into trades
- They tested simple “trade on the signal” strategies and found these usually don’t survive real-world trading costs.
- They then engineered more careful strategies:
- Volatility scaling: trade smaller when forecasted risk is high.
- Low-volatility gating: only act on signals during calmer regimes (when predictions work a bit better).
- Thresholds: only trade when the signal is strong enough.
- Turnover controls: avoid trading too often to cut costs.
Main findings: What they discovered and why it matters
- Volatility forecasting: The regime-aware approach clearly beat the basic model. In other words, recognizing calm vs. stormy market moods helped predict future volatility more accurately, and standard tests backed this up.
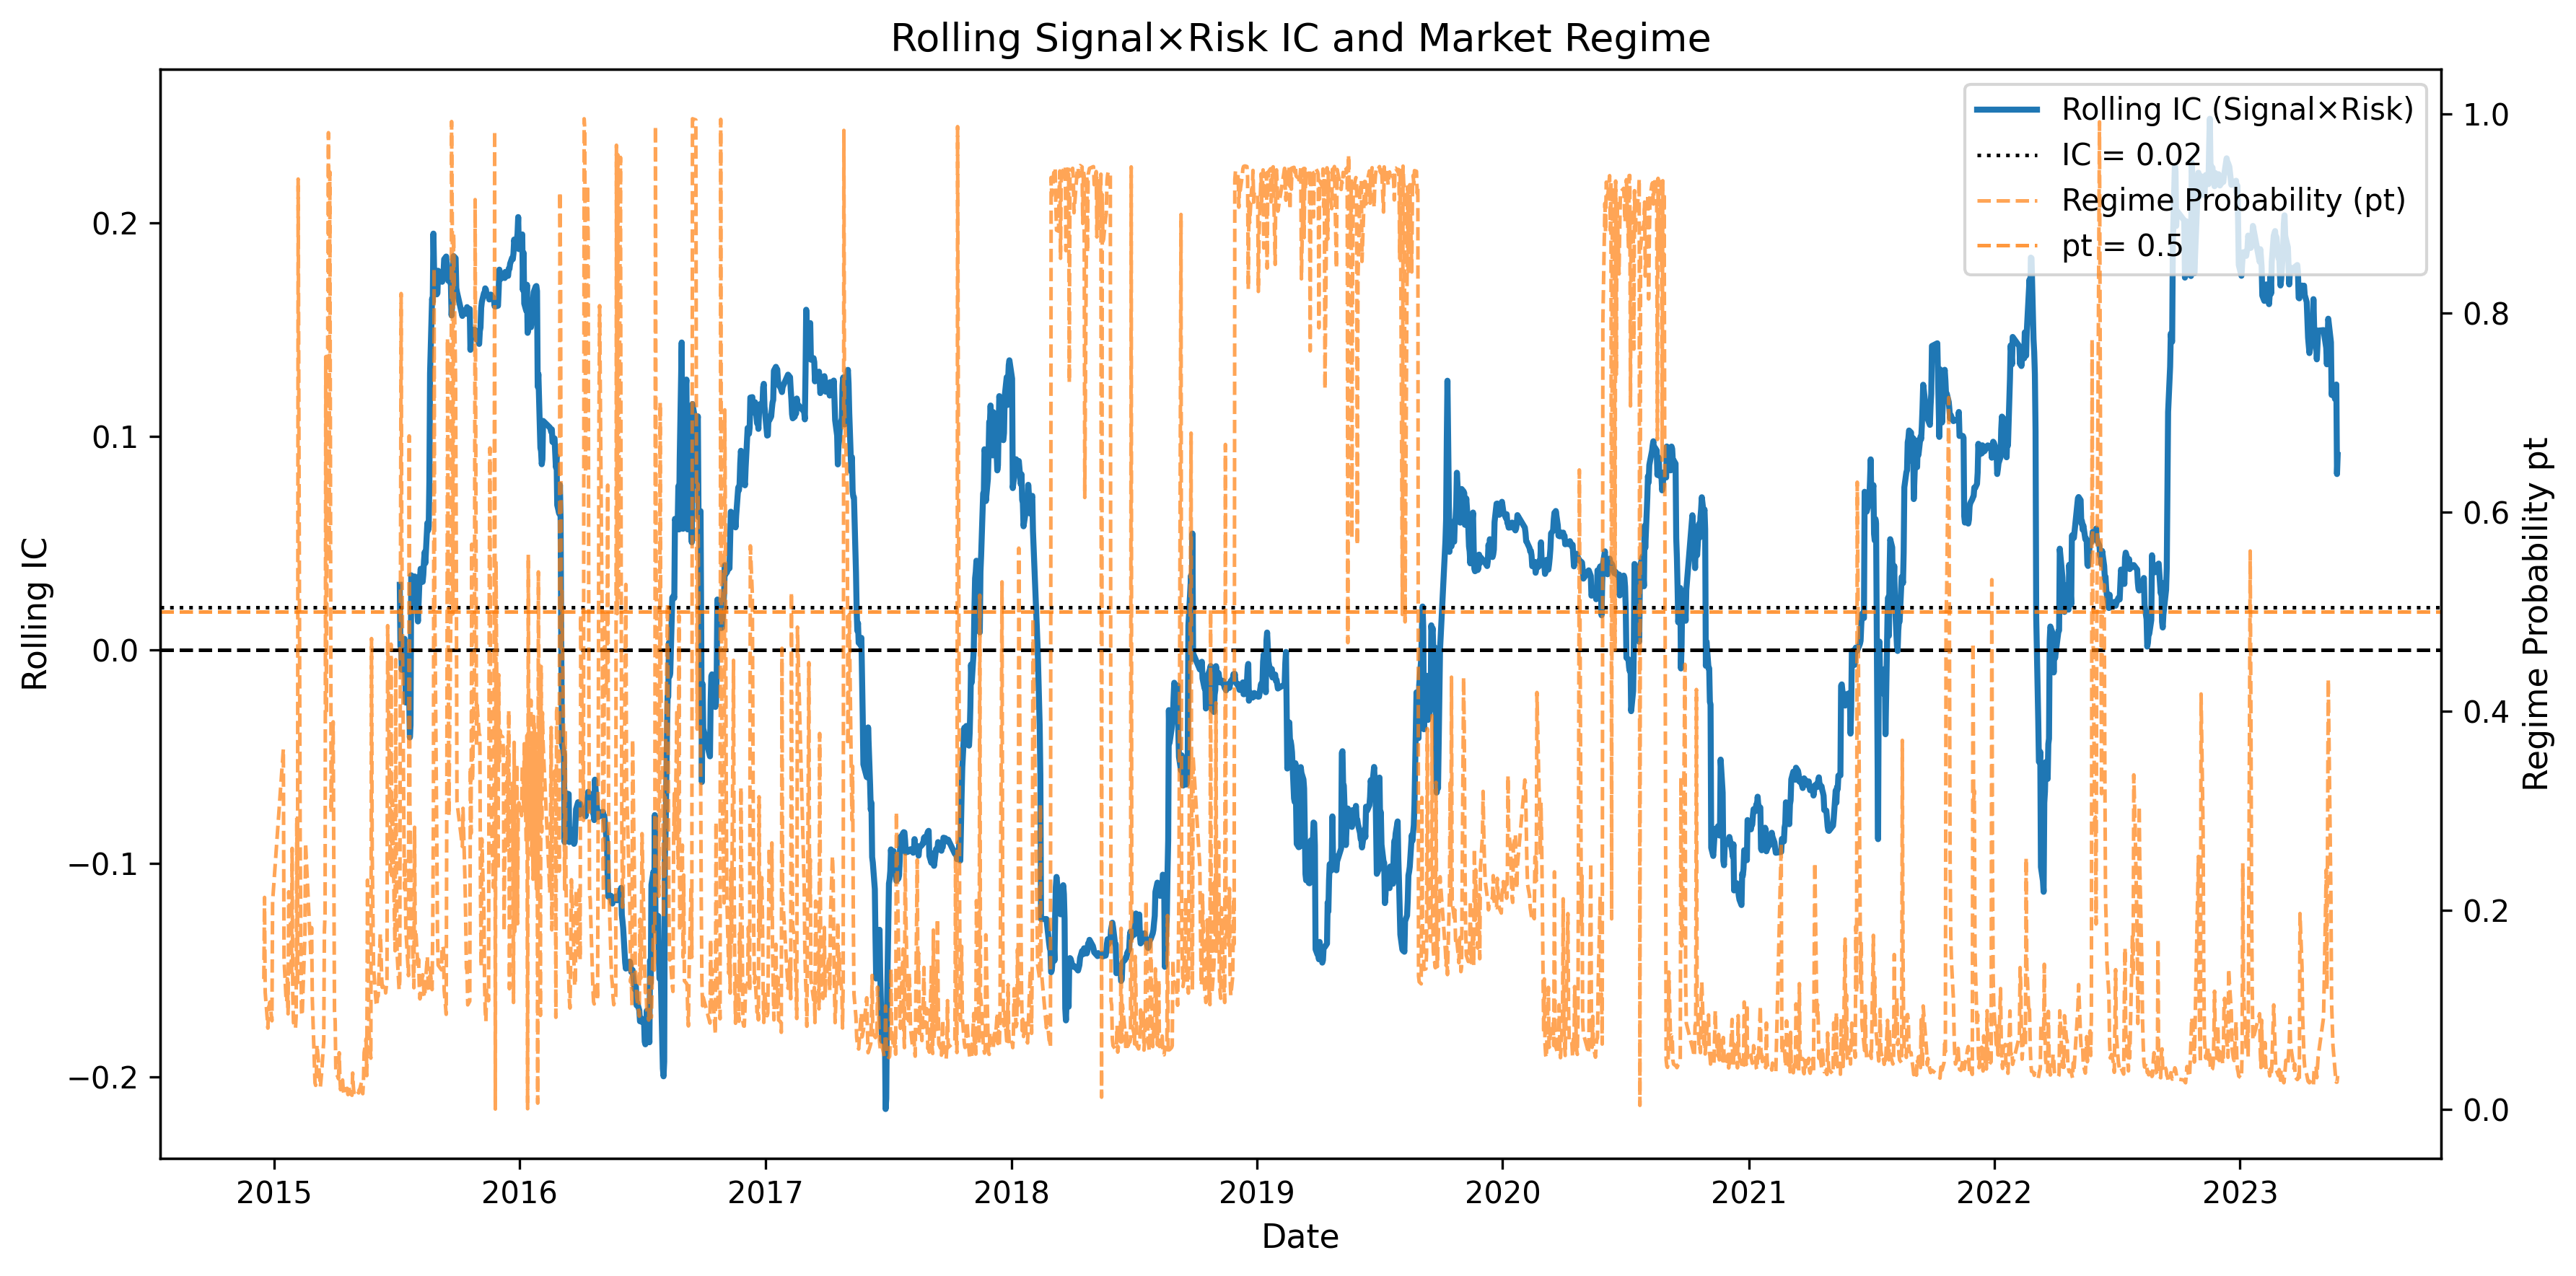
- Return prediction: Signals were weak overall and mostly useful only in low-volatility (calmer) periods. This matches the idea that price moves are noisy and hard to predict.
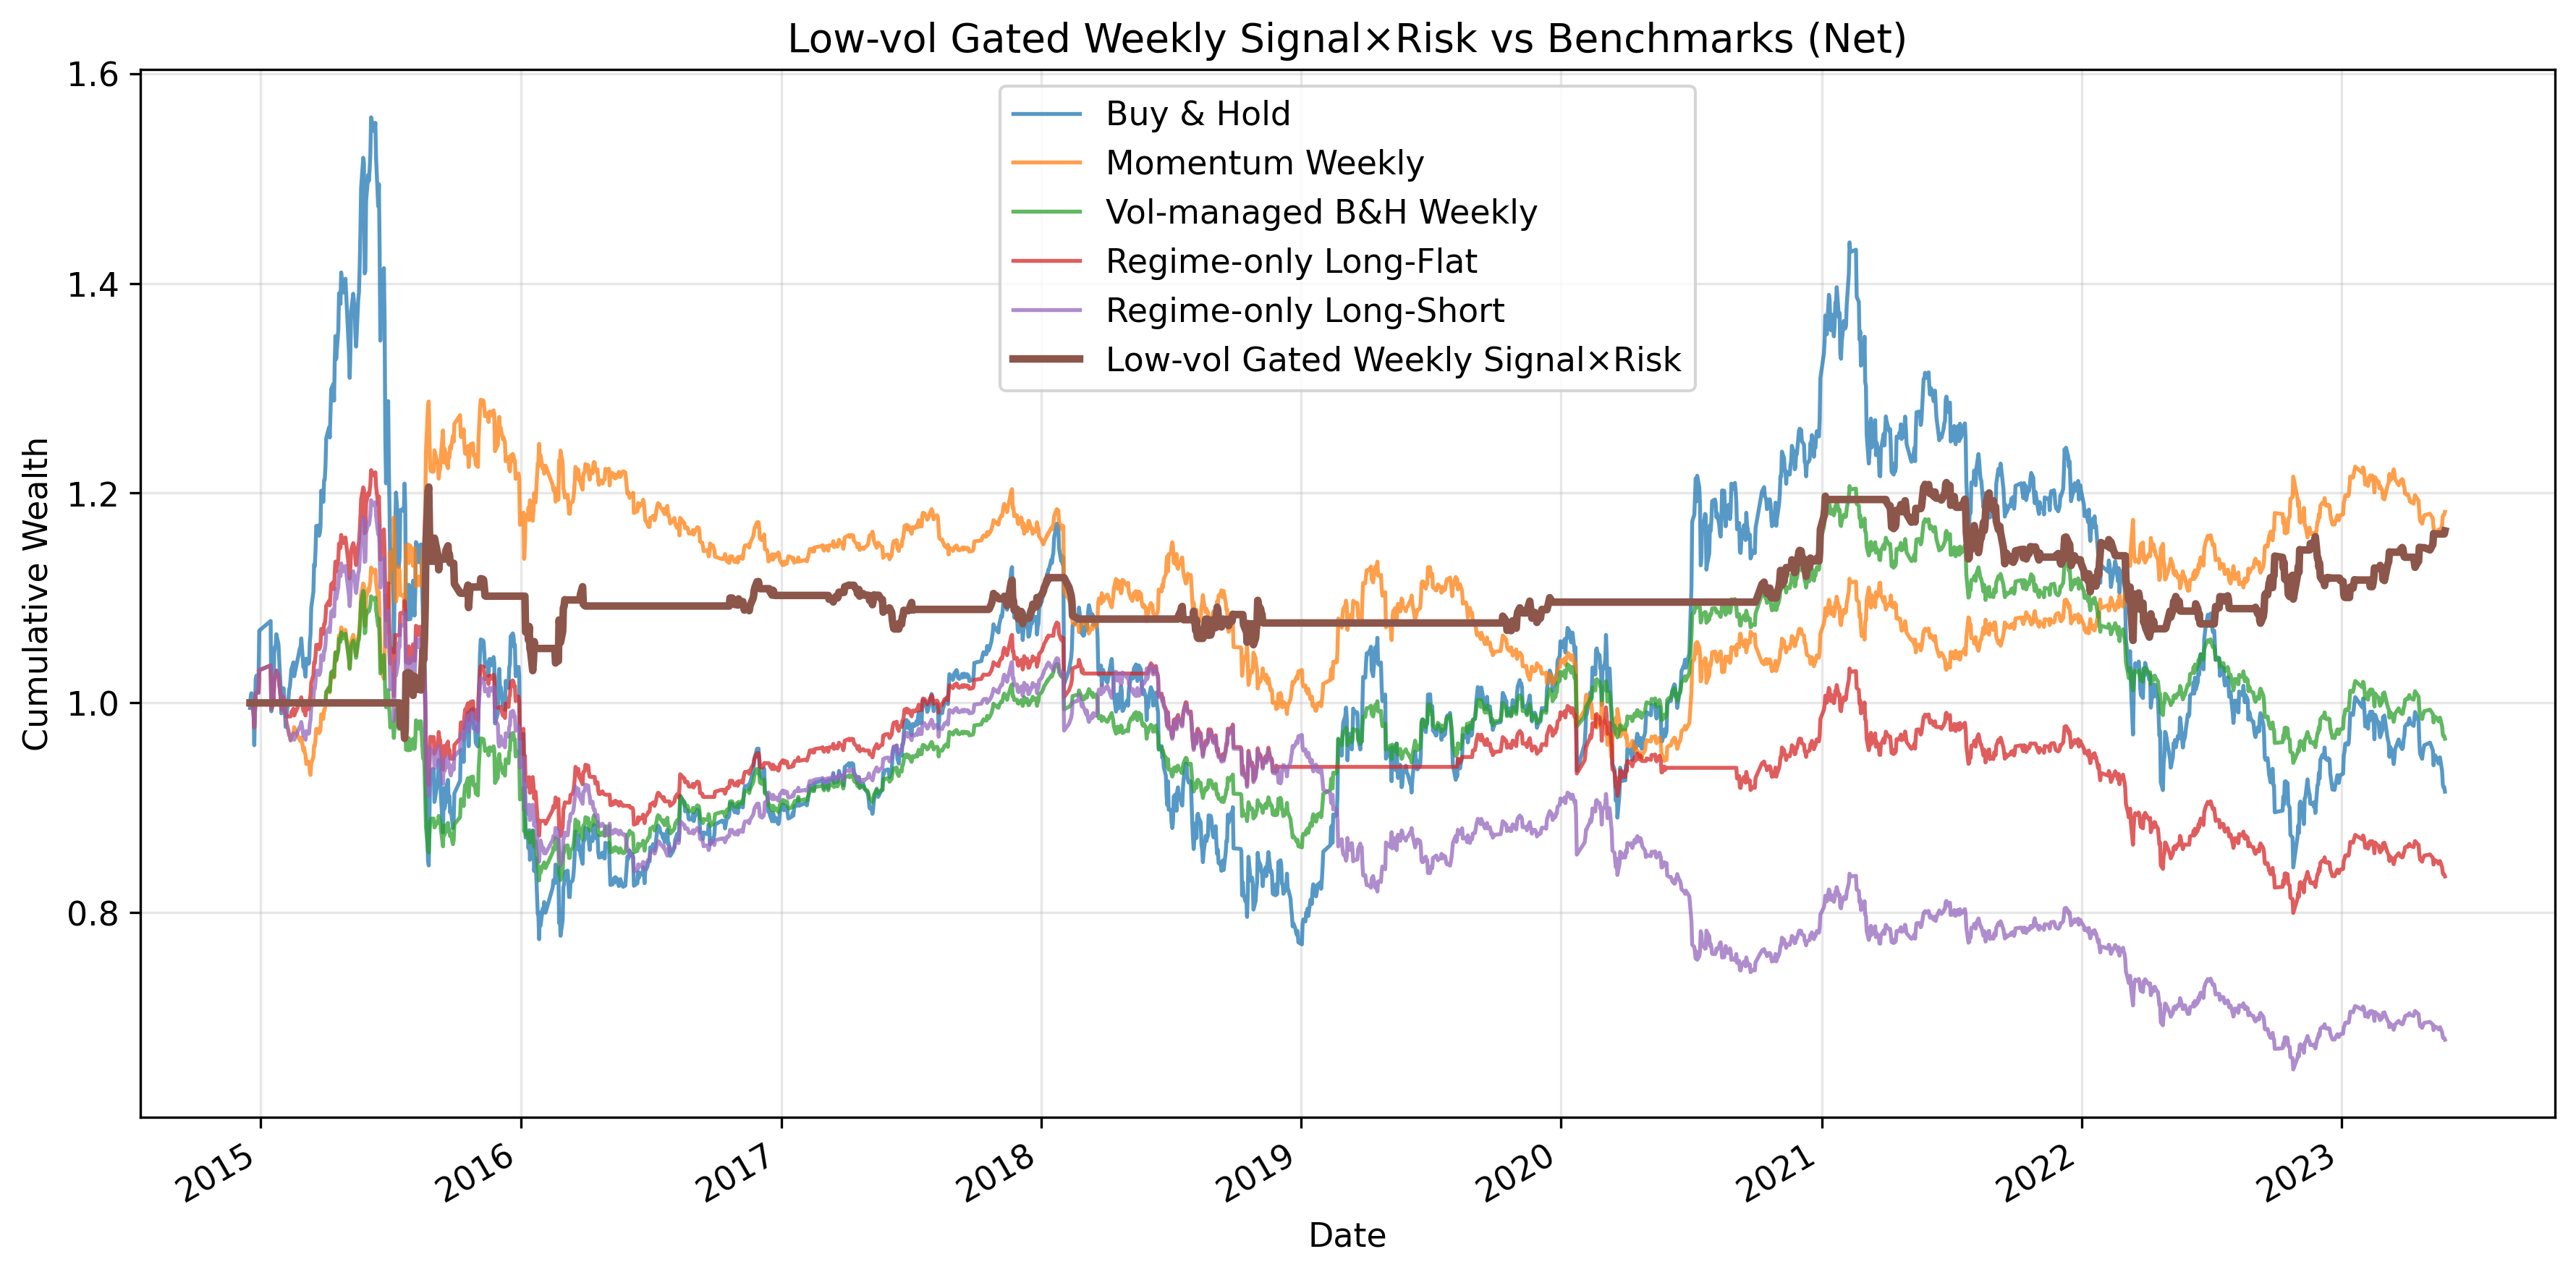
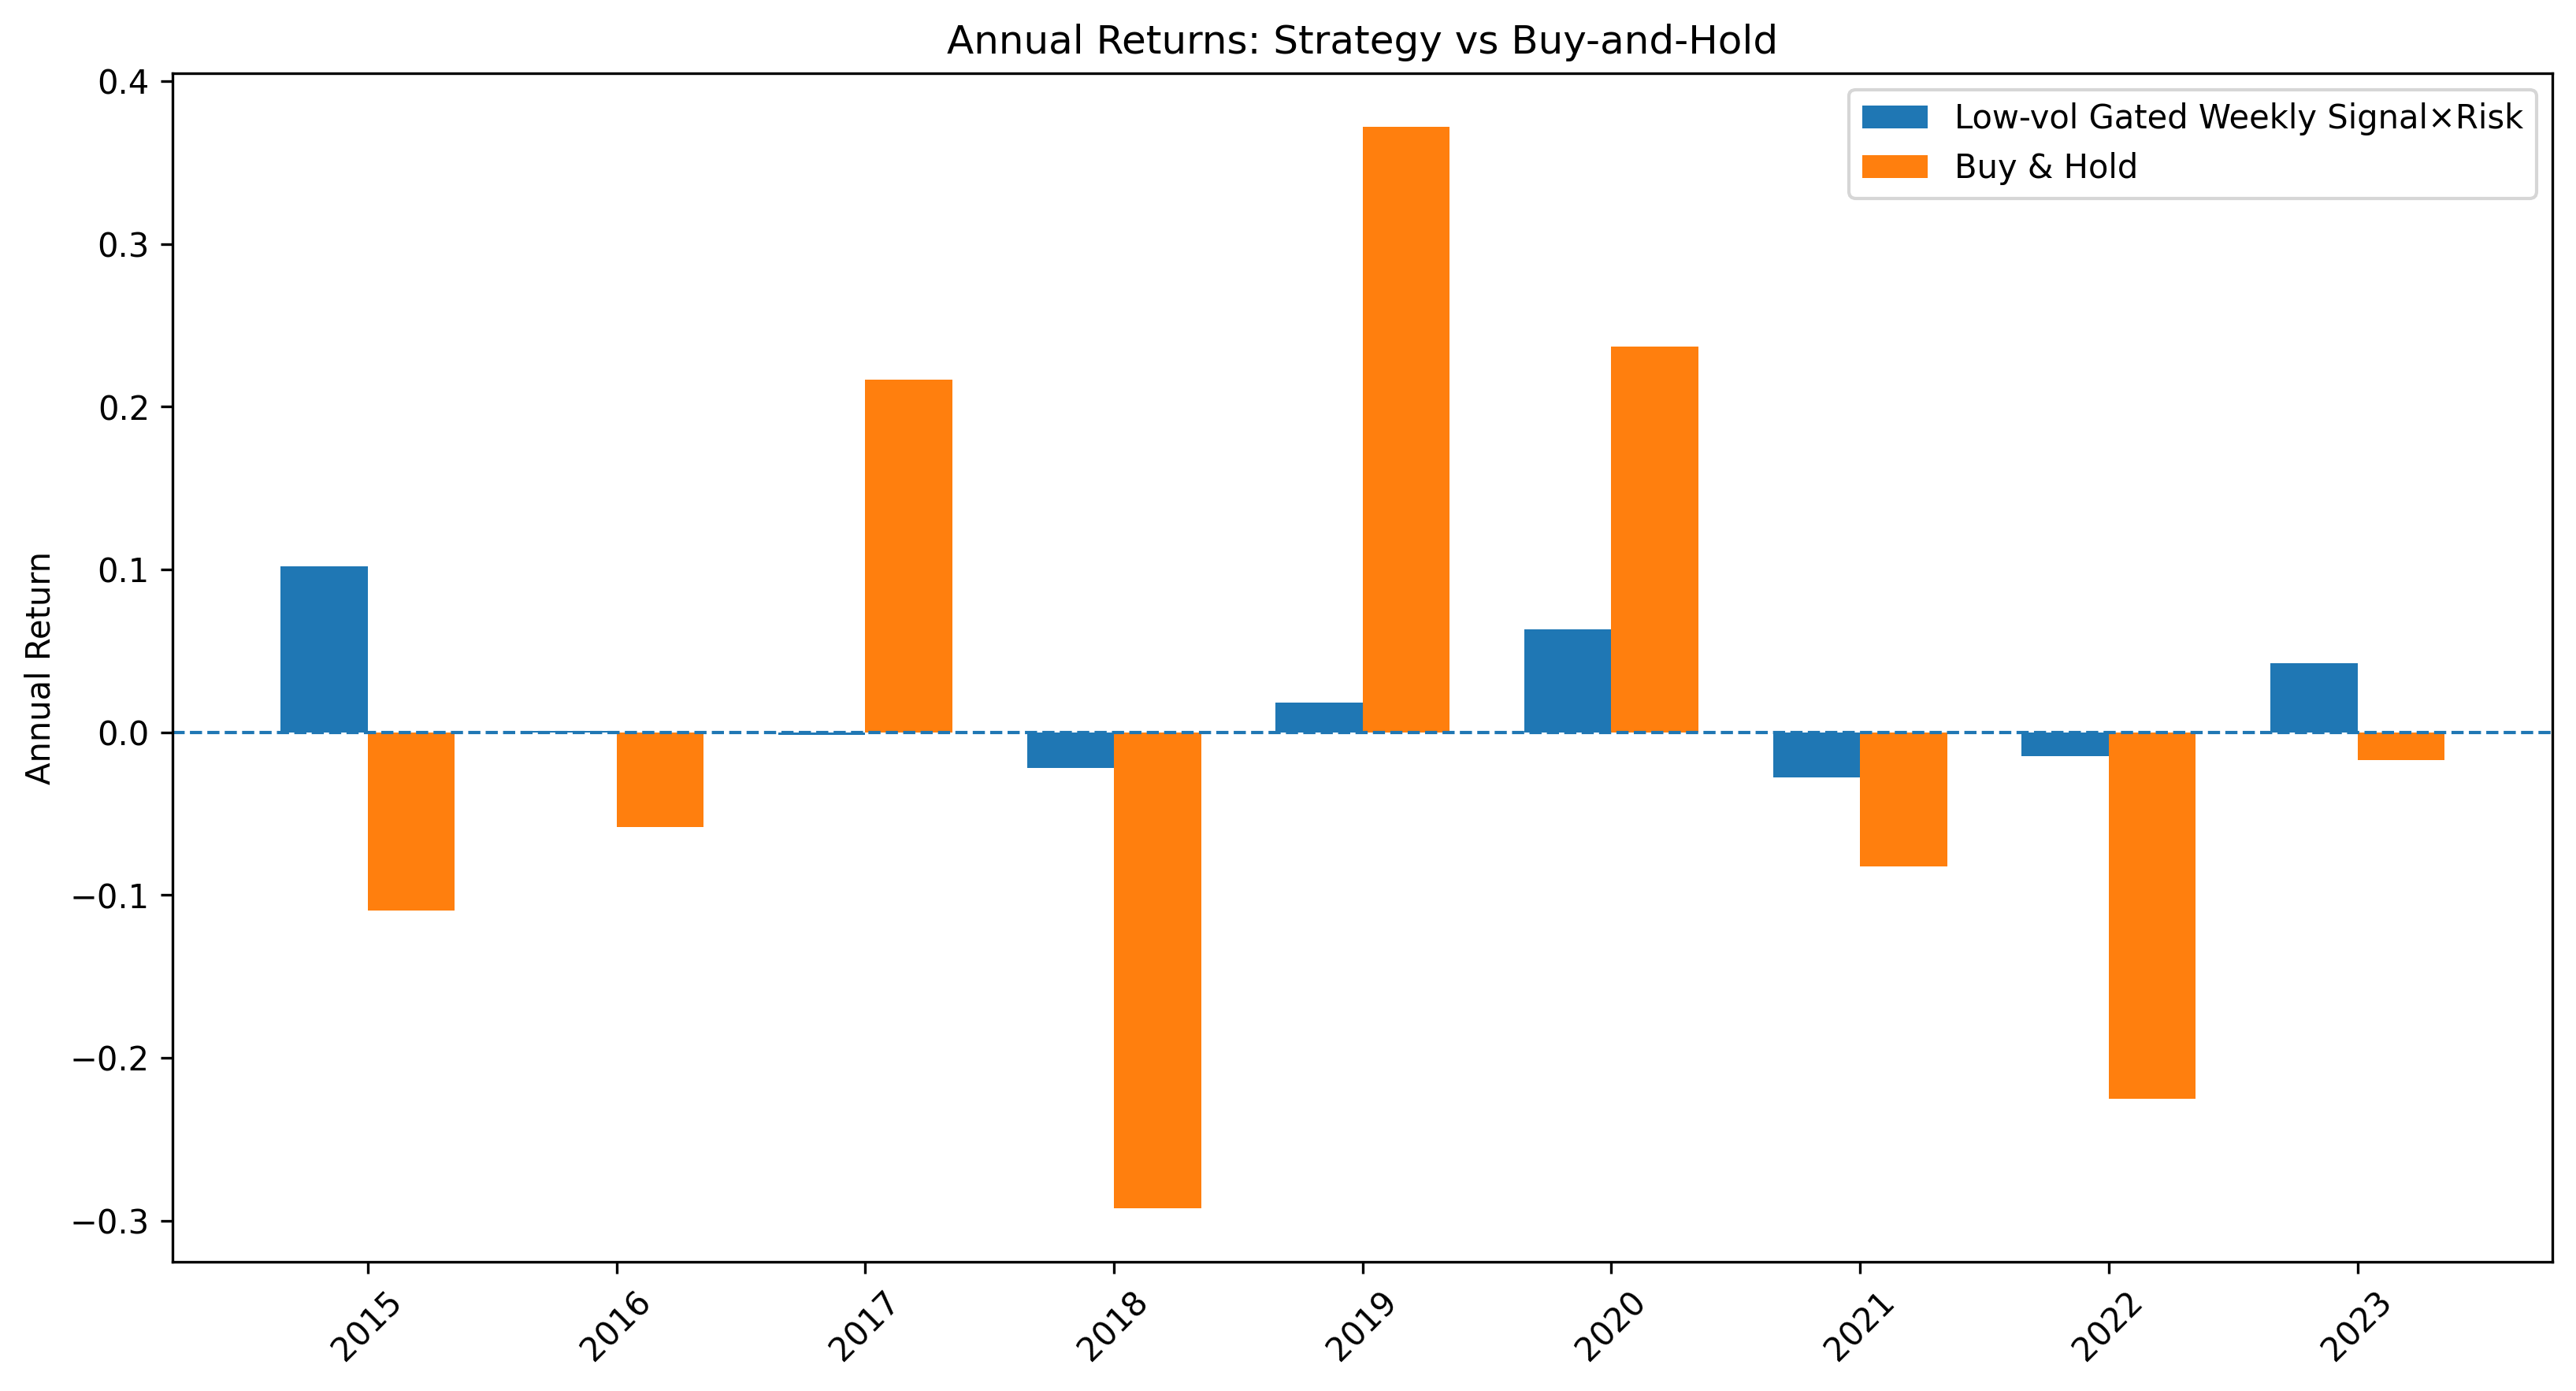
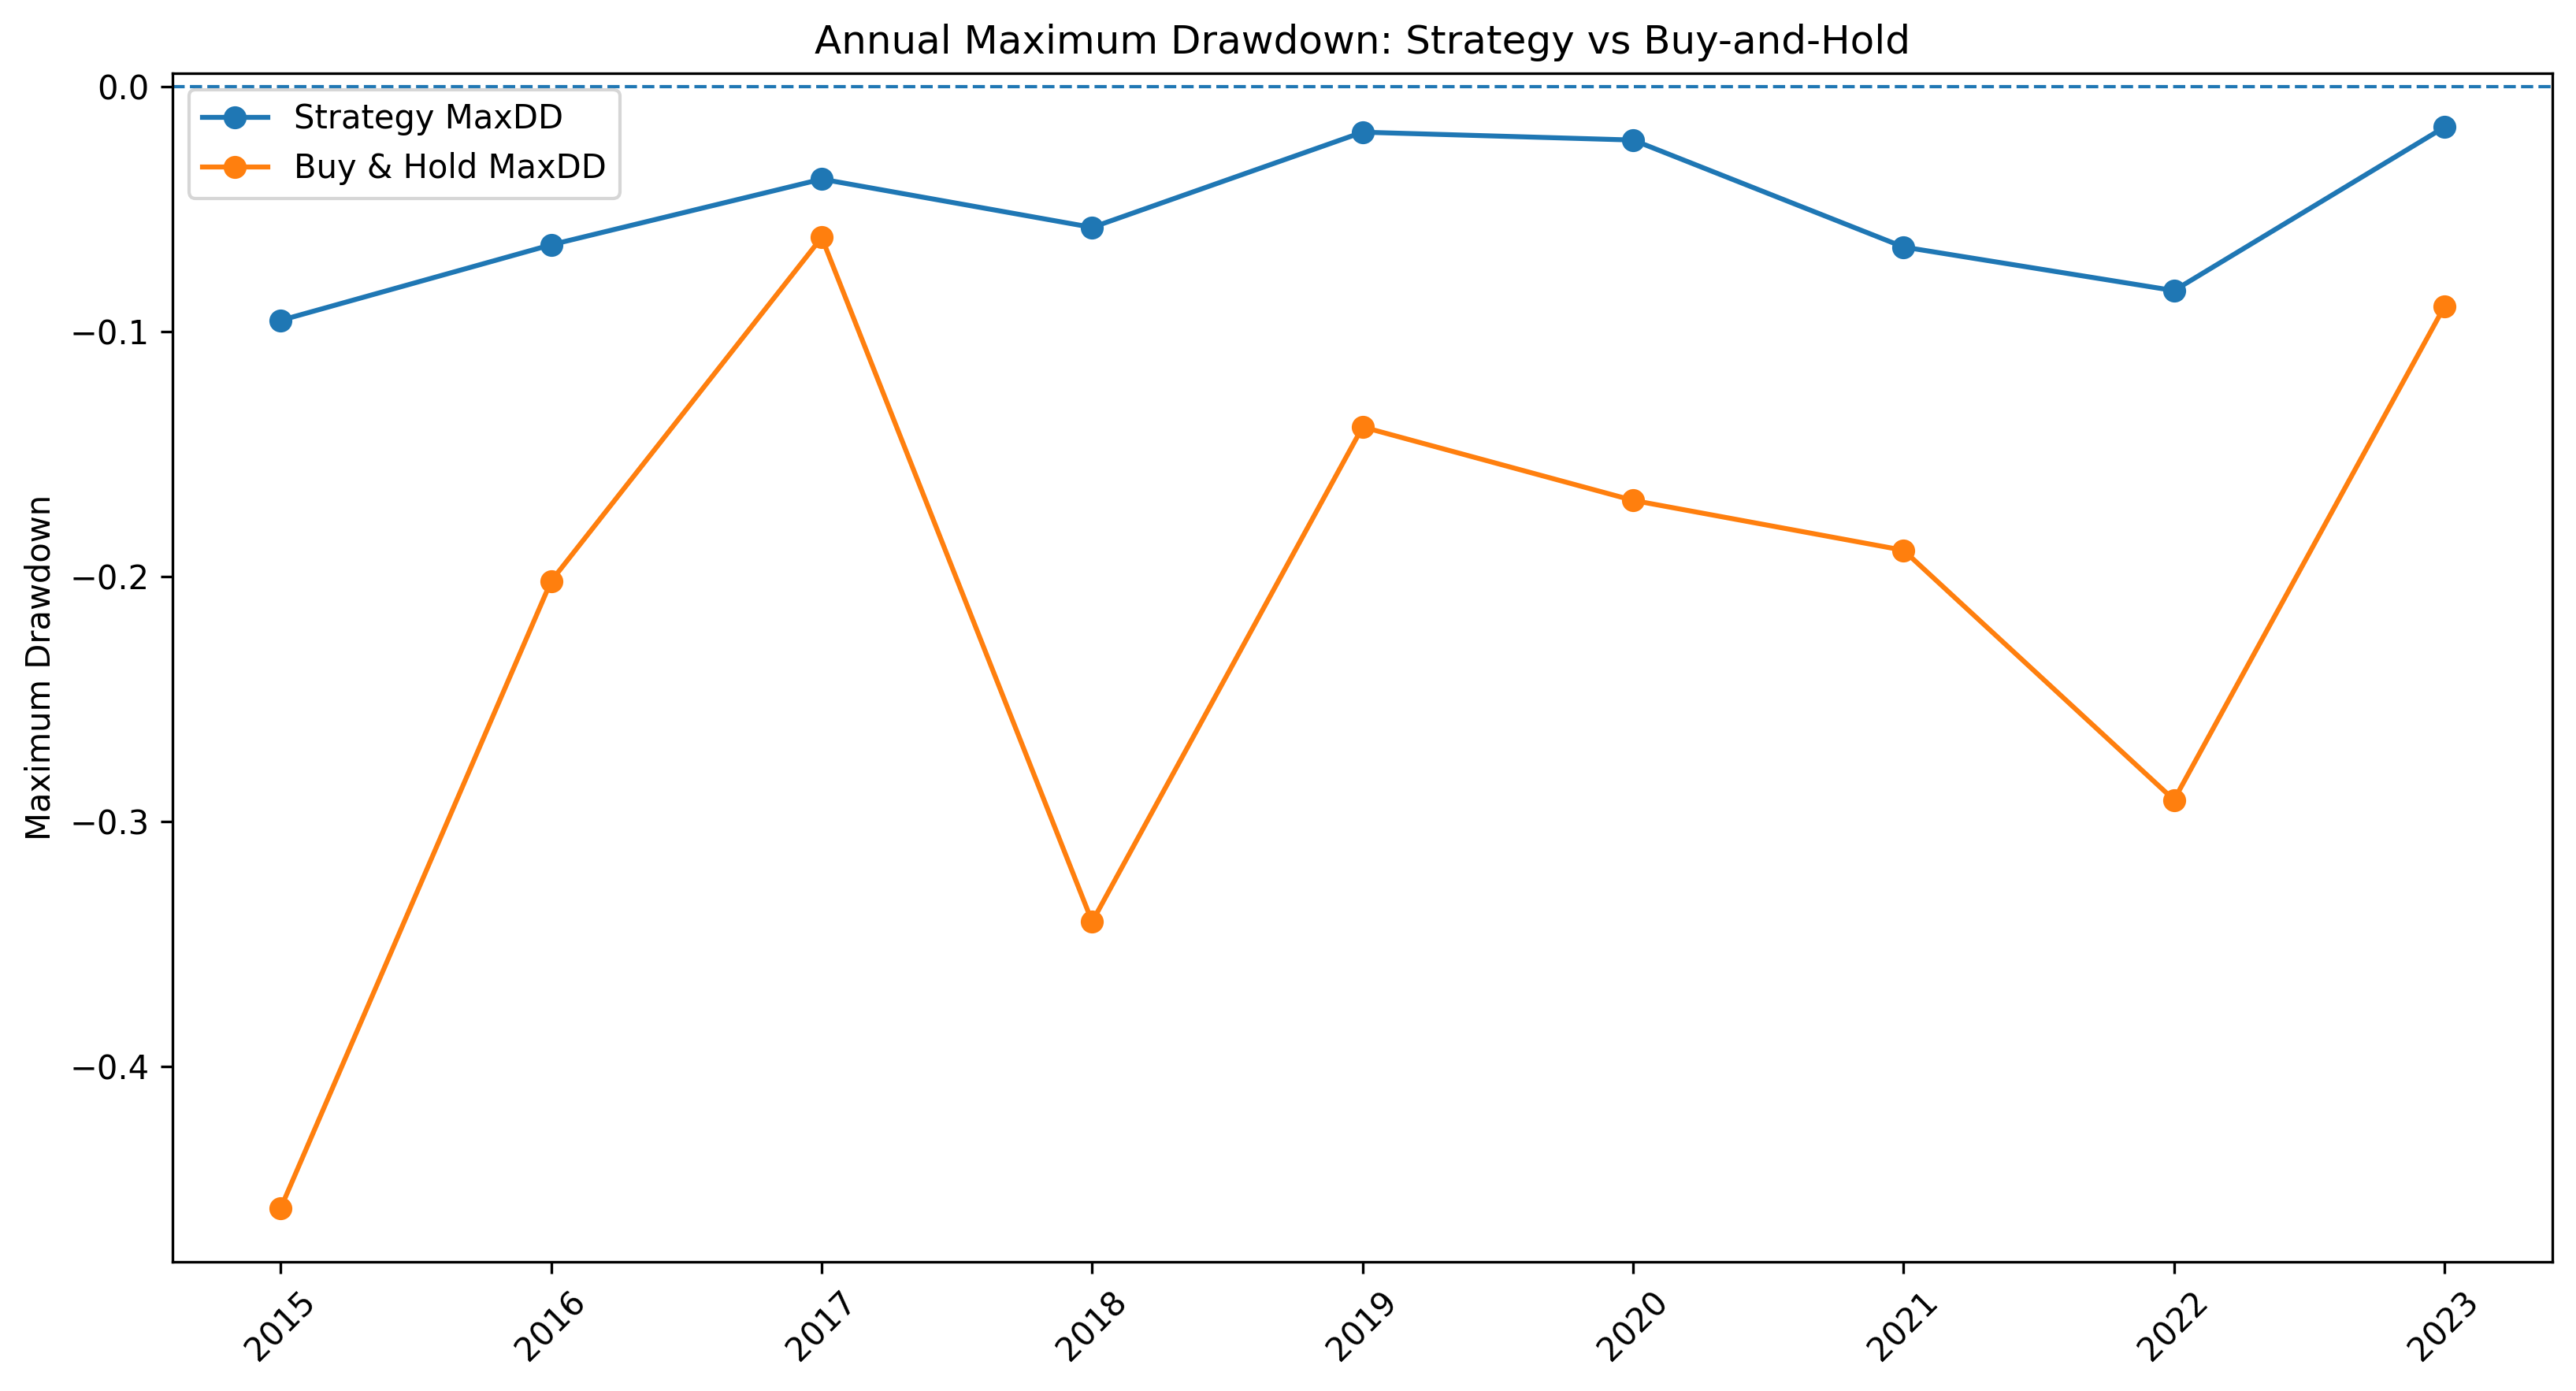
- Trading performance: Simple strategies based on the return forecasts generally failed once you include realistic trading costs. However, careful implementations—using volatility scaling, low-vol gating, thresholds, and turnover limits—produced more “defensive” results (better downside risk control). Still, these gains were not guaranteed and depended on details like how often you retrain and your exact settings.
Why this matters: It suggests that, in practice, the value comes less from strong return predictions (which are rare) and more from using weak, state-dependent signals wisely—especially by managing risk and deciding when not to trade.
Implications: What this means going forward
- Focus on risk first: Forecasting volatility (risk) is more reliable than forecasting returns. That risk information can be very useful for sizing positions and deciding when to be cautious.
- Regimes matter: Markets change character. Tools that detect calm vs. stormy periods make forecasts more adaptive and useful.
- Machine learning helps, but with discipline: It can capture tricky patterns, but careful training, validation, and conservative settings are essential to avoid chasing noise.
- Strategy design is crucial: Small, unstable signals can still be helpful if you combine them with smart implementation—risk scaling, selective trading in calm periods, and low turnover.
- Realism beats optimism: Always test out of sample, include costs, and expect that results may vary with settings. Robustness checks and walk-forward testing are key.
Bottom line
- We can forecast market “storminess” pretty well, especially if we account for changing regimes.
- Predicting tomorrow’s return direction is much harder and only slightly workable in calmer times.
- The best practical gains come from turning weak signals into good risk and allocation rules—not from expecting big, constant profits from prediction alone.
Knowledge Gaps
Knowledge gaps, limitations, and open questions
Below is a single, concrete list of gaps the paper leaves unresolved. Each item is framed to be actionable for future research.
- Market scope and generalizability: Results are based solely on the CSI 300 spot index; it remains unclear whether the integrated framework (regime-aware HARQ volatility + XGBoost returns + implementation) generalizes to other Chinese indices, CSI 300 futures, sectoral indices, single stocks, or non-Chinese markets.
- Instrument-level implementability: The study evaluates strategies using index returns but does not specify a tradable proxy (e.g., ETF vs. futures), shorting constraints, margin requirements, or funding costs in China; results may change materially under realistic instrument constraints.
- Transaction-cost modeling: “Realistic transaction costs” are referenced but not specified or stress-tested; sensitivity to alternative cost assumptions (bid–ask, stamp duty, slippage, fees, collateral) and market regimes remains unquantified.
- Overnight risk omission: Realized volatility excludes overnight returns, yet strategies likely carry overnight exposure; the impact of excluding overnight variance on risk forecasts and next-day return prediction (and trading performance) is not evaluated.
- Microstructure noise and sampling frequency: The baseline relies on 5-minute RV without noise-robust estimators; robustness to microstructure noise (e.g., realized kernel, TSRV) and to alternative sampling intervals (1–30 minutes) is not assessed.
- Jump and asymmetry measures: The “signed jump” proxy is parsimonious; richer jump/semivariance measures (e.g., positive/negative semivariance, tail risk metrics) and their incremental forecasting value are not explored.
- Regime count and structure: Only two regimes are considered; the optimal number of regimes, potential intermediate states, and model selection criteria for regime count are not investigated.
- Transition dynamics: Markov transition probabilities are assumed time-invariant; the role of time-varying transition probabilities (TVTP) driven by macro or market variables (policy changes, liquidity, credit spreads) is not examined.
- Sequential vs. joint estimation: Regimes are identified on HARQ residuals and then fed back to the mean equation; the benefit of joint estimation (e.g., MS-HARQ, MS-HARQ-FIGARCH) vs. the current sequential approach is not tested.
- Residual-based regime identification validity: Using residuals to infer regimes may conflate omitted mean dynamics with volatility states; external validation of regime labels (e.g., news, market stress indicators, implied vol) is missing.
- Heavy-tailed innovation choice: Student-t innovations are assumed; alternative distributions (e.g., skew-t, generalized error) and their effect on regime inference and volatility forecasts are not compared.
- Forecast horizon limitations: Return forecasts are strictly one-day ahead; the framework’s efficacy for multi-horizon (intra-day, weekly, monthly) predictions and allocation decisions is not evaluated.
- Predictor set breadth: Return predictors are limited to volatility/regime and short-lag returns; inclusion of macro, liquidity, sentiment, order-book, cross-asset signals, and realized semivariances is not tested for incremental value.
- Generated-regressor uncertainty: The return model uses first-stage volatility forecasts as predictors without accounting for estimation error; inference methods that propagate first-stage uncertainty (e.g., bootstrap, two-stage inference) are not implemented.
- Alternative ML baselines: XGBoost is the sole ML method; comparative performance vs. linear regularized models (lasso/ridge), random forests, SVMs, neural nets (MLP/LSTM/transformers), and online/adaptive learners is not benchmarked.
- Model objective alignment: Hyperparameters are selected to maximize validation correlation; optimizing for economic objectives (e.g., utility, Sharpe, profit with costs) may alter selections and outcomes—this alignment is not tested.
- Classification vs. regression framing: Return prediction uses regression; classification (directional accuracy) and probabilistic calibration (Brier score, log-loss) are not explored, especially under low signal-to-noise regimes.
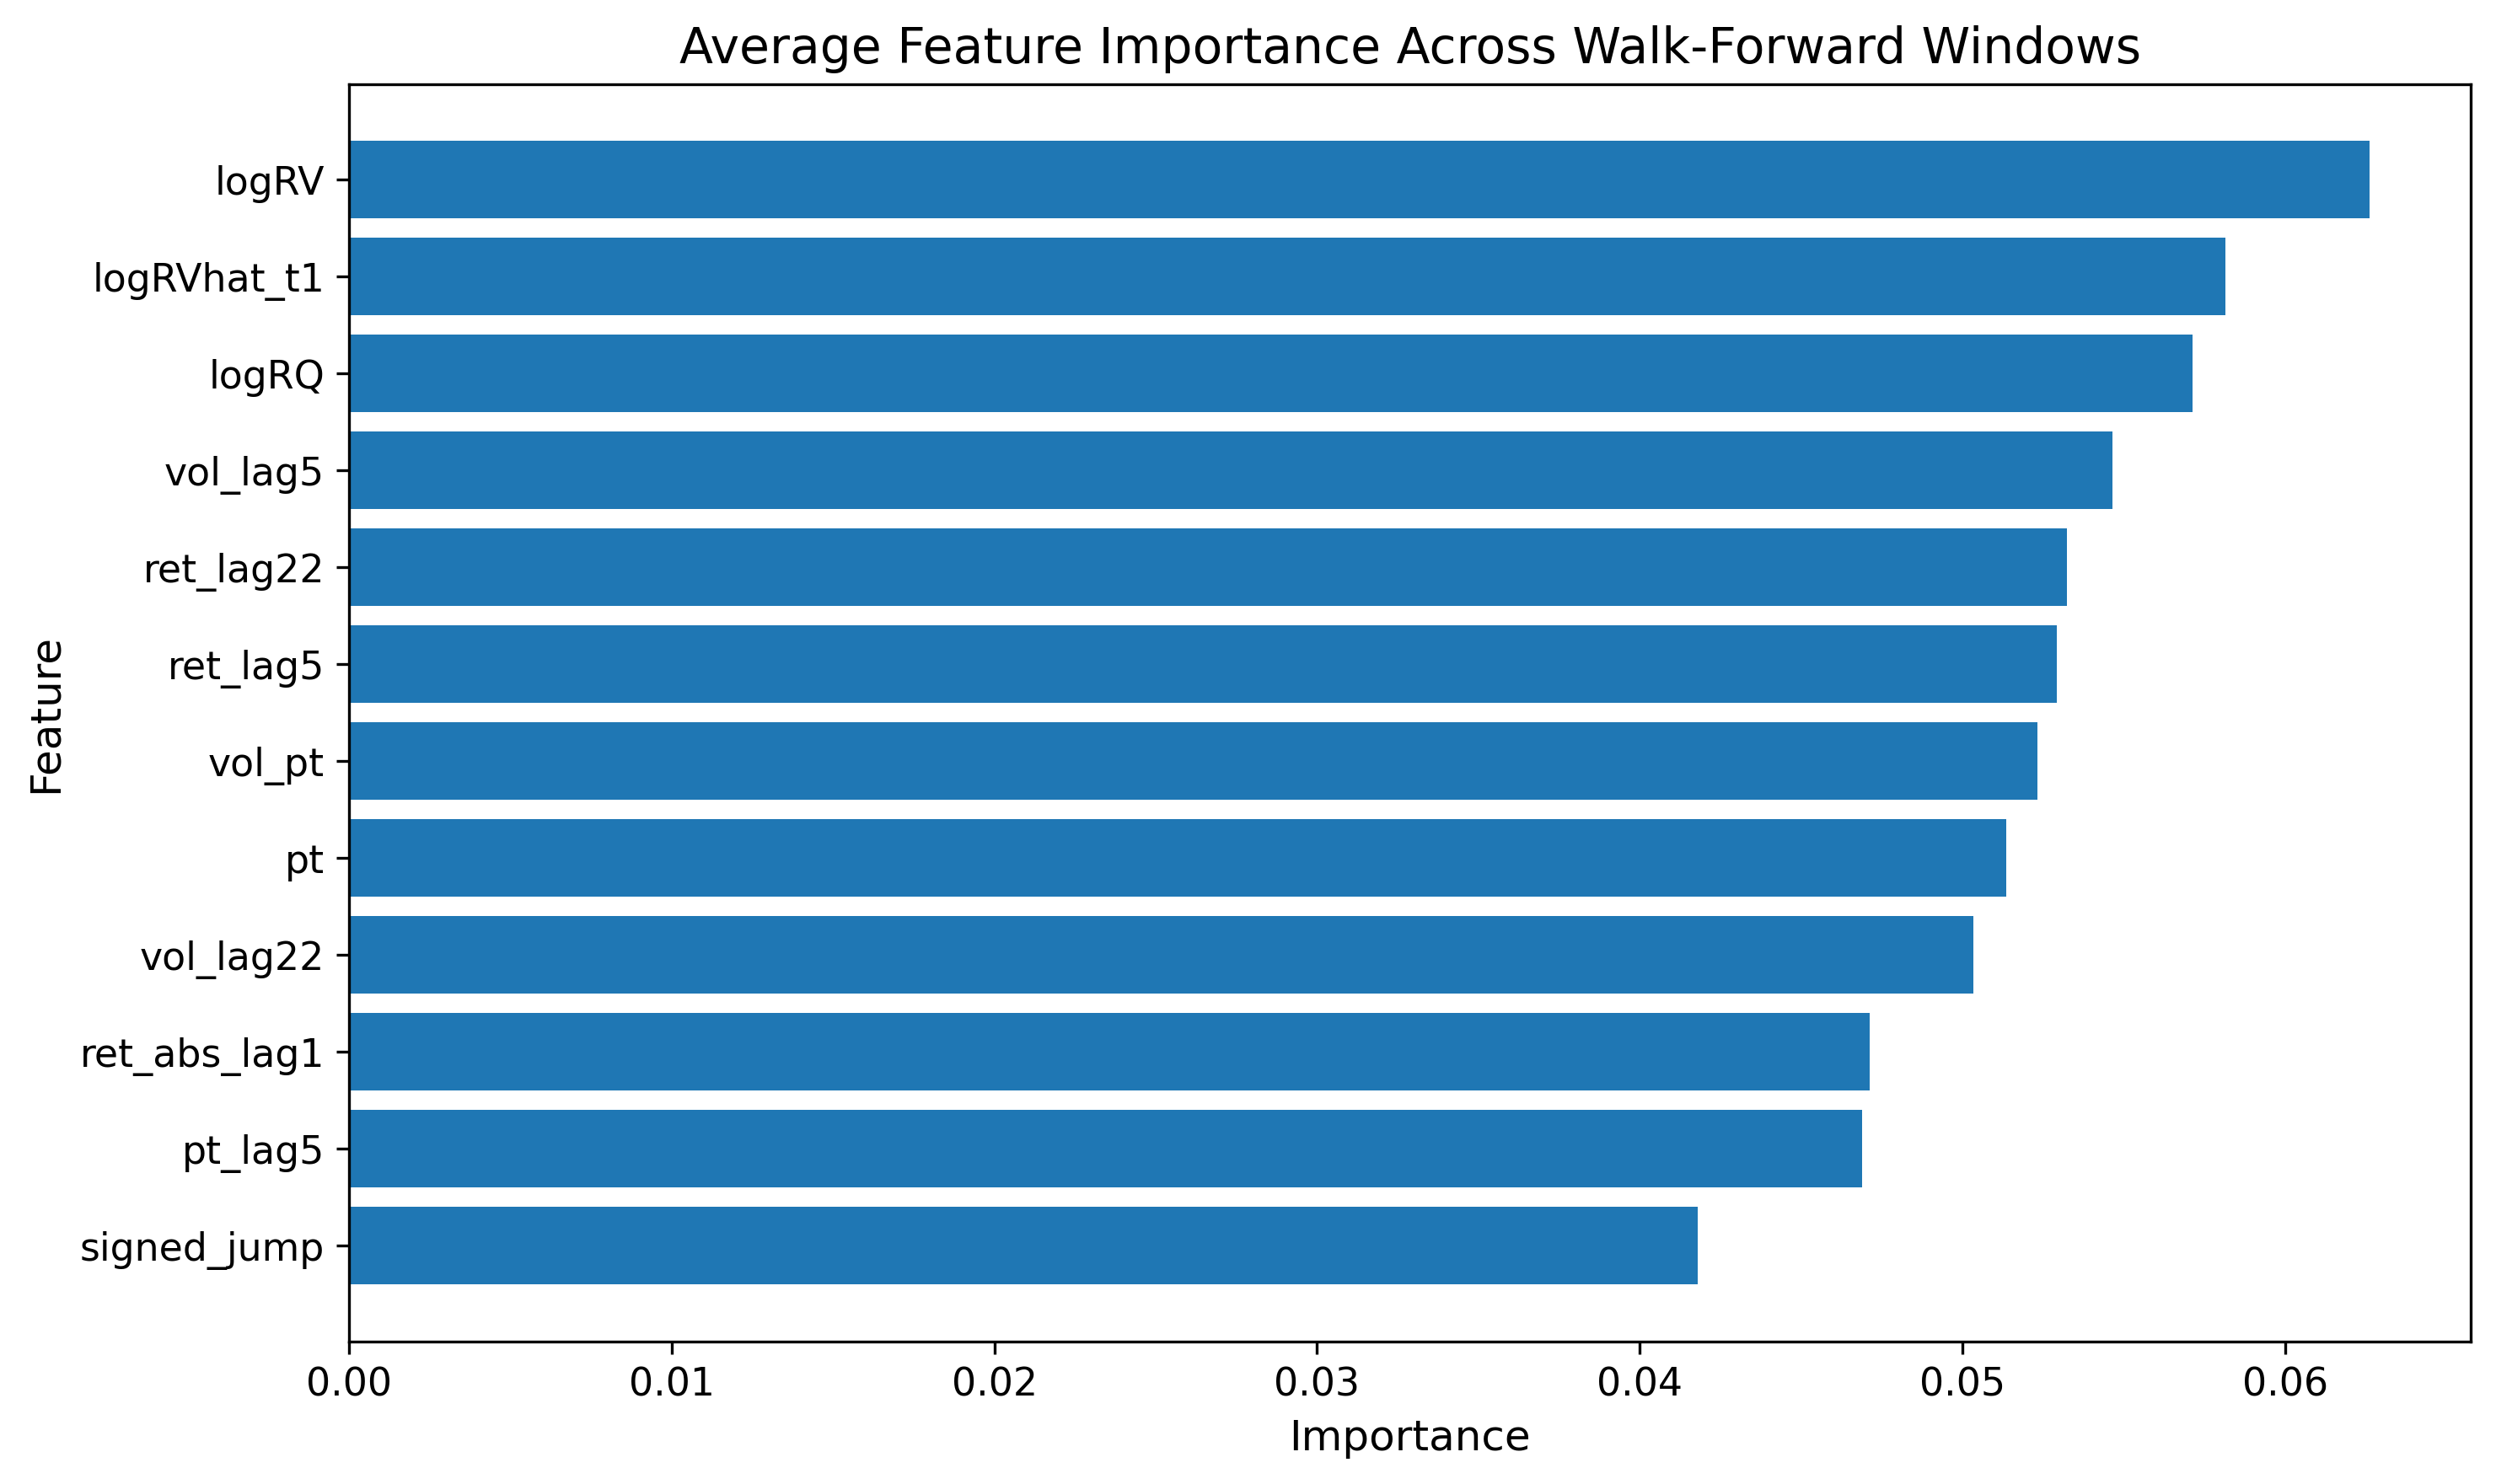
- Feature-importance stability: Time-varying feature importance or SHAP analyses to identify regime-conditional drivers and their stability are not presented; the persistence of signal sources across time is unknown.
- Strategy design sensitivity: Defensive performance is said to be sensitive to implementation choices (gating, thresholds, volatility scaling), but a systematic sensitivity analysis (grid search across design knobs) and formal robustness metrics are not provided.
- Turnover and capacity constraints: The interaction between turnover controls, market depth, and capacity is not quantified; scalability of the proposed strategies is an open question.
- Risk management and tail events: Tail-risk control (drawdowns, CVaR, crash periods like 2008/2015/2020), stress tests, and scenario analyses are limited; how regime-aware signals perform during extreme events remains underexplored.
- Structural breaks and policy shifts: The Chinese market underwent structural changes (e.g., index-futures introduction, short-selling rules, 2015 interventions); explicit break tests and subsample analyses to assess regime-model stability are missing.
- Validation design breadth: The walk-forward scheme is expanding-window with quarterly re-estimation; alternative schemes (rolling windows, dynamic hyperparameter updates, online learning) and their trade-offs are not assessed.
- Statistical significance of return predictability: While volatility forecasts pass formal tests, the statistical significance and stability of state-dependent return predictability (conditional tests by regime) are not rigorously quantified.
- Economic value attribution: It remains unclear whether the improved strategy performance stems primarily from volatility information, regime gating, or specific signal transformations; controlled ablation tied directly to economic outcomes is limited.
- Multi-asset integration: The framework focuses on a single index; whether regime-aware volatility signals improve cross-sectional allocation (sector rotation, style tilts) or diversification across asset classes is not examined.
- Practical deployment considerations: Real-time data latency, computation time, and operational constraints (e.g., intraday updating of RV/ROV, order timing relative to the midday break and close) are not addressed.
Practical Applications
Immediate Applications
Below are practical use cases that can be built and deployed now, given the paper’s findings that regime-aware volatility forecasting is reliable and that return predictability is weak, state-dependent, and strongest in low-volatility regimes. The emphasis is on defensive overlays, risk management, and implementation realism (volatility scaling, low-vol gating, thresholding, turnover control, transaction costs).
- Volatility-forecast and regime-probability API for Chinese equities
- Sectors: Finance (sell-side research, buy-side, risk vendors), Software/Analytics
- What to build: A daily API that serves next-day realized volatility forecast and filtered high-volatility regime probability for CSI 300 (and extensions to major A-share indices). Include walk-forward backtests and confidence bands.
- Tools/workflow: HARQ + residual MSGJR-GARCH-t pipeline; filtered probabilities p_t; automated quarterly re-estimation; monitoring dashboards.
- Assumptions/dependencies: Access to 5-minute data (e.g., Wind); robust ETL for session filtering; compute for daily model updates; model governance to prevent look-ahead; stable transaction cost estimates.
- Volatility-aware exposure throttling for CSI 300 index and futures
- Sectors: Asset management (long-only, quant), Hedge funds, Robo-advisors
- What to build: A portfolio overlay that scales equity exposure by predicted volatility and gates signals to low-vol regimes (e.g., hold, reduce, or neutralize risk when p_t is high; scale position by target-vol rules).
- Tools/workflow: Daily target vol = constant / sqrt(exp(ŶlogRV)); regime gating (trade only if p_t < threshold); turnover caps; walk-forward threshold calibration.
- Assumptions/dependencies: Weak and state-dependent return predictability means focus on drawdown control rather than alpha; reliable transaction-cost model; live execution constraints.
- Defensive trading signal with low-vol gating and turnover control
- Sectors: Asset management, Proprietary trading
- What to build: A weekly trade schedule that executes only when (i) p_t indicates low-vol regime, (ii) model confidence exceeds calibrated threshold, and (iii) turnover budget not breached. Objective: improve Sharpe and downside risk rather than headline return.
- Tools/workflow: XGBoost with small, conservative hyperparameter grid; risk-scaled signal s_t = forecast return / forecast vol; weekly rebalance; queue-position-aware execution.
- Assumptions/dependencies: Transaction costs can erase naive alpha; the strategy’s edge is defensive and implementation-sensitive; strict walk-forward validation is essential.
- Intraday risk limits and margin add-ons informed by regime probabilities
- Sectors: Brokerage, Prime services, Clearing members (FCMs), Market making
- What to build: Adjust client/intraday risk limits and add-ons based on p_t. For high p_t, tighten leverage caps and widen risk buffers; for low p_t, allow standard levels.
- Tools/workflow: Daily regime dashboard; rules engine mapping p_t to leverage/margin multipliers; automated alerts.
- Assumptions/dependencies: Internal governance for model-driven risk policies; supervisory acceptance; backtesting for default risk mitigation benefits.
- Options books and vol-surface monitoring augmentation
- Sectors: Derivatives market making, Structured products
- What to build: Use realized-volatility forecasts as an input to short-dated vol-surface anchoring and to stress-scenario selection, especially around low/high regime transitions.
- Tools/workflow: Integrate ŶRV into vol-surface calibration priors; p_t-based scenario weighting; P&L attribution vs. realized vol.
- Assumptions/dependencies: Forecasts pertain to realized vol, not implied; need mapping between realized and implied dynamics; liquidity and hedging costs matter.
- Stress-testing scenarios driven by regime shifts
- Sectors: Risk management (banks, asset managers), Treasury
- What to build: Incorporate high-vol regime states as scenario triggers for stress-testing portfolios (e.g., preset shocks when p_t breaches a threshold).
- Tools/workflow: Scenario library keyed to regime probabilities; automated test runs; reporting on capital and liquidity impacts.
- Assumptions/dependencies: Historical mapping from regimes to loss distributions; data lineage and auditability for model risk.
- Research and teaching modules on integrated econometrics + ML
- Sectors: Academia (finance, econometrics, data science)
- What to build: Course modules and replications that use high-frequency realized measures, regime-switching filtering, and XGBoost with walk-forward validation on Chinese equity data.
- Tools/workflow: Reproducible notebooks; pipeline templates; assignments comparing filtered vs. smoothed probabilities and their impact on look-ahead bias.
- Assumptions/dependencies: Access to HF data or curated sample; software stack (R/Python) with MSGARCH/XGBoost equivalents.
- Market monitoring dashboards for exchanges and regulators (informational use)
- Sectors: Policy/Regulation (CSRC, SSE, SZSE), Exchange surveillance
- What to build: Internal dashboards that track inferred volatility regimes, transitions, and clustering; early warning signals for disorderly markets.
- Tools/workflow: Daily p_t and ŶRV panels; transition heatmaps; alerts when regime persistence rises.
- Assumptions/dependencies: Informational—not mechanical—use to avoid procyclicality; governance for alert thresholds.
- DIY defensive rules for retail investors (via ETFs or index funds)
- Sectors: Personal finance (daily life)
- What to build: Simple heuristic: invest a base allocation to a CSI 300 fund; reduce or halt new purchases when high-vol regime probability is elevated; optionally use a conservative target-vol sizing.
- Tools/workflow: Broker watchlist; weekly/monthly check on public risk indicators (or third-party app); avoid overtrading to minimize costs and taxes.
- Assumptions/dependencies: Retail does not have HF data—must rely on proxies (e.g., public realized-vol indexes, ETF volatility); beware whipsaw risk.
Long-Term Applications
These require further research, scaling, regulatory process, or infrastructure (e.g., broader asset coverage, intraday deployment, richer data, or institutional approval).
- Dynamic margining frameworks that respond to regime states
- Sectors: Policy/Regulation (exchanges, CCPs), Brokerage/Prime
- What to build: Risk-based margin models that incorporate regime probabilities to reduce procyclicality (e.g., gradual, rules-based margin escalators when p_t trends higher; pre-announced buffers).
- Tools/workflow: Backtests of margin breach rates; policy calibration to avoid liquidity spirals; supervisory consultation.
- Assumptions/dependencies: Regulatory approval; governance to prevent cliff effects; robust validation across crises.
- Volatility-aware smart-beta and target-vol ETFs for China
- Sectors: Asset management, ETF providers
- What to build: Funds that implement low-vol gating and dynamic volatility targeting on CSI 300 constituents; transparent, rules-based methodologies with turnover controls.
- Tools/workflow: Index construction with p_t filters; rebalance calendaring; creation-redemption operational design to handle dynamic exposure.
- Assumptions/dependencies: Index licensing, regulatory approval, investor education; reliable HF-derived signals (or robust proxies).
- Cross-asset and cross-market regime contagion monitors
- Sectors: Systemic risk oversight, Multi-asset trading/risk desks
- What to build: A platform that estimates regime probabilities for equities, rates, FX, and commodities; monitors joint regime transitions and spillovers for early warning and cross-hedging.
- Tools/workflow: Multi-asset data ingestion; unified regime engines; network analytics of regime co-movement.
- Assumptions/dependencies: Data licenses across assets; methodological extensions to asset-specific microstructure; latency and compute scaling.
- Intraday deployment and adaptive execution strategies
- Sectors: HFT/low-latency, Execution algorithms
- What to build: Intraday regime detection to modulate participation rates, limit-order aggressiveness, and quote widths; switch execution styles (VWAP/TWAP/POV) based on evolving p_t.
- Tools/workflow: Real-time 1–5-minute realized-vol estimators (noise-robust); streaming model updates; microstructure-aware cost models.
- Assumptions/dependencies: High-quality tick data; robust noise filtering; engineering for ultra-low-latency.
- Hybrid realized–implied volatility fusion for options and risk transfer
- Sectors: Derivatives trading, Insurance/structured solutions
- What to build: Models that jointly use regime-aware realized-vol forecasts and option-implied signals to price/hedge short-dated risk and structure protective overlays.
- Tools/workflow: State-space fusion of realized and implied measures; regime-weighted hedging rules; calibration to smiles/skews.
- Assumptions/dependencies: Market liquidity; persistent mapping between realized and implied dynamics; robust model risk controls.
- Macro-conditioned regime switching and policy analysis
- Sectors: Central banks, Economic research, Policy design
- What to build: State-transition models with macro covariates (liquidity, credit, funding spreads) to assess when volatility regimes align with macro stress; inform macroprudential buffers or communication.
- Tools/workflow: Time-varying transition probabilities; macro dashboards; counterfactual policy simulations.
- Assumptions/dependencies: Reliable macro data timeliness; careful treatment of endogeneity; limits on mechanical policy feedback.
- Model governance, audit trails, and standards for financial ML pipelines
- Sectors: Finance (enterprise risk, model risk), RegTech
- What to build: Governance frameworks that codify walk-forward validation, generated regressor handling, transaction-cost-aware backtesting, and regime diagnostics; audit-ready reporting.
- Tools/workflow: Versioned data/model registries; bias/leakage detection; challenger–champion evaluation.
- Assumptions/dependencies: Enterprise adoption and culture; regulator alignment on ML documentation standards.
- Retail-facing risk indicator apps using robust proxies
- Sectors: Fintech, Personal finance (daily life)
- What to build: Consumer apps that provide simplified regime risk indicators using public data proxies (e.g., short-horizon realized vol of CSI 300 ETF returns), with education on defensive behaviors.
- Tools/workflow: Proxy modeling for p_t; simplified heuristics; guardrails against overtrading.
- Assumptions/dependencies: Data latency; usability; responsible communication to avoid procyclical behavior.
- Generalization to other markets and asset classes
- Sectors: Global asset management, Multi-asset research
- What to build: Port the two-stage framework to US, Europe, EM, and to rates/FX/commodities; benchmark regime-aware HARQ variants vs. deep hybrids; identify market-specific gating and vol-scaling rules.
- Tools/workflow: Standardized backtesting harness; transaction-cost models per venue; meta-analysis across markets.
- Assumptions/dependencies: Transferability of regime benefits; microstructure differences; data vendor coverage.
- Reinforcement learning and adaptive policy overlays on top of regime-aware signals
- Sectors: Quant funds, Advanced trading tech
- What to build: RL agent that decides when to engage/disengage and size trades using p_t, predicted vol, and execution frictions; reward shaped for drawdown control.
- Tools/workflow: Safe RL with constraints; simulator with realistic TC/impact; periodic human-in-the-loop reviews.
- Assumptions/dependencies: Avoiding overfitting to nonstationary markets; interpretability and control; compute resources.
Notes on assumptions that apply broadly:
- Data: High-frequency, quality-controlled intraday data and careful session filtering are critical; if unavailable, consider robust proxies and accept reduced performance.
- Nonstationarity: Use expanding-window, walk-forward validation; expect recalibration needs and parameter drift.
- Weak alpha: Return signals are weak and regime-dependent; economic value primarily comes from risk management, not directional bets.
- Costs and implementation: Transaction costs, turnover management, and execution constraints can dominate outcomes; design strategies defensively.
- Model risk and governance: Avoid look-ahead (use filtered, not smoothed probabilities), log-transform volatility, and document generated regressors and validation choices.
Glossary
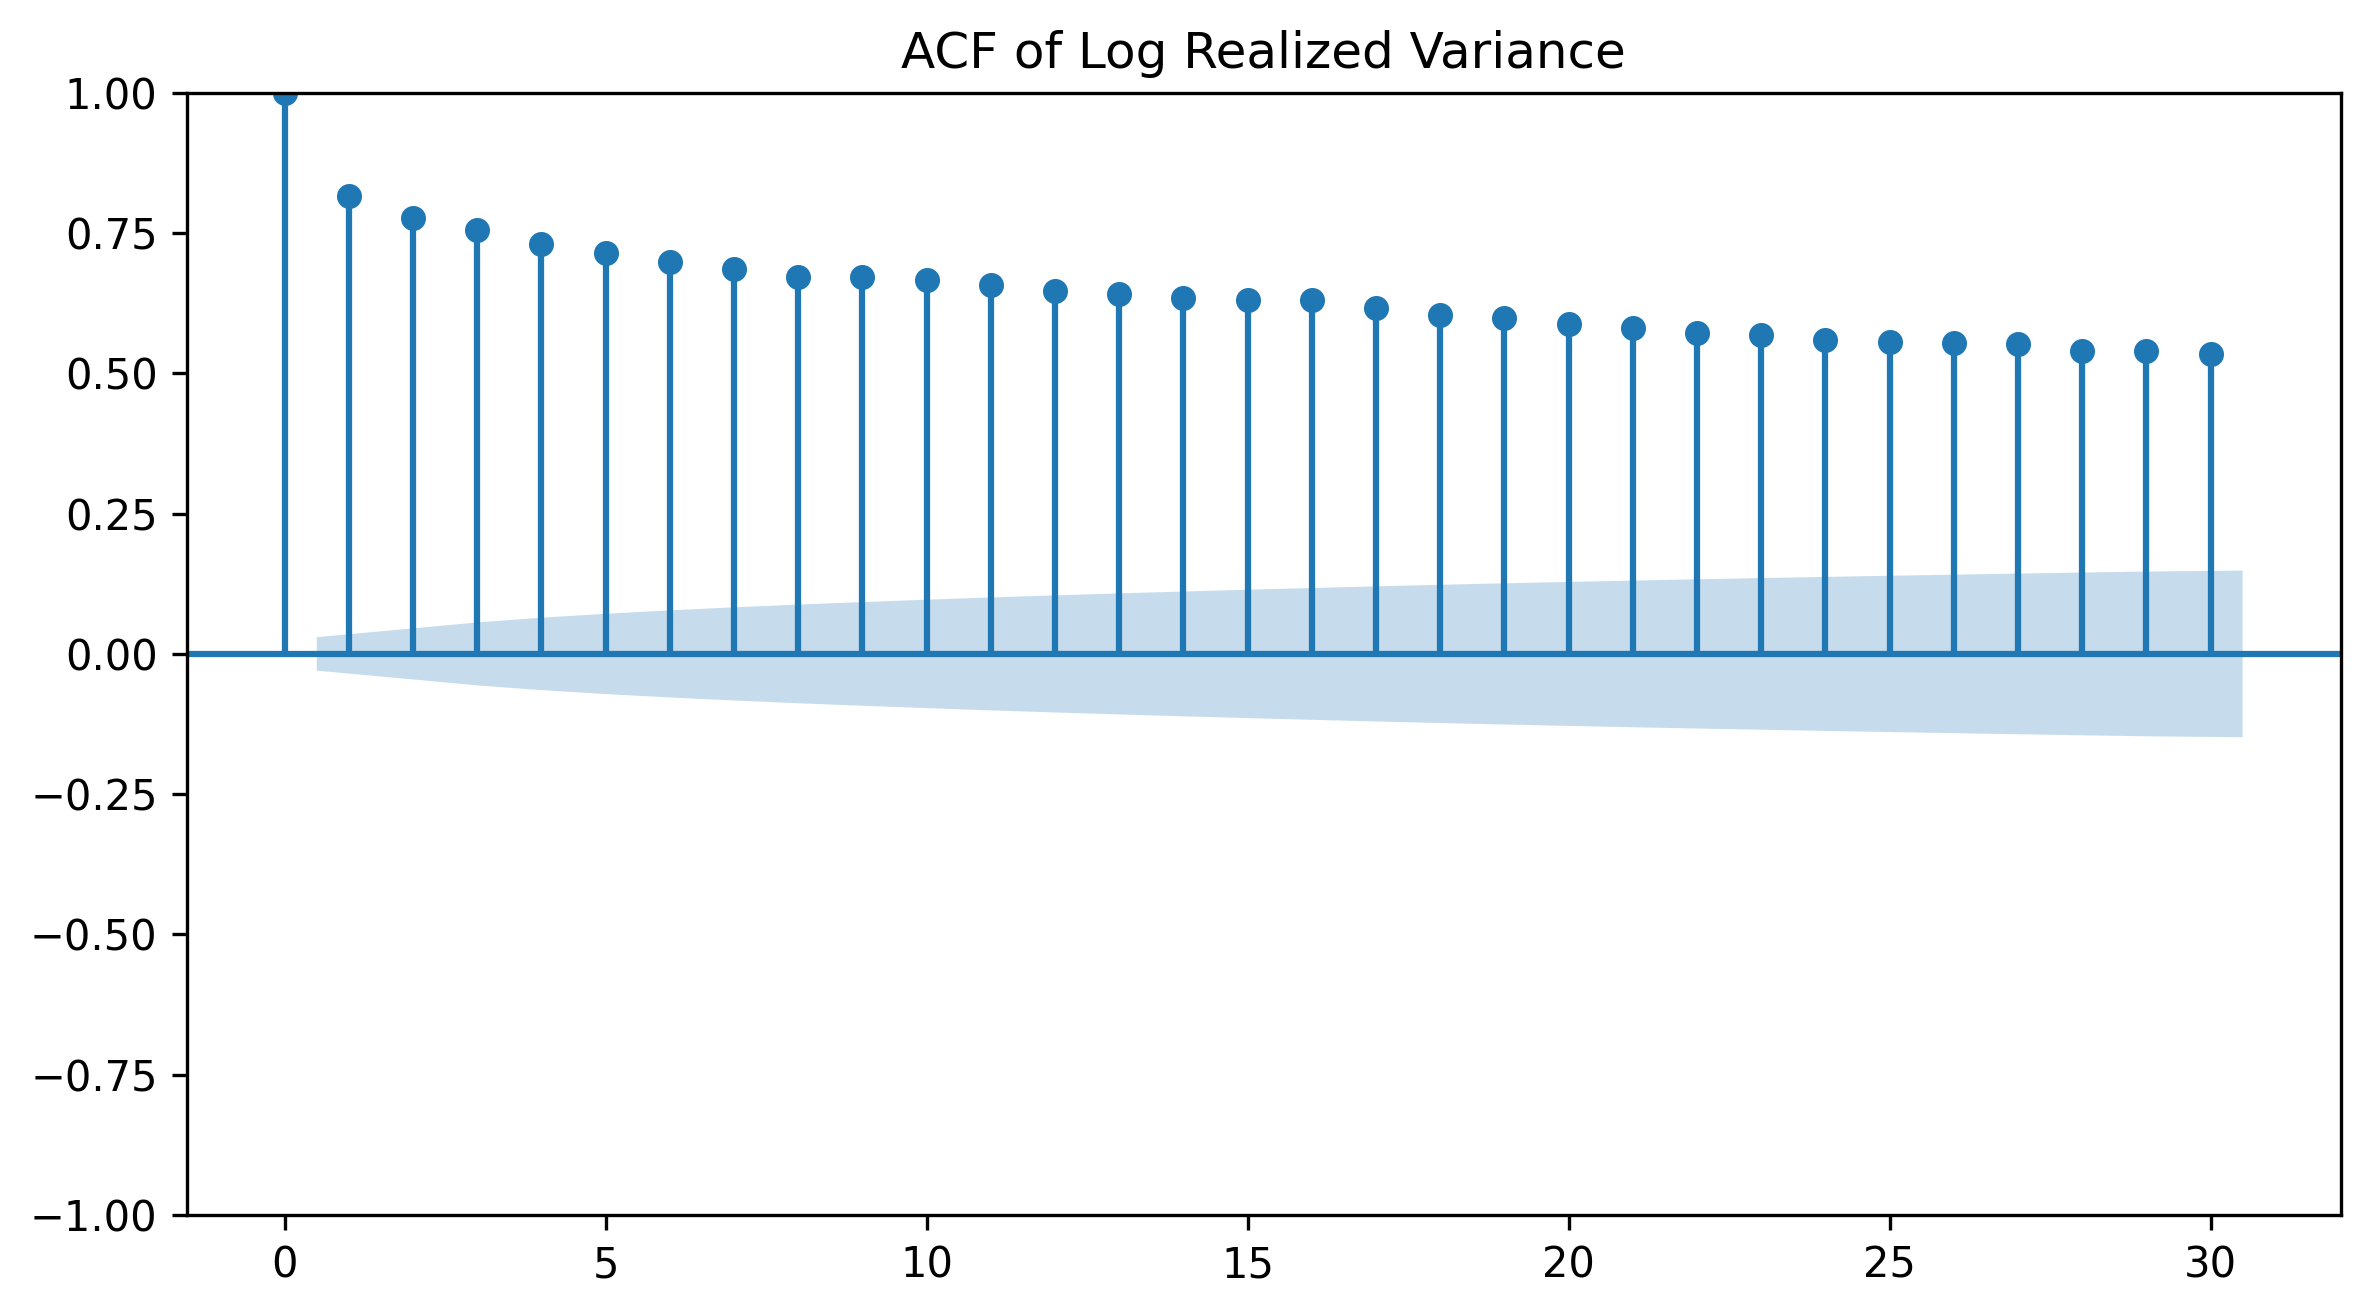
- Autocorrelation function: A statistical tool that measures correlations of a time series with its own past values across different lags. "Autocorrelation function of log-realized variance"
- Bipower variation: A robust high-frequency estimator used to isolate the continuous component of price variability, robust to jumps. "introduce bipower variation as a robust estimator of the continuous sample-path component."
- Expanding-window walk-forward framework: An out-of-sample evaluation method that re-estimates models as new data arrive by expanding the training set over time. "an expanding-window walk-forward framework"
- Feature ablation: An evaluation technique that removes specific features to assess their incremental predictive value. "feature-ablation experiments are conducted to evaluate the incremental value of volatility forecasts and regime-related variables for both statistical return prediction and economic strategy performance."
- FIGARCH: Fractionally Integrated GARCH; a volatility model capturing long memory in conditional variance. "MS-HARQ-FIGARCH framework"
- Filtered probabilities: Real-time state probabilities in a hidden-state model computed using only information up to the current time. "Filtered probabilities are used because they depend only on contemporaneously available information."
- GARCH: Generalized Autoregressive Conditional Heteroskedasticity; a class of models for time-varying volatility. "GARCH-family volatility dynamics"
- Generated regressor: A predictor that is itself an estimated quantity from a prior model rather than directly observed. "it should be interpreted as a generated regressor."
- GJR-GARCH: A GARCH variant allowing asymmetry where negative shocks affect future volatility differently from positive shocks. "the GJR-GARCH model"
- Heterogeneous Autoregressive (HAR) model: A model for realized volatility using components over multiple horizons to capture long memory. "Heterogeneous Autoregressive model:"
- HARQ model: An extension of HAR that augments the specification with realized quarticity to account for volatility-of-volatility. "the HARQ model is commonly estimated in logarithmic form:"
- High-frequency data: Intraday financial observations (e.g., 5-minute prices) enabling precise realized volatility estimation. "The availability of high-frequency data has led to a major advancement in this area through the development of realized measures."
- Integrated variance: The continuous-time total variance of returns over a period; realized variance consistently estimates it under ideal conditions. "a consistent estimator of the integrated variance of the underlying price process"
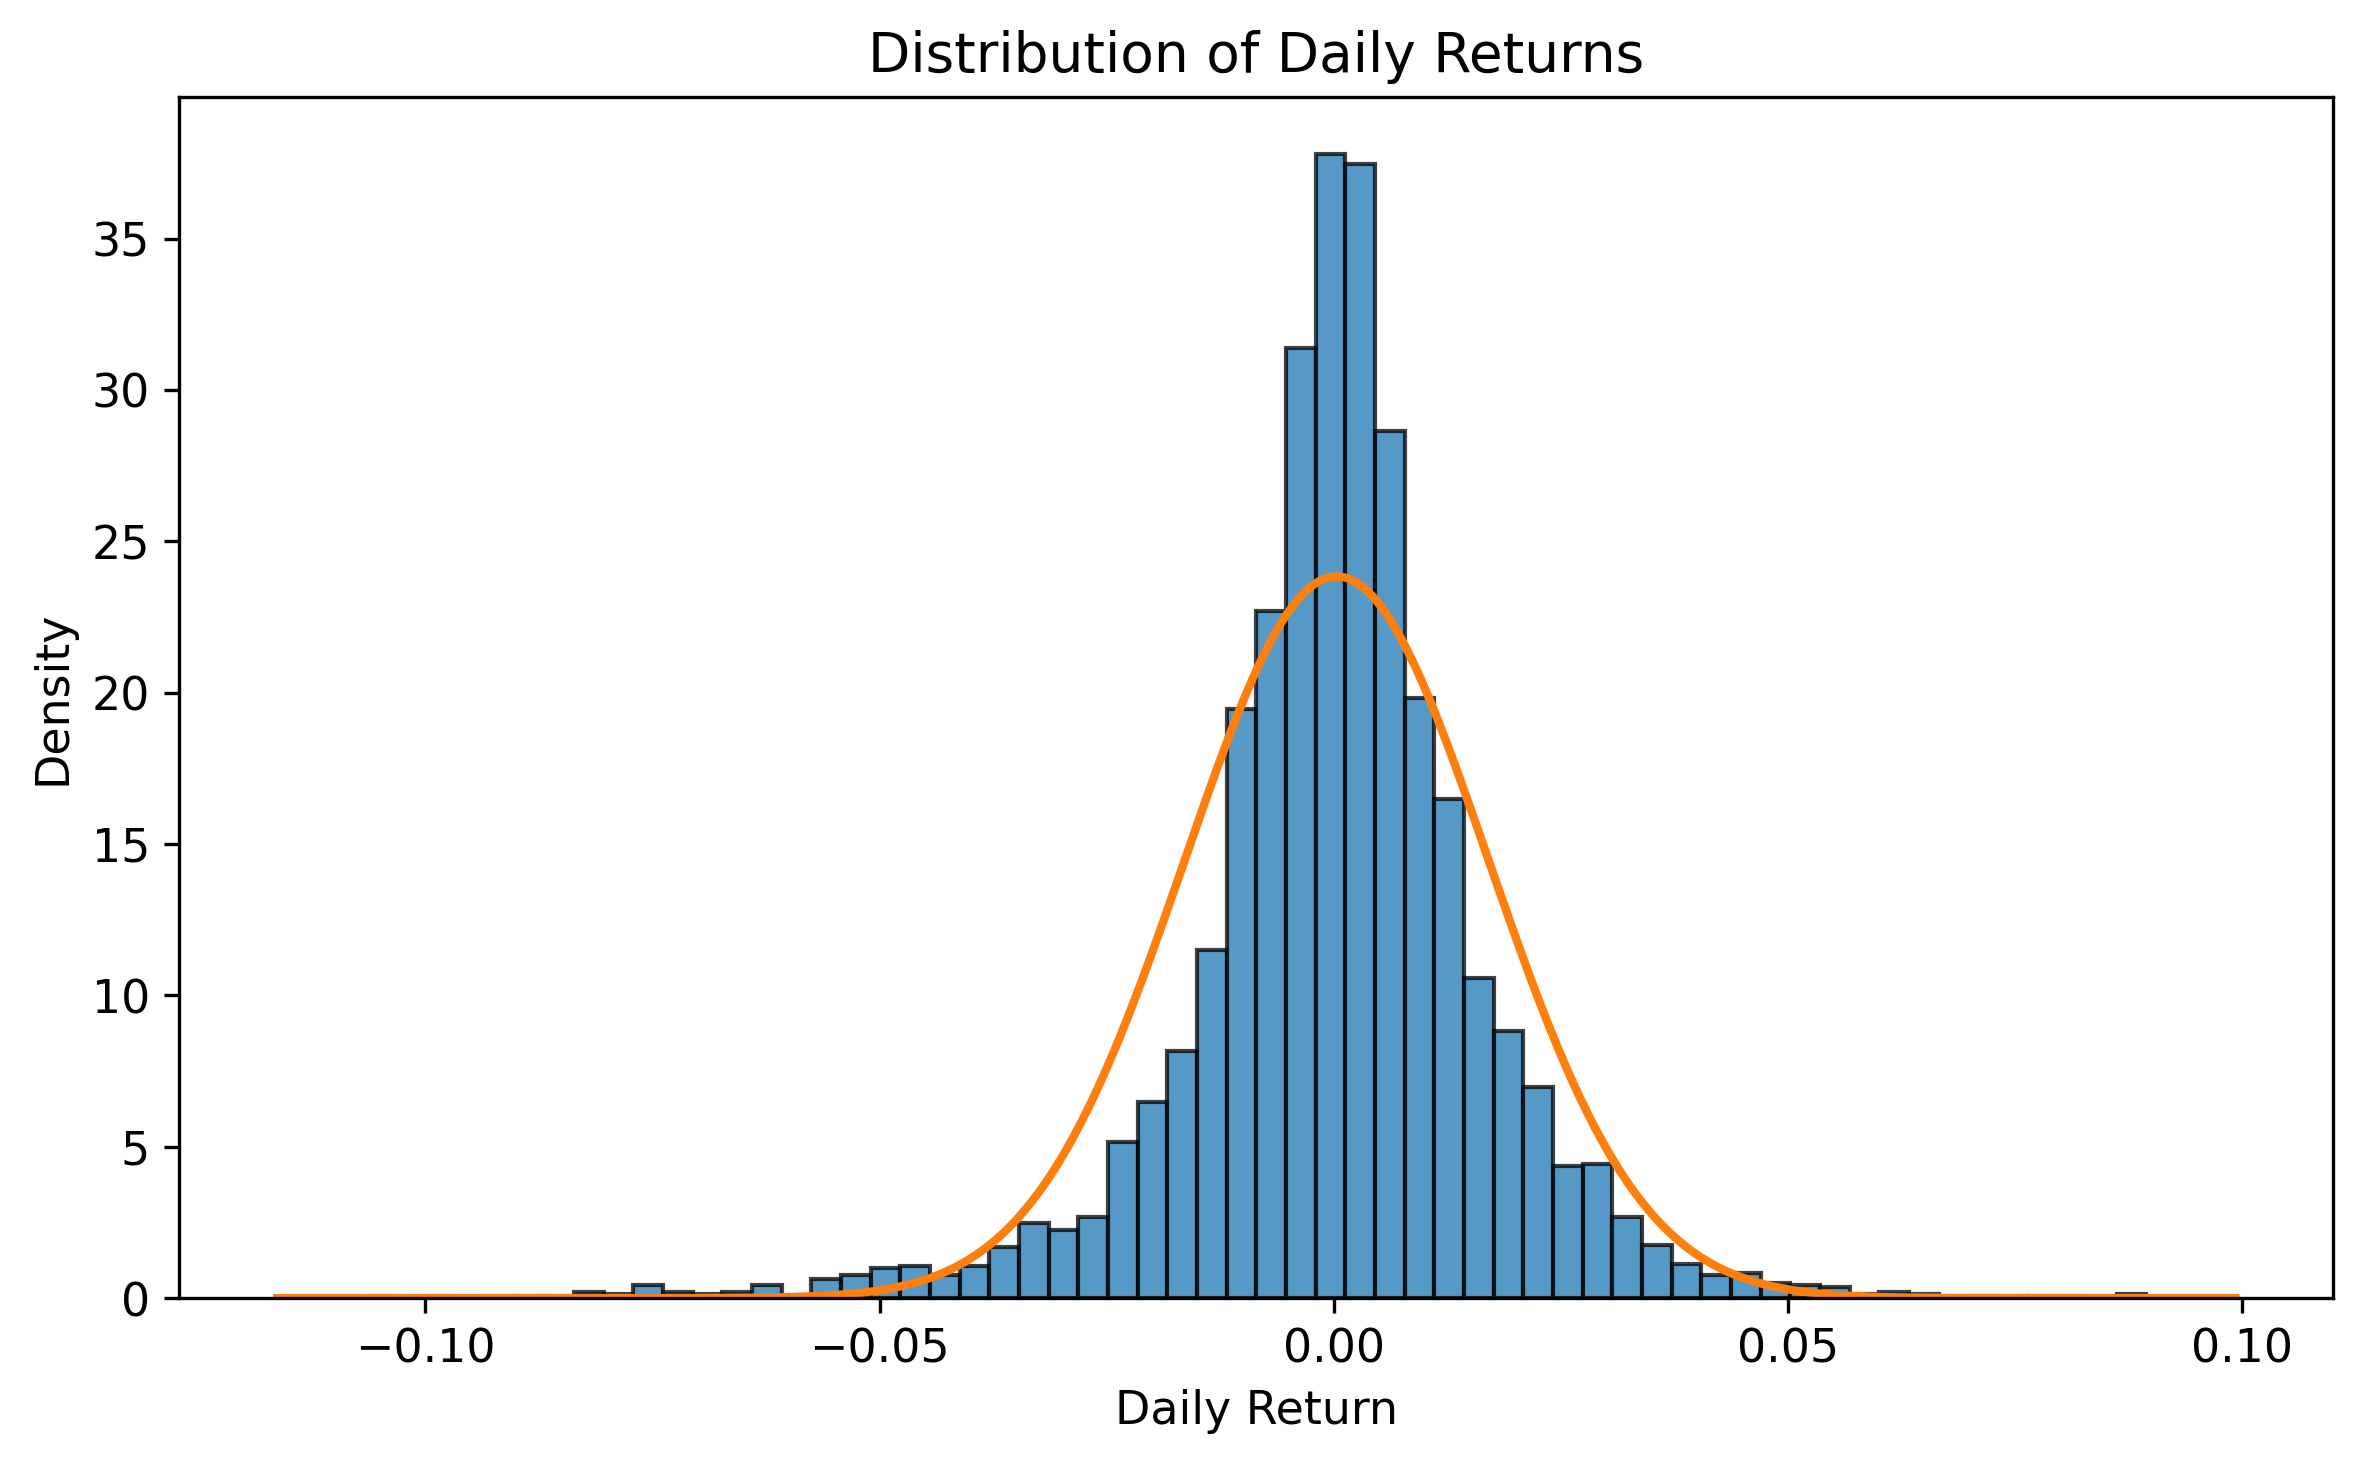
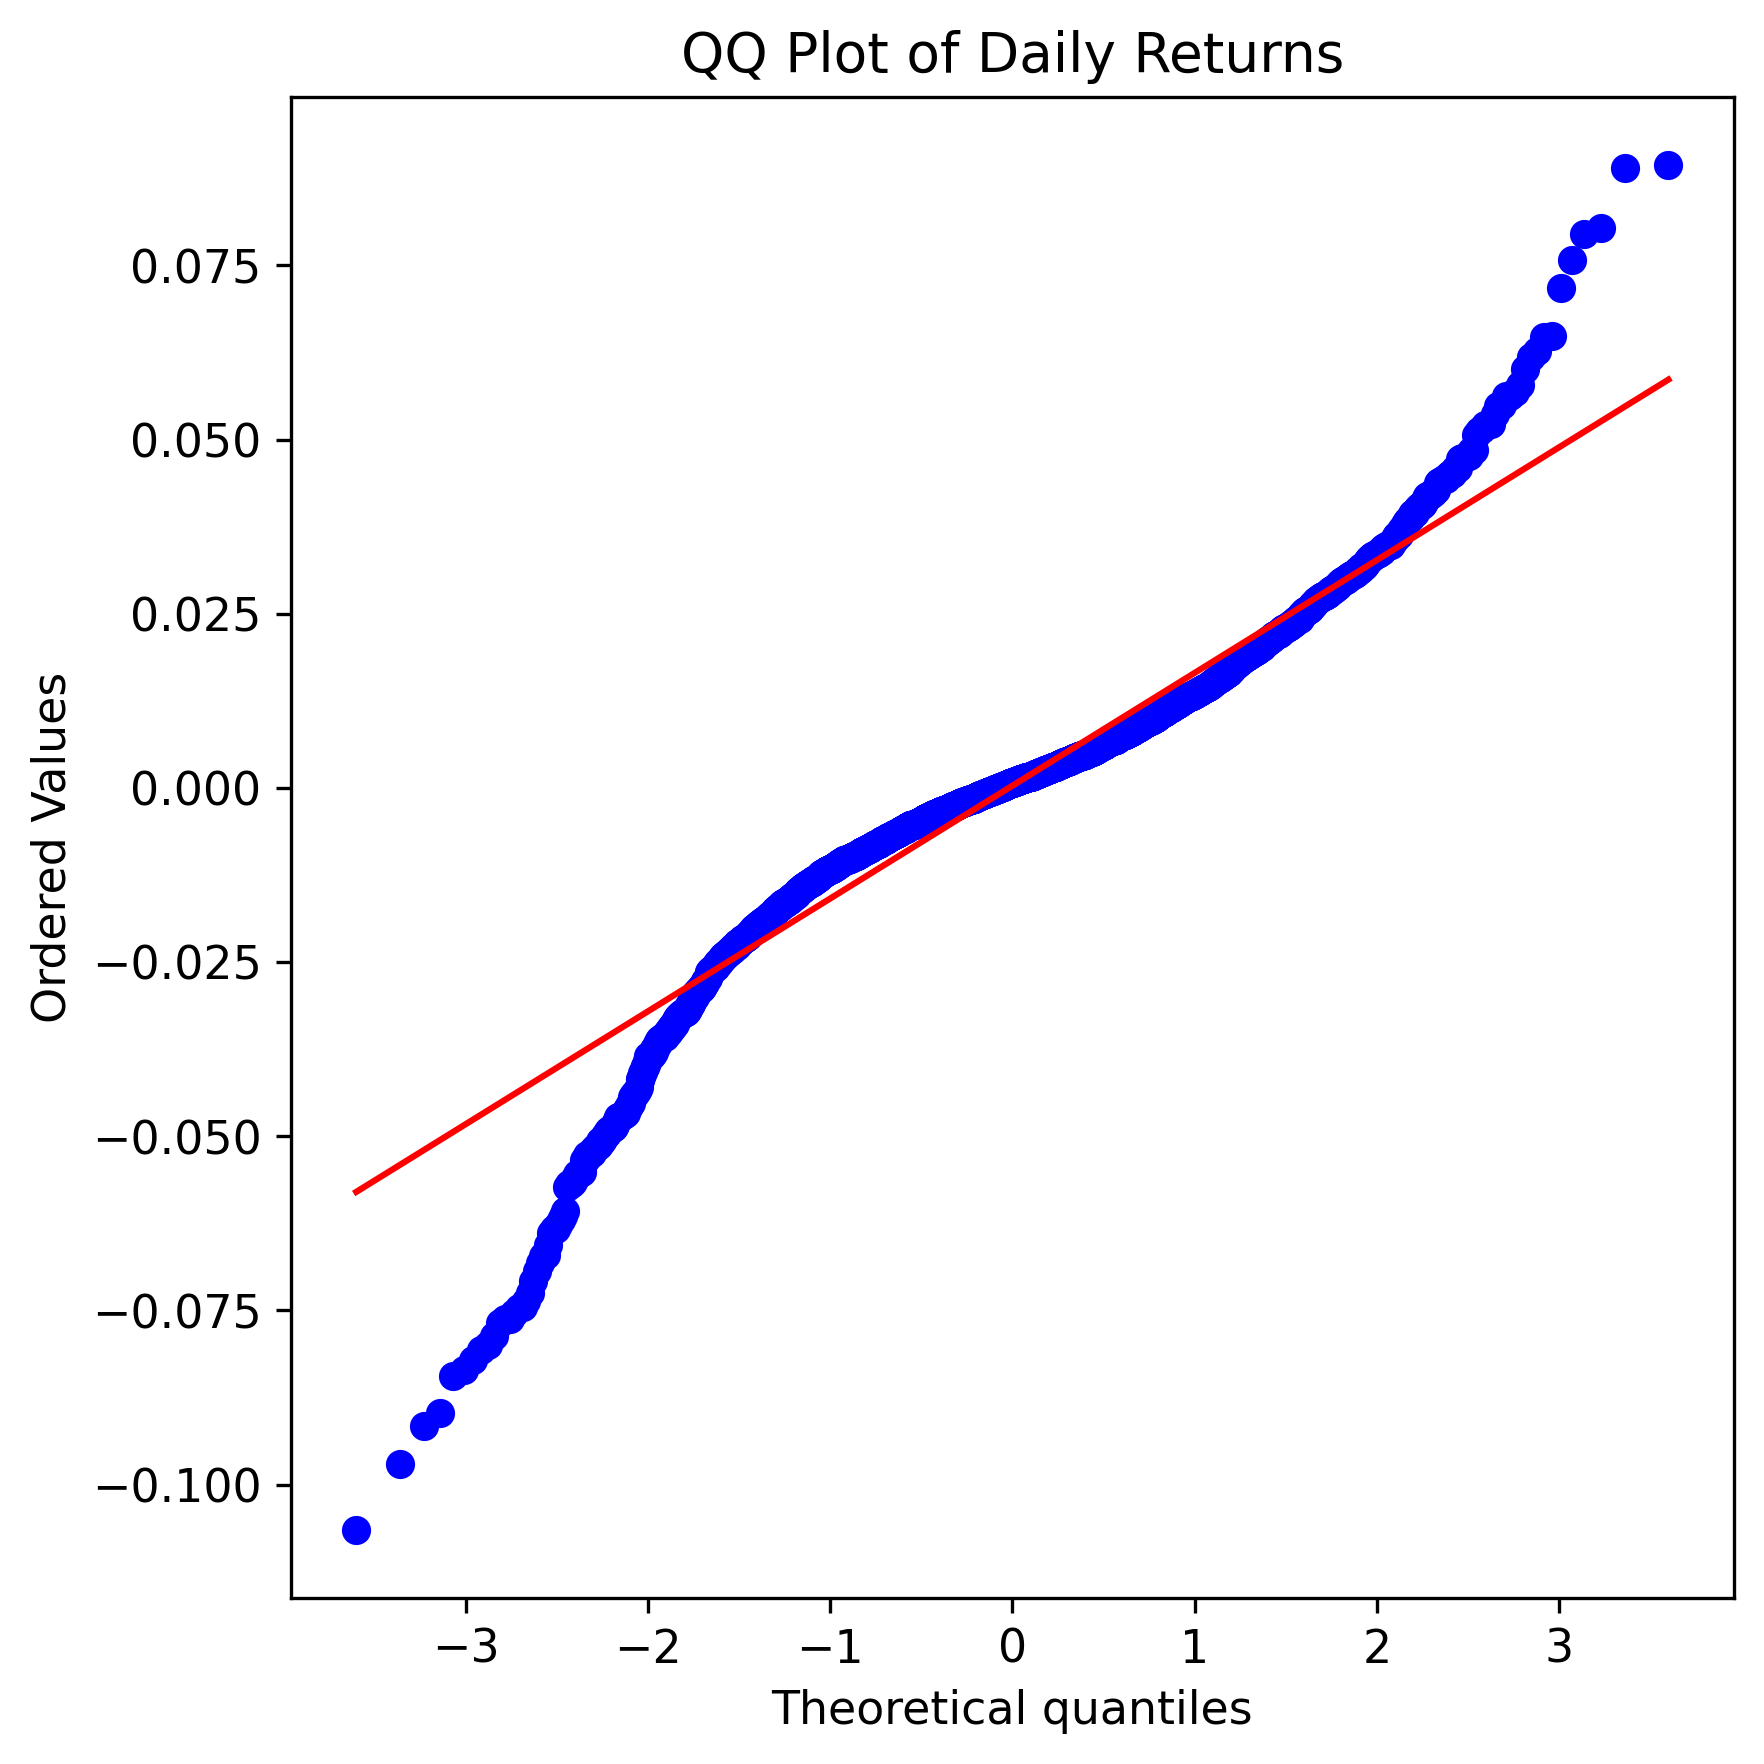
- Jarque--Bera test: A statistical test for normality based on skewness and kurtosis. "JB denotes the Jarque--Bera test statistic for normality."
- Jump variation: The component of realized variability attributed to discontinuous price jumps. "realized quarticity () and jump variation () are constructed"
- Leverage effect: The empirical asymmetry whereby negative returns increase future volatility more than positive returns do. "The indicator term captures the leverage effect"
- Long memory: Persistence in a time series where autocorrelations decay slowly over long lags. "they exhibit strong persistence and long-memory behavior."
- Look-ahead bias: An evaluation flaw that uses future information unavailable at prediction time. "they risk look-ahead bias and unrealistic information sets."
- Low-volatility gating: A strategy design that activates trading signals only in low-volatility regimes to improve robustness. "low-volatility gating"
- Markov-switching framework: A modeling approach where parameters depend on an unobserved state following a Markov process. "The Markov-switching framework"
- Market microstructure noise: Distortions in high-frequency prices due to trading frictions, bid-ask bounce, and discreteness. "market microstructure noise"
- MSGARCH: A framework for Markov-switching GARCH models enabling regime-dependent volatility dynamics. "follows the MSGARCH framework"
- Realized kernel estimators: Noise-robust high-frequency estimators of integrated variance using kernels to mitigate microstructure effects. "realized kernel estimators"
- Realized measures: Volatility estimators from high-frequency returns such as realized variance and quarticity. "high-frequency-based realized measures have become standard tools in modern volatility forecasting."
- Realized quarticity: A high-frequency-based estimator capturing the variability of realized variance (volatility-of-volatility). "realized quarticity is defined as:"
- Realized variance: The sum of intraday squared returns over a day, estimating ex-post price variation. "realized variance uses high-frequency information directly"
- Recursive forecasting schemes: Procedures that update model estimates and forecasts sequentially as new data arrive. "recursive forecasting schemes commonly used in time-series analysis"
- Semivariance: A measure focusing on downside variability (or upside), often used to study asymmetric volatility. "semivariance-based framework"
- Signed-jump: A jump proxy that multiplies jump magnitude by the sign of the daily return to encode direction. "parsimonious signed-jump proxy"
- Smoothed probabilities: State probabilities that condition on the full sample (past and future), used ex post. "Smoothed probabilities are excluded because they condition on future observations and would therefore introduce look-ahead bias."
- Student-t distribution: A heavy-tailed distribution used for modeling fat-tailed innovations in volatility models. "Student- distributions"
- Threshold calibration: Tuning decision thresholds on signals to balance trade frequency and performance. "threshold calibration"
- Time-varying transition probabilities: Regime-switching models where the probability of switching between states changes over time. "Markov-switching HAR model with time-varying transition probabilities"
- Turnover controls: Strategy rules that limit trading frequency or position changes to reduce costs and overtrading. "turnover controls"
- Two-scale realized variance: A noise-robust realized variance estimator combining multiple sampling frequencies. "two-scale realized variance"
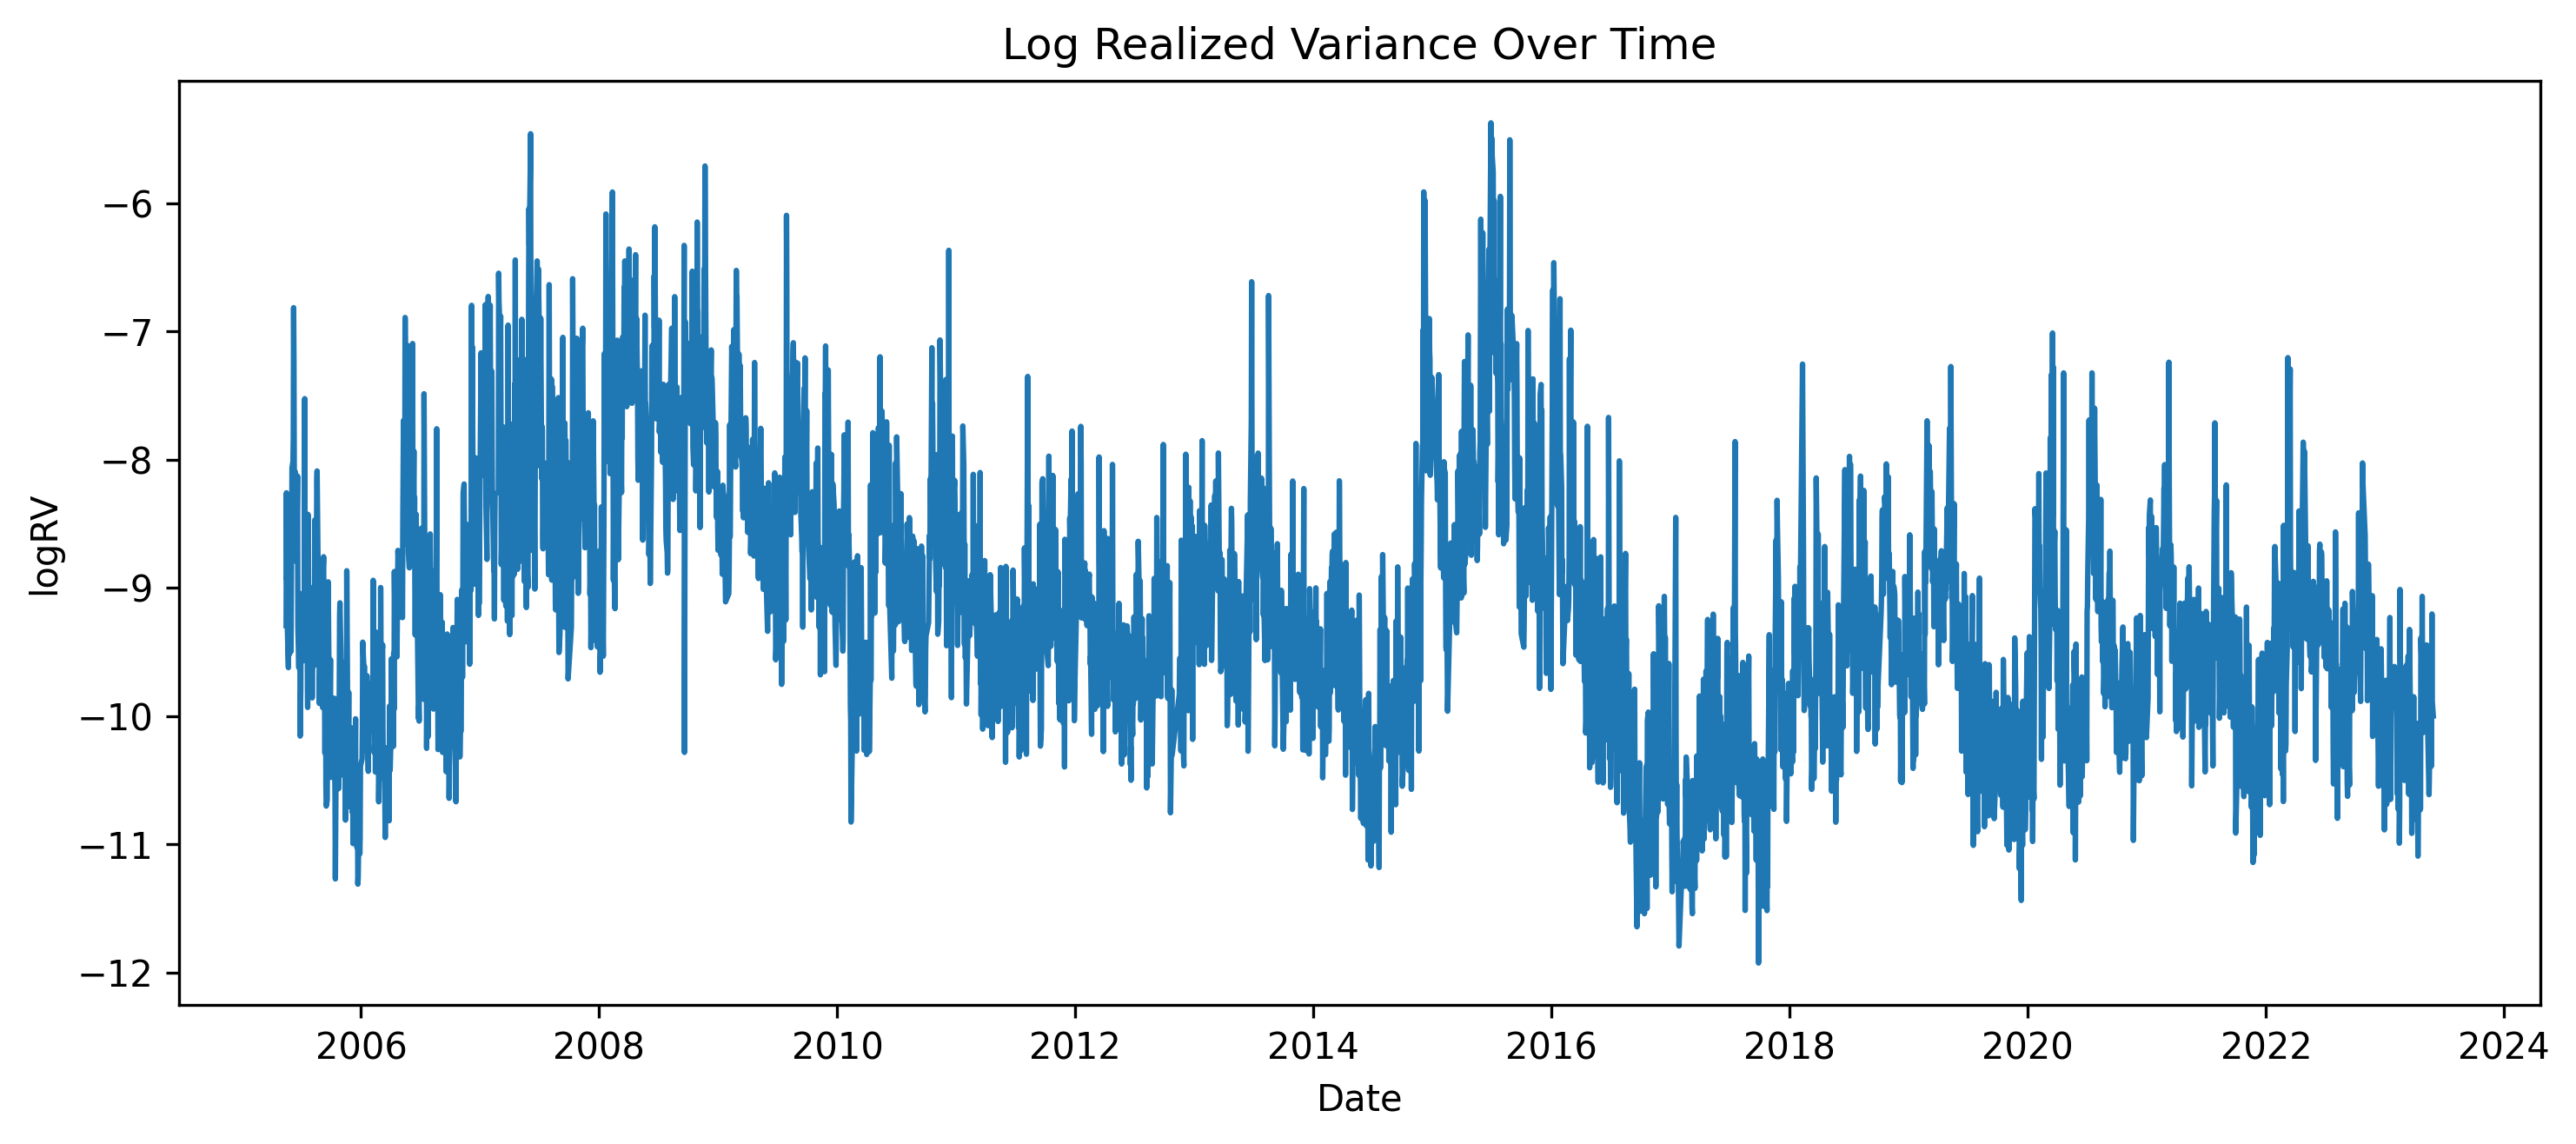
- Volatility clustering: The tendency for high-volatility (low-volatility) periods to follow each other. "highlights volatility clustering."
- Volatility-of-volatility: The variability of volatility itself, often captured via realized quarticity. "capturing time variation in volatility-of-volatility."
- Volatility scaling: Adjusting positions or signals by forecasted volatility to target risk. "volatility scaling"
- Walk-forward validation: A sequential out-of-sample evaluation method that mimics real-time forecasting. "walk-forward validation frameworks are widely used"
- XGBoost: Extreme Gradient Boosting; a tree-ensemble method with regularization for predictive modeling. "Extreme Gradient Boosting (XGBoost)"
Collections
Sign up for free to add this paper to one or more collections.