- The paper introduces a meta-benchmarking framework that maps 288+ models across 452 benchmarks using O*NET work activities and BIAN business domains.
- It employs a four-stage pipeline including benchmark normalization, composite weighting, pairwise Elo scoring, and business domain aggregation for robust model evaluation.
- The framework supports evidence-based model selection and risk management in regulated financial environments while exposing limitations in public benchmark coverage.
Motivation and Context
The proliferation of LLMs has catalyzed advancements in numerous domains; however, evaluating models for deployment in regulated environments such as financial services remains inherently challenging due to the inadequacy of single-score leaderboards and the rapidly evolving benchmark ecosystem. Aggregate scores—typically constructed from broad task suites—rarely reflect the complex, domain-specific capabilities required for applications in banking and finance. This paper addresses the gap by introducing a meta-benchmarking framework for LLM evaluation grounded in industry-standard work activity and business domain taxonomies, with a dynamic, evidence-weighted aggregation scheme designed for ongoing governance and robust model selection.
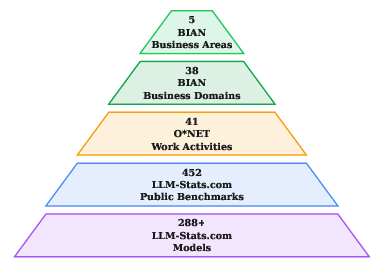
Figure 1: The pyramid structure maps 288+ models across 452 public benchmarks into layers of 41 O*NET work activities and 38 BIAN business domains, grouped under five BIAN Business Areas.
Methodological Framework
The framework comprises a four-stage pipeline: benchmark collection and normalization, computation of composite benchmark weights, pairwise Elo ranking per work activity, and aggregation into business domain profiles.
- Benchmark Collection and Normalization: Scores are sourced from LLM Stats, encompassing 452 benchmarks across a population of 288 models from 25 organizations as of June 2026. The mapping to O*NET and BIAN standards allows for consistent, externally referenced structuring.
- Composite Benchmark Weights: Each benchmark is dynamically weighted by a multiplicative factor reflecting discrimination among front-runners, coverage across recent models, and recency of reported results. This suppresses saturated or niche benchmarks and prioritizes those with maximal evidentiary value.
- Pairwise Elo Scoring: Benchmark results are reframed as pairwise contests between models within each work activity. The benchmark’s composite weight scales the K-factor in the Elo update. This task-level Elo is normalized to a mean of 50 and SD of 10, rendering scores cross-comparable.
- Domain Aggregation: O*NET work activities feed into BIAN business domains via a many-to-many mapping. Domain scores are computed as the (optionally weighted) average of constituent work-activity Elos, providing a directly actionable profile relevant to enterprise deployment and risk assessment.

Figure 2: End-to-end flow: benchmarks are normalized, weighted, transformed into per-work-activity Elo, and aggregated into BIAN business domains.
Benchmark Dynamics and Coverage
The benchmark landscape is heterogeneously populated. Most evidence concentrates in cognitive and analytical activities; physical and strictly managerial tasks remain underrepresented, reflecting the limits of publicly available LLM benchmarks.
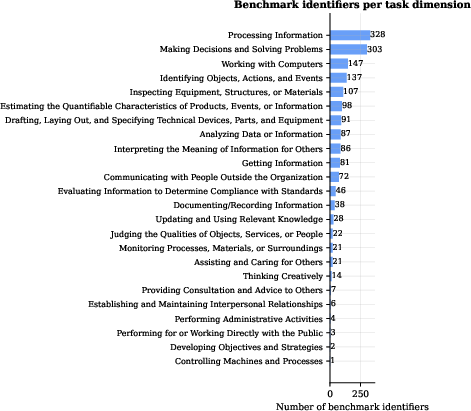
Figure 4: Benchmark coverage per work activity. Information-centric tasks dominate; physical and managerial activities lack public benchmarks.
Crucially, the system addresses benchmark lifecycle management implicitly. As benchmarks saturate, discrimination collapses, and their weights decline. Agentic and dynamically refreshed benchmarks (e.g., LiveCodeBench, SWE-Bench Verified) retain discriminative power beyond legacy tests, maintaining population separation and meaningful ranking.
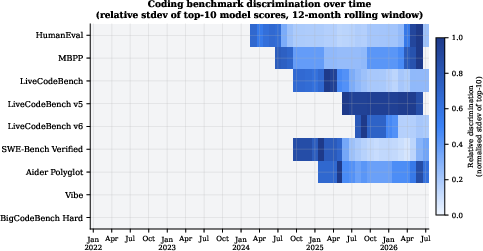
Figure 3: Heat map of benchmark discrimination in coding, 2022–2026. LiveCodeBench and agentic tasks sustain separation post-saturation of HumanEval and MBPP.
Using this framework, the progression of high-watermark model capabilities can be precisely tracked across both open-weight and proprietary lines, in various work activities.
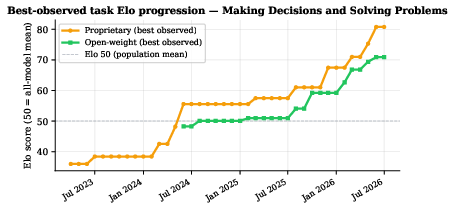
Figure 5: Elo progression for Making Decisions and Solving Problems. The open-weight/proprietary performance gap closes steadily from 2023 through 2026.
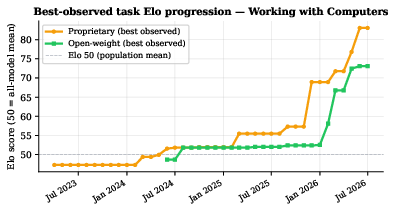
Figure 6: Working with Computers Elo. Large, stepwise improvements correspond to major open-weight releases.
Distribution analysis reveals wide interquartile ranges of model capability within heavily covered tasks, indicating persistent frontier differentiation.
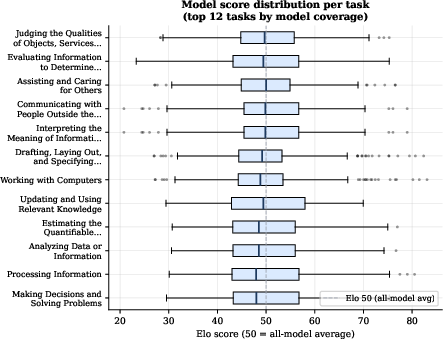
Figure 7: Elo distributions across top-task coverage. Persistent inter-model variance demonstrates benchmark relevance for selection.
Taxonomy Construction and Evidence Mapping
Mapping utilizes O*NET's Generalized Work Activities and BIAN’s business-domain taxonomy. The mapping is many-to-many; as new benchmarks emerge, the configuration can be extended, providing systematic granularity and modularity.
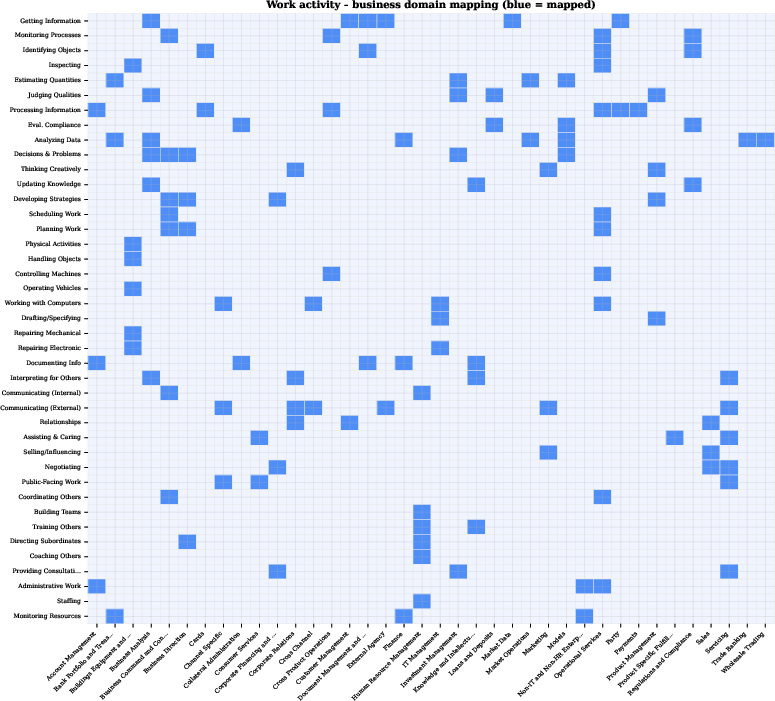
Figure 8: Mapping of work activities to business domains. Densest connections in analytical/information-processing sectors.
Notably, only 24 of 41 O*NET activities are covered in the current snapshot, largely omitting physical and social-interactional tasks—highlighting both the evidence base and residual blind spots.
Validation, Sensitivity, and Practical Ranking
Alternative K-factor (weighting) schemes show strong stability in model ranking, with Spearman ρ values consistently exceeding 0.90, confirming design robustness against weighting formulation variants. Ablation studies demonstrate discrimination dominates rank formation, but coverage and recency add valuable refinement.
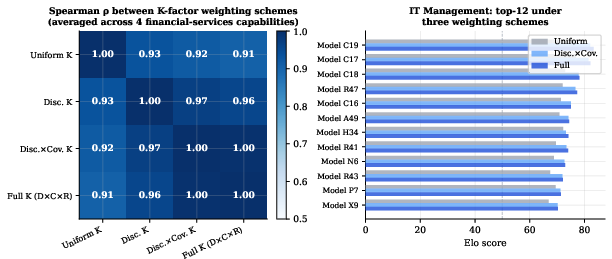
Figure 9: (Left) K-factor sensitivities—correlations >0.90 across schemes. (Right) Top-12 IT Management Elo per scheme; rankings remain largely stable.
Comparison of global composite versus domain-specific ranks reveals large divergences for individual models, underlining the non-transferability of global aggregates to regulated domain deployment contexts.
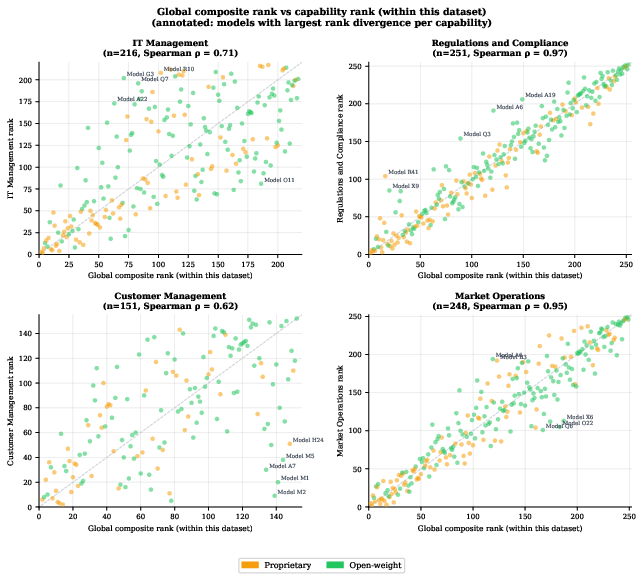
Figure 10: Global composite versus domain Elo ranks for four key BIAN domains. Significant model-specific divergences are visible.
Model evidence density is uneven: domains with heavy coding/general-reasoning input have strong evidence, while specialist regulatory and financial domains are sparse—underscoring the framework’s relative and absolute evidentiary limitations.
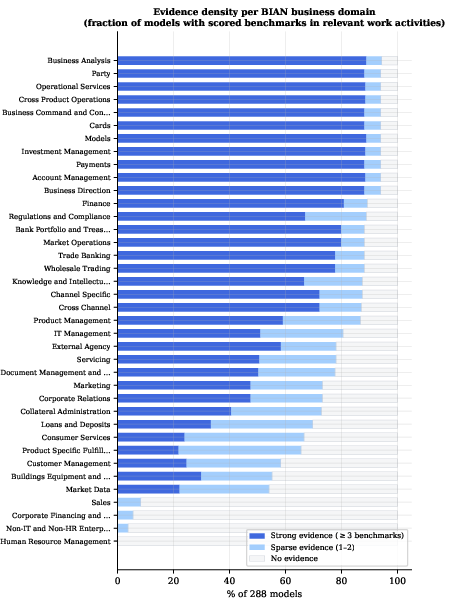
Figure 11: Model evidence density by business domain. Regulatory and financial compliance domains exhibit sparse coverage.
Business domain rankings for leading models further demonstrate substantial variability and the competitive performance of open-weight models in specific domains.
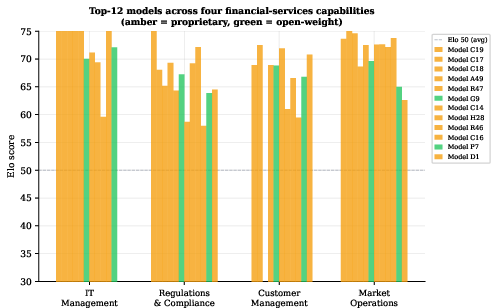
Figure 12: Top-12 model ranks for four business domains. Open-weight models are competitive or leading in several domains, arguing for domain-specific screening.
Applications and Limitations
This meta-benchmarking approach serves several key governance and operational objectives for regulated financial institutions:
- Model Selection: Enables evidence-based shortlisting before institution-specific evaluation, reducing API/GPU cost and cyber-onboarding overhead.
- Procurement Support: Provides a standardized, cross-provider comparison at the business-domain level, surfacing specific areas for targeted evaluation.
- Concentration Risk Management: Quantifies the risk of dependency on individual providers/models for domain-critical capabilities, informing fallback planning.
- Governance and Frontier Tracking: Supports quantitative, threshold-driven re-evaluation as new public data surfaces, reducing ad-hoc governance overhead.
Framework assumptions include the exclusive use of public, often self-reported benchmark results, reliance on externally maintained taxonomies, strict handling of missing data, and dynamic (re-)calculation of scores with each data addition. Domains with thin evidence—especially in compliance/regulatory work—should be treated as low-confidence, demanding internal validation for critical applications. The approach exposes the limitations of public benchmark coverage in regulated business domains and the risk of composite scores masking subdomain-specific deficiencies.
Conclusion
This meta-benchmarking framework operationalizes a structured, reproducible methodology for evaluating LLMs in enterprise-regulated contexts. By systematically mapping public benchmarks onto established taxonomies and dynamically weighting based on discrimination, coverage, and recency, it delivers evidence-driven domain capability profiles practical for model selection, procurement, concentration-risk quantification, and governance. This approach is extensible, auditable, and standardized, and identifies both current strengths of open- and closed-weight models and persistent gaps in public benchmarking—particularly for specialized, regulated tasks. Future work may focus on integrating cost and efficiency metrics into the aggregation, expanding coverage of physical/social-interaction activities, and refining mappings as the benchmark ecosystem evolves.

