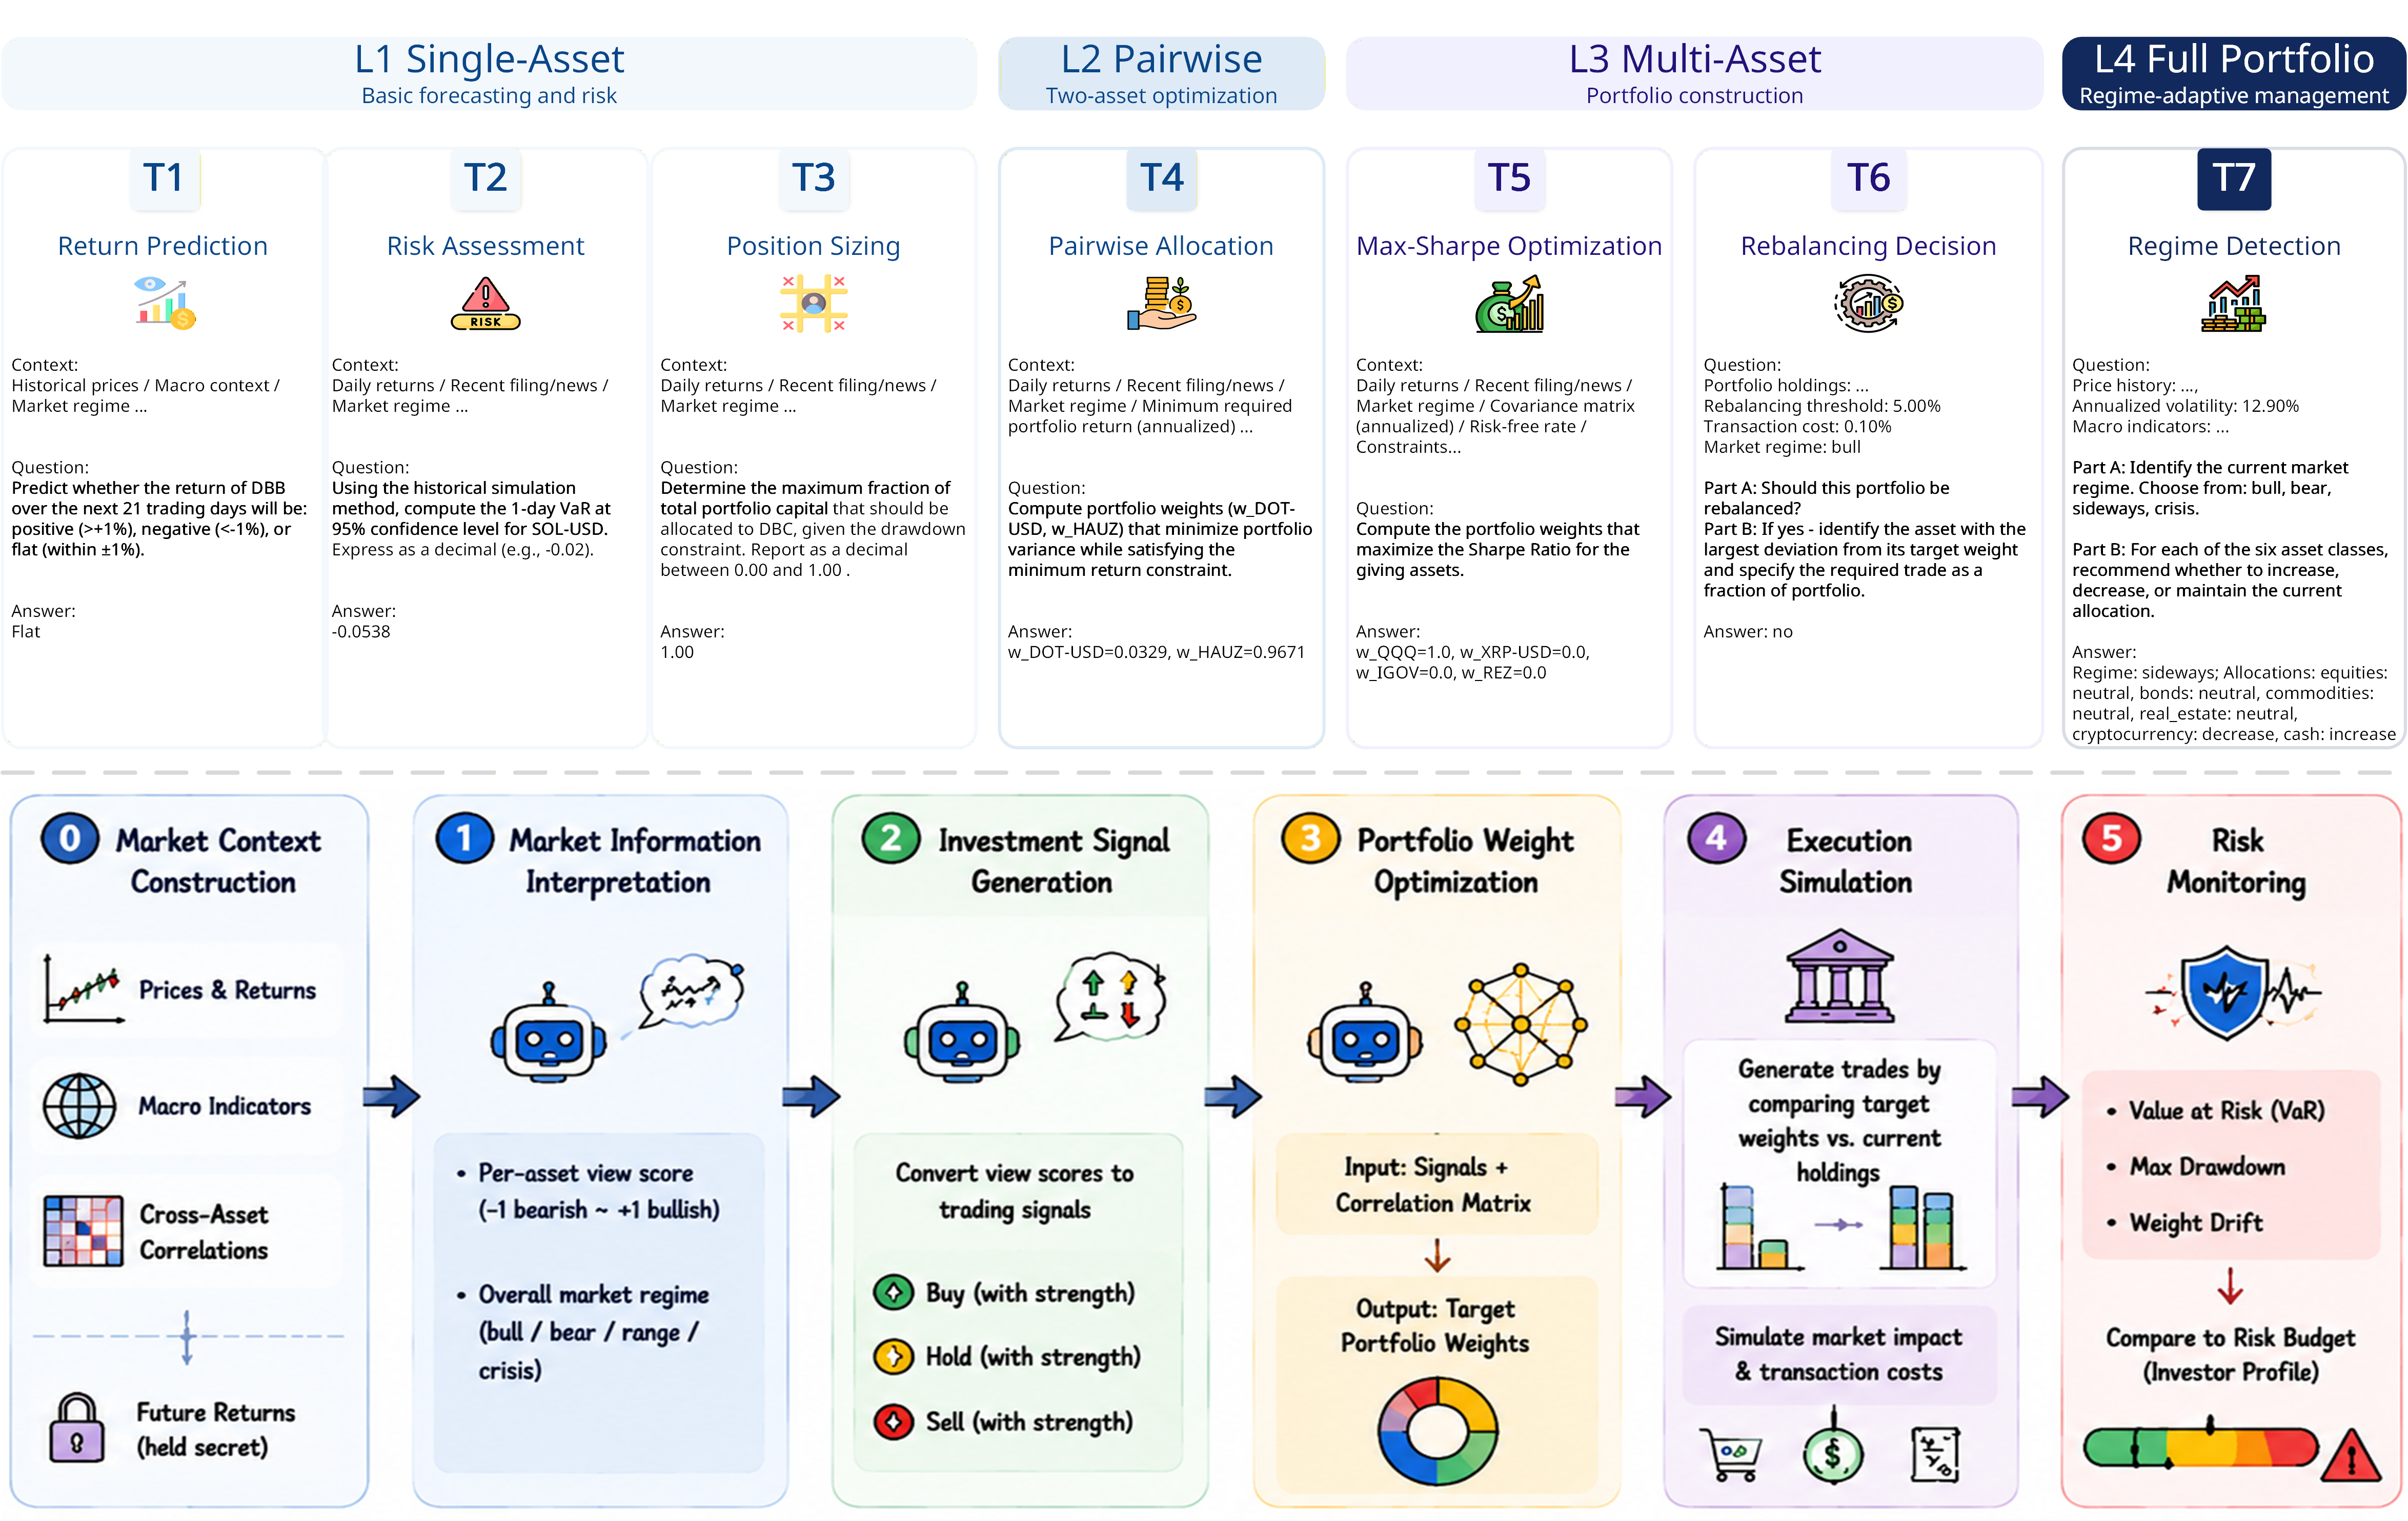
- The paper introduces PortBench, a benchmark combining static QA and a dynamic five-stage pipeline that addresses cross-asset correlations and investor profile adaptation.
- It employs novel metrics such as two-layer correlation scoring and Cross-Stage Error Propagation Score to reveal LLMs' strengths in formula-based tasks and weaknesses in dynamic allocation.
- The study underscores the gap between static factual reasoning and dynamic portfolio execution under stress regimes, highlighting the need for more robust, adaptive financial models.
PortBench: A Correlation-Aware Benchmark for LLM-Driven Portfolio Management
Motivation and Benchmark Scope
The landscape of LLM-based financial evaluation has expanded rapidly, yet portfolio management (PM) remains substantially underexplored due to the lack of comprehensive benchmarking methodologies. Existing frameworks typically focus on single-asset-class allocation, neglect cross-asset correlation, and do not address the sequential, multi-stage pipeline intrinsic to real-world PM. Furthermore, they insufficiently test robustness under stress regimes and fail to assess the ability of LLMs to adapt portfolio strategies to diverse investor risk profiles.
PortBench directly addresses these gaps by providing a rigorously constructed benchmark covering six heterogeneous asset classes over a decade-long time horizon. It simultaneously evaluates LLMs on both static correlation-based financial QA and dynamic pipeline execution, embedding correlation structure in scoring and exposing model reliability under historical stress regimes and three distinct investor risk profiles.
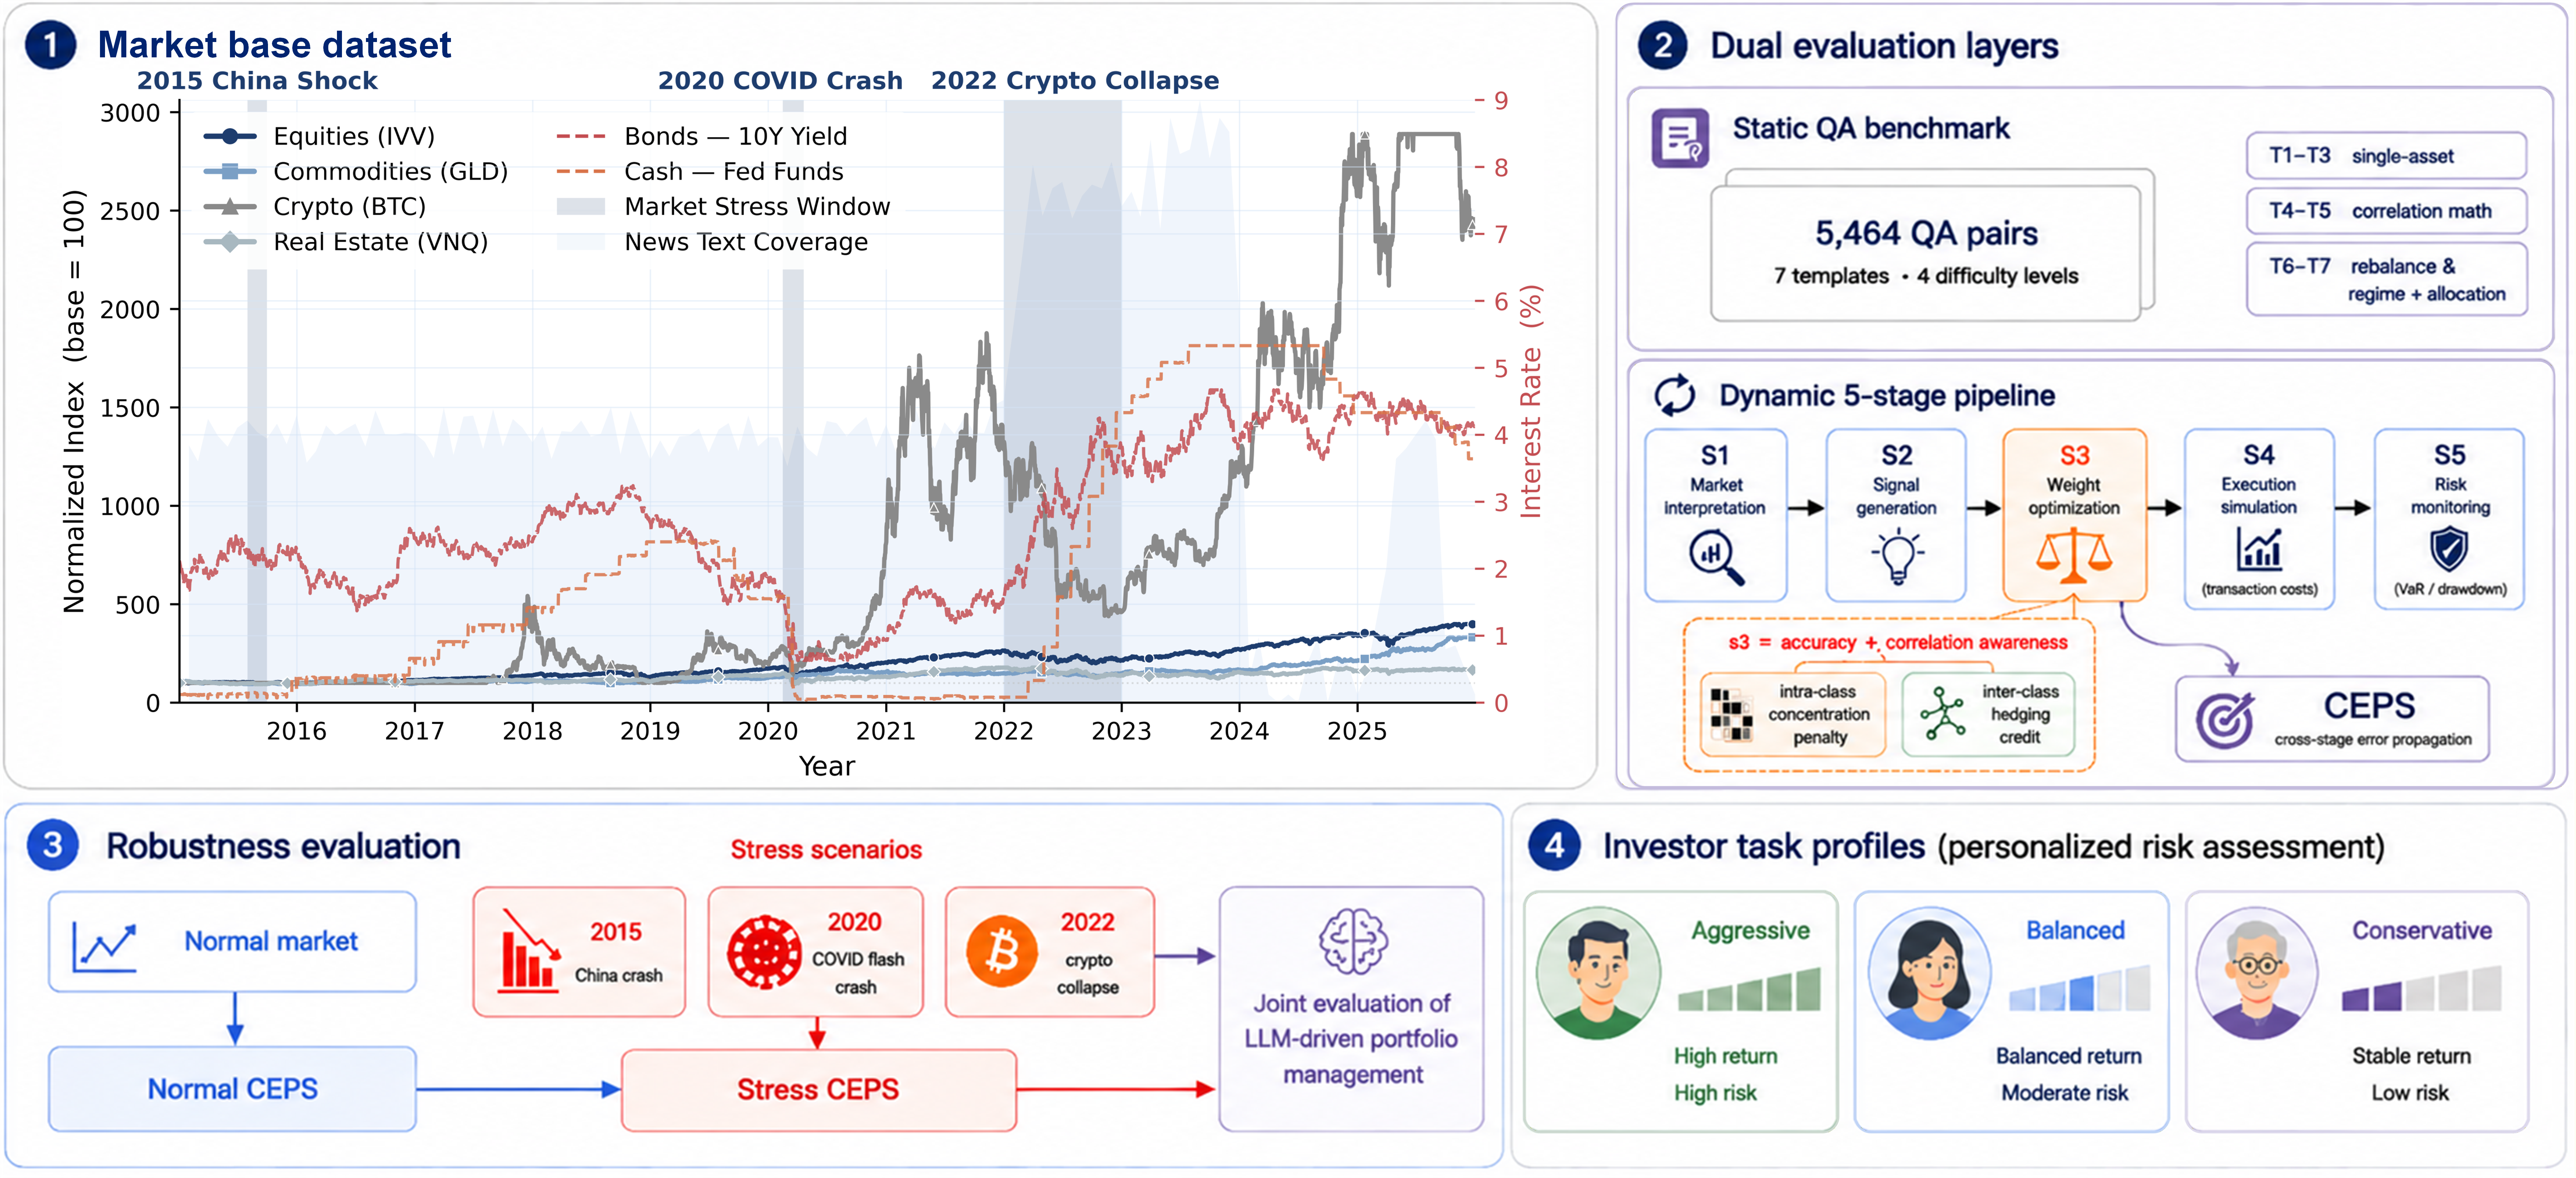
Figure 1: PortBench architecture, delineating market data, dual evaluation, robustness, and investor profile adaptation.
Benchmark Construction and Evaluation Framework
PortBench consists of two integrated evaluation layers:
Key metrics include:
- Two-Layer Correlation Scoring: S3 portfolio allocation is scored jointly for distance to the oracle max-Sharpe solution and for exploiting inter-class hedging and minimizing intra-class concentration.
- Cross-Stage Error Propagation Score (CEPS): Captures cascading degradation as errors compound across pipeline stages rather than averaging isolated steps.
Stress regime evaluation leverages the 2015 China Shock, 2020 COVID Crash, and 2022 Crypto Collapse, purposely injecting elevated cross-asset correlations, while investor profile adaptation is probed via three risk-constrained allocation templates.
Market Data and Correlation Structure
PortBench's market dataset comprises 183 financial instruments—equities, commodities, bonds, cryptocurrency, real estate, and cash—spanning 2015–2025. Extensive within-class diversity and sharply contrasting intra/inter-class correlations define the challenge.
- Intra-Class: Strongly positive correlations—e.g., equities (0.48), real estate (0.77).
- Inter-Class: Low or near-zero correlations, reinforcing the necessity for cross-class diversification.
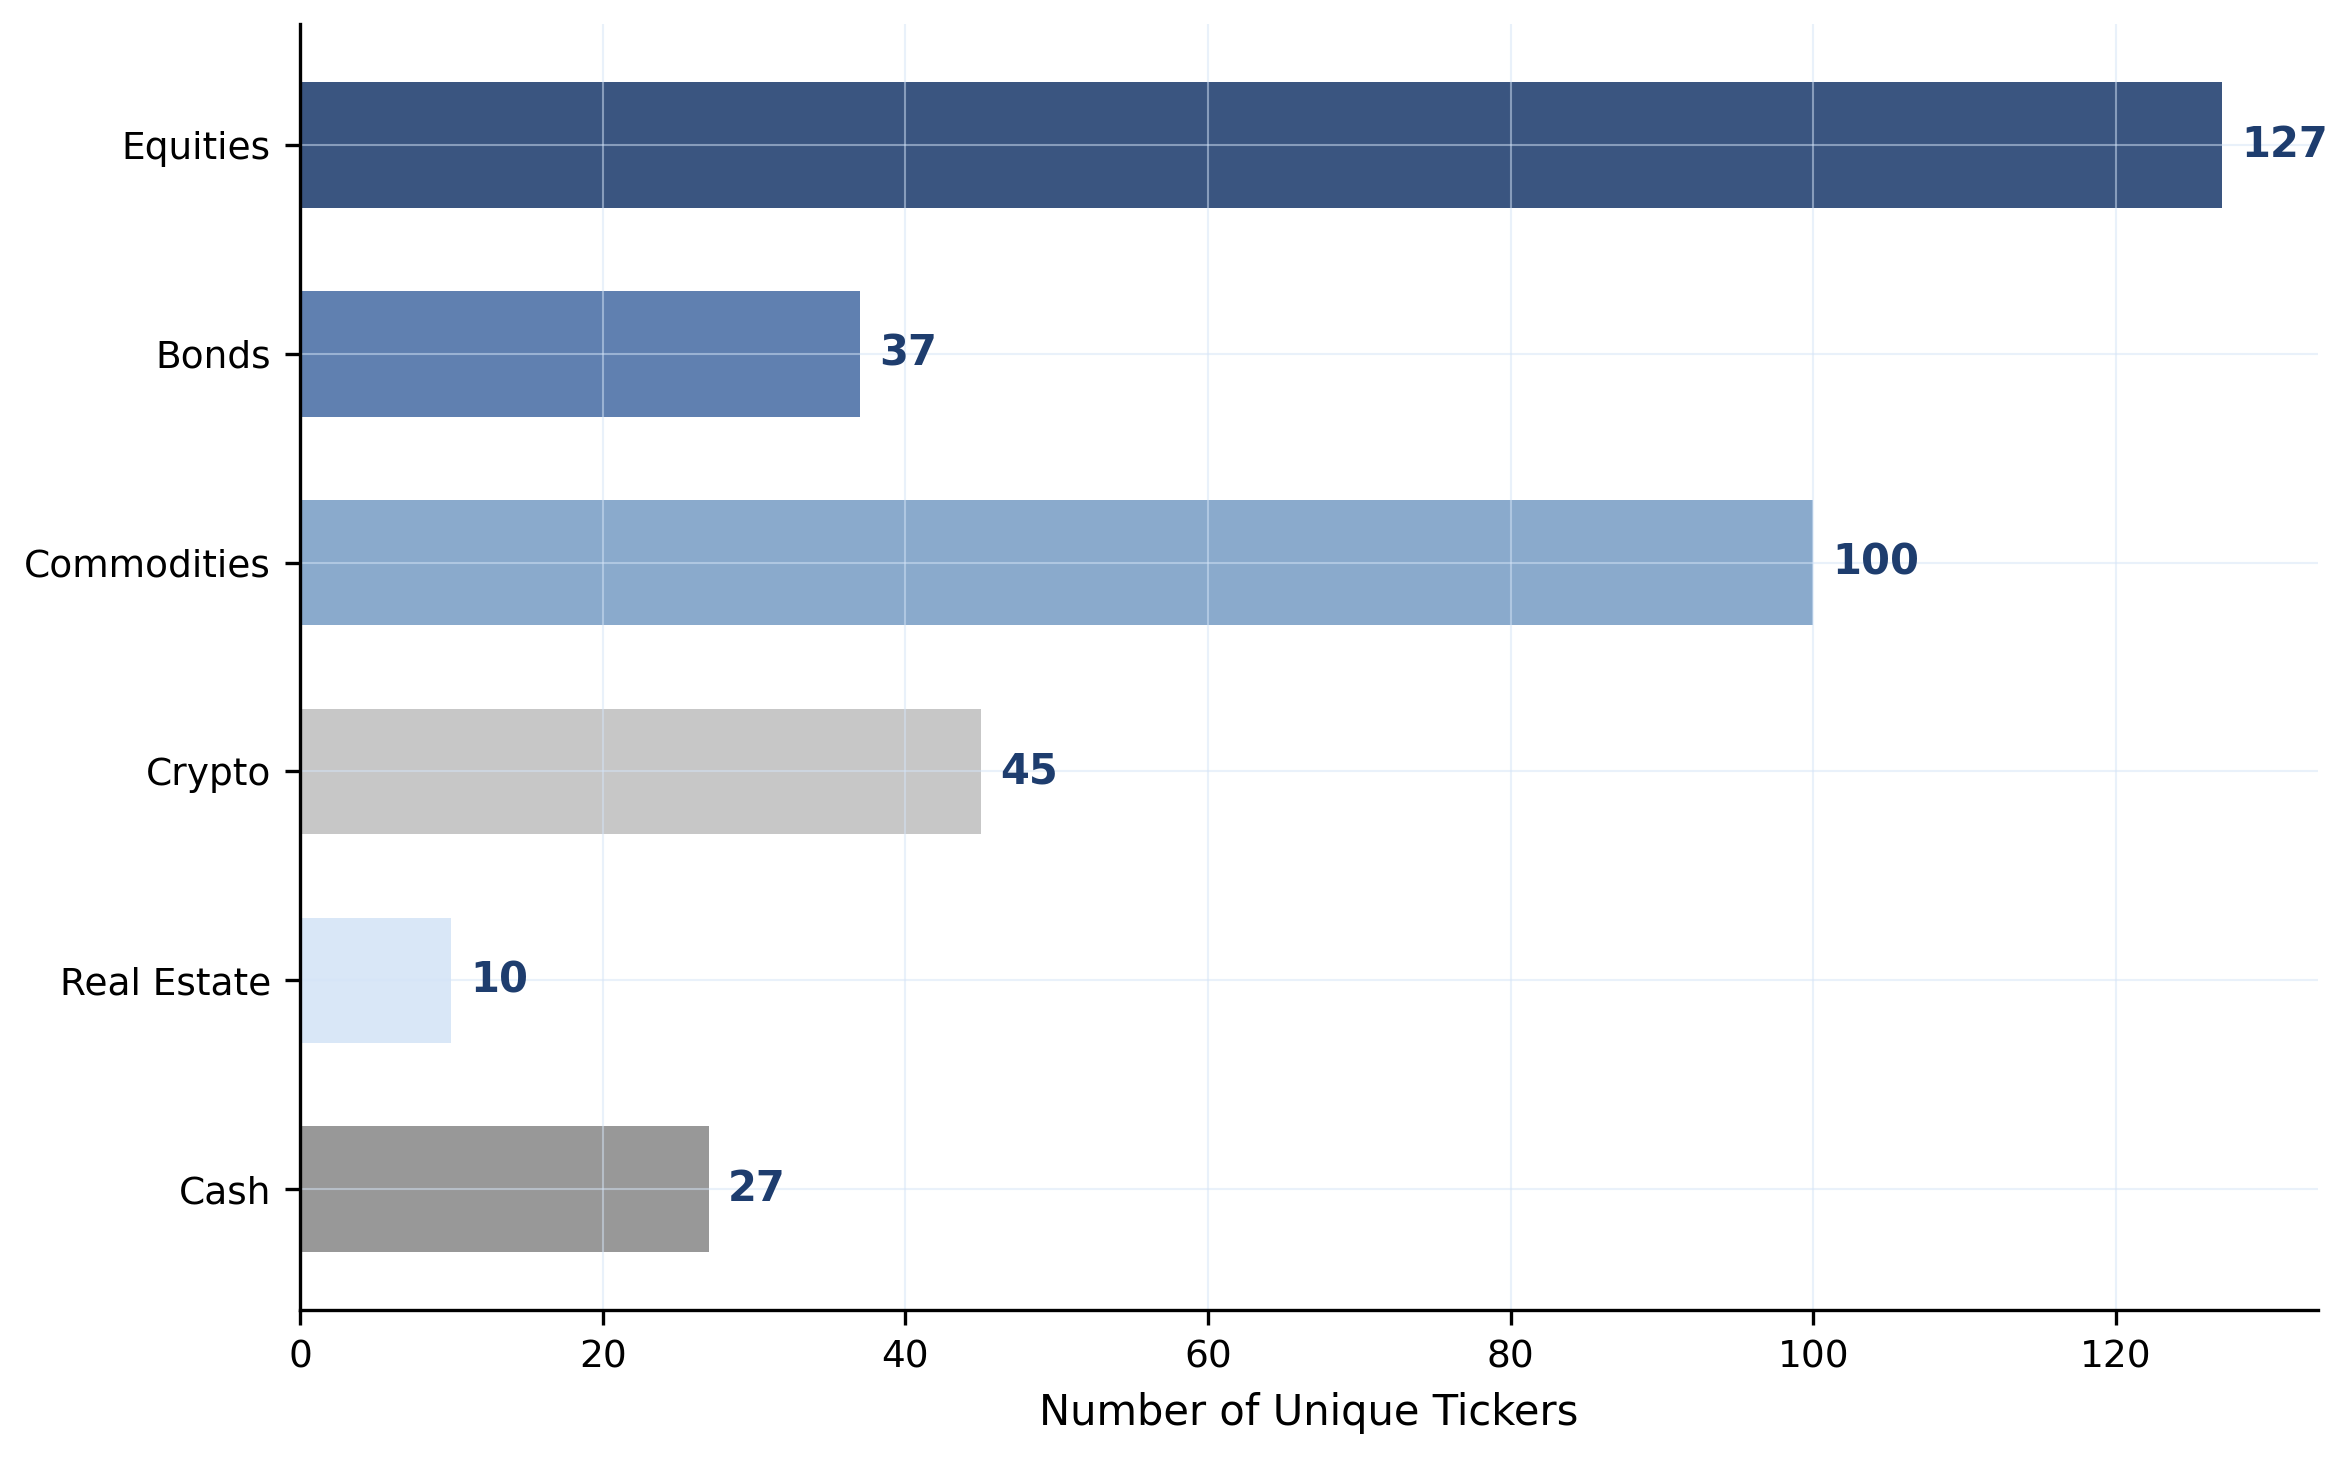
Figure 3: Asset class diversity: instrument counts per class.
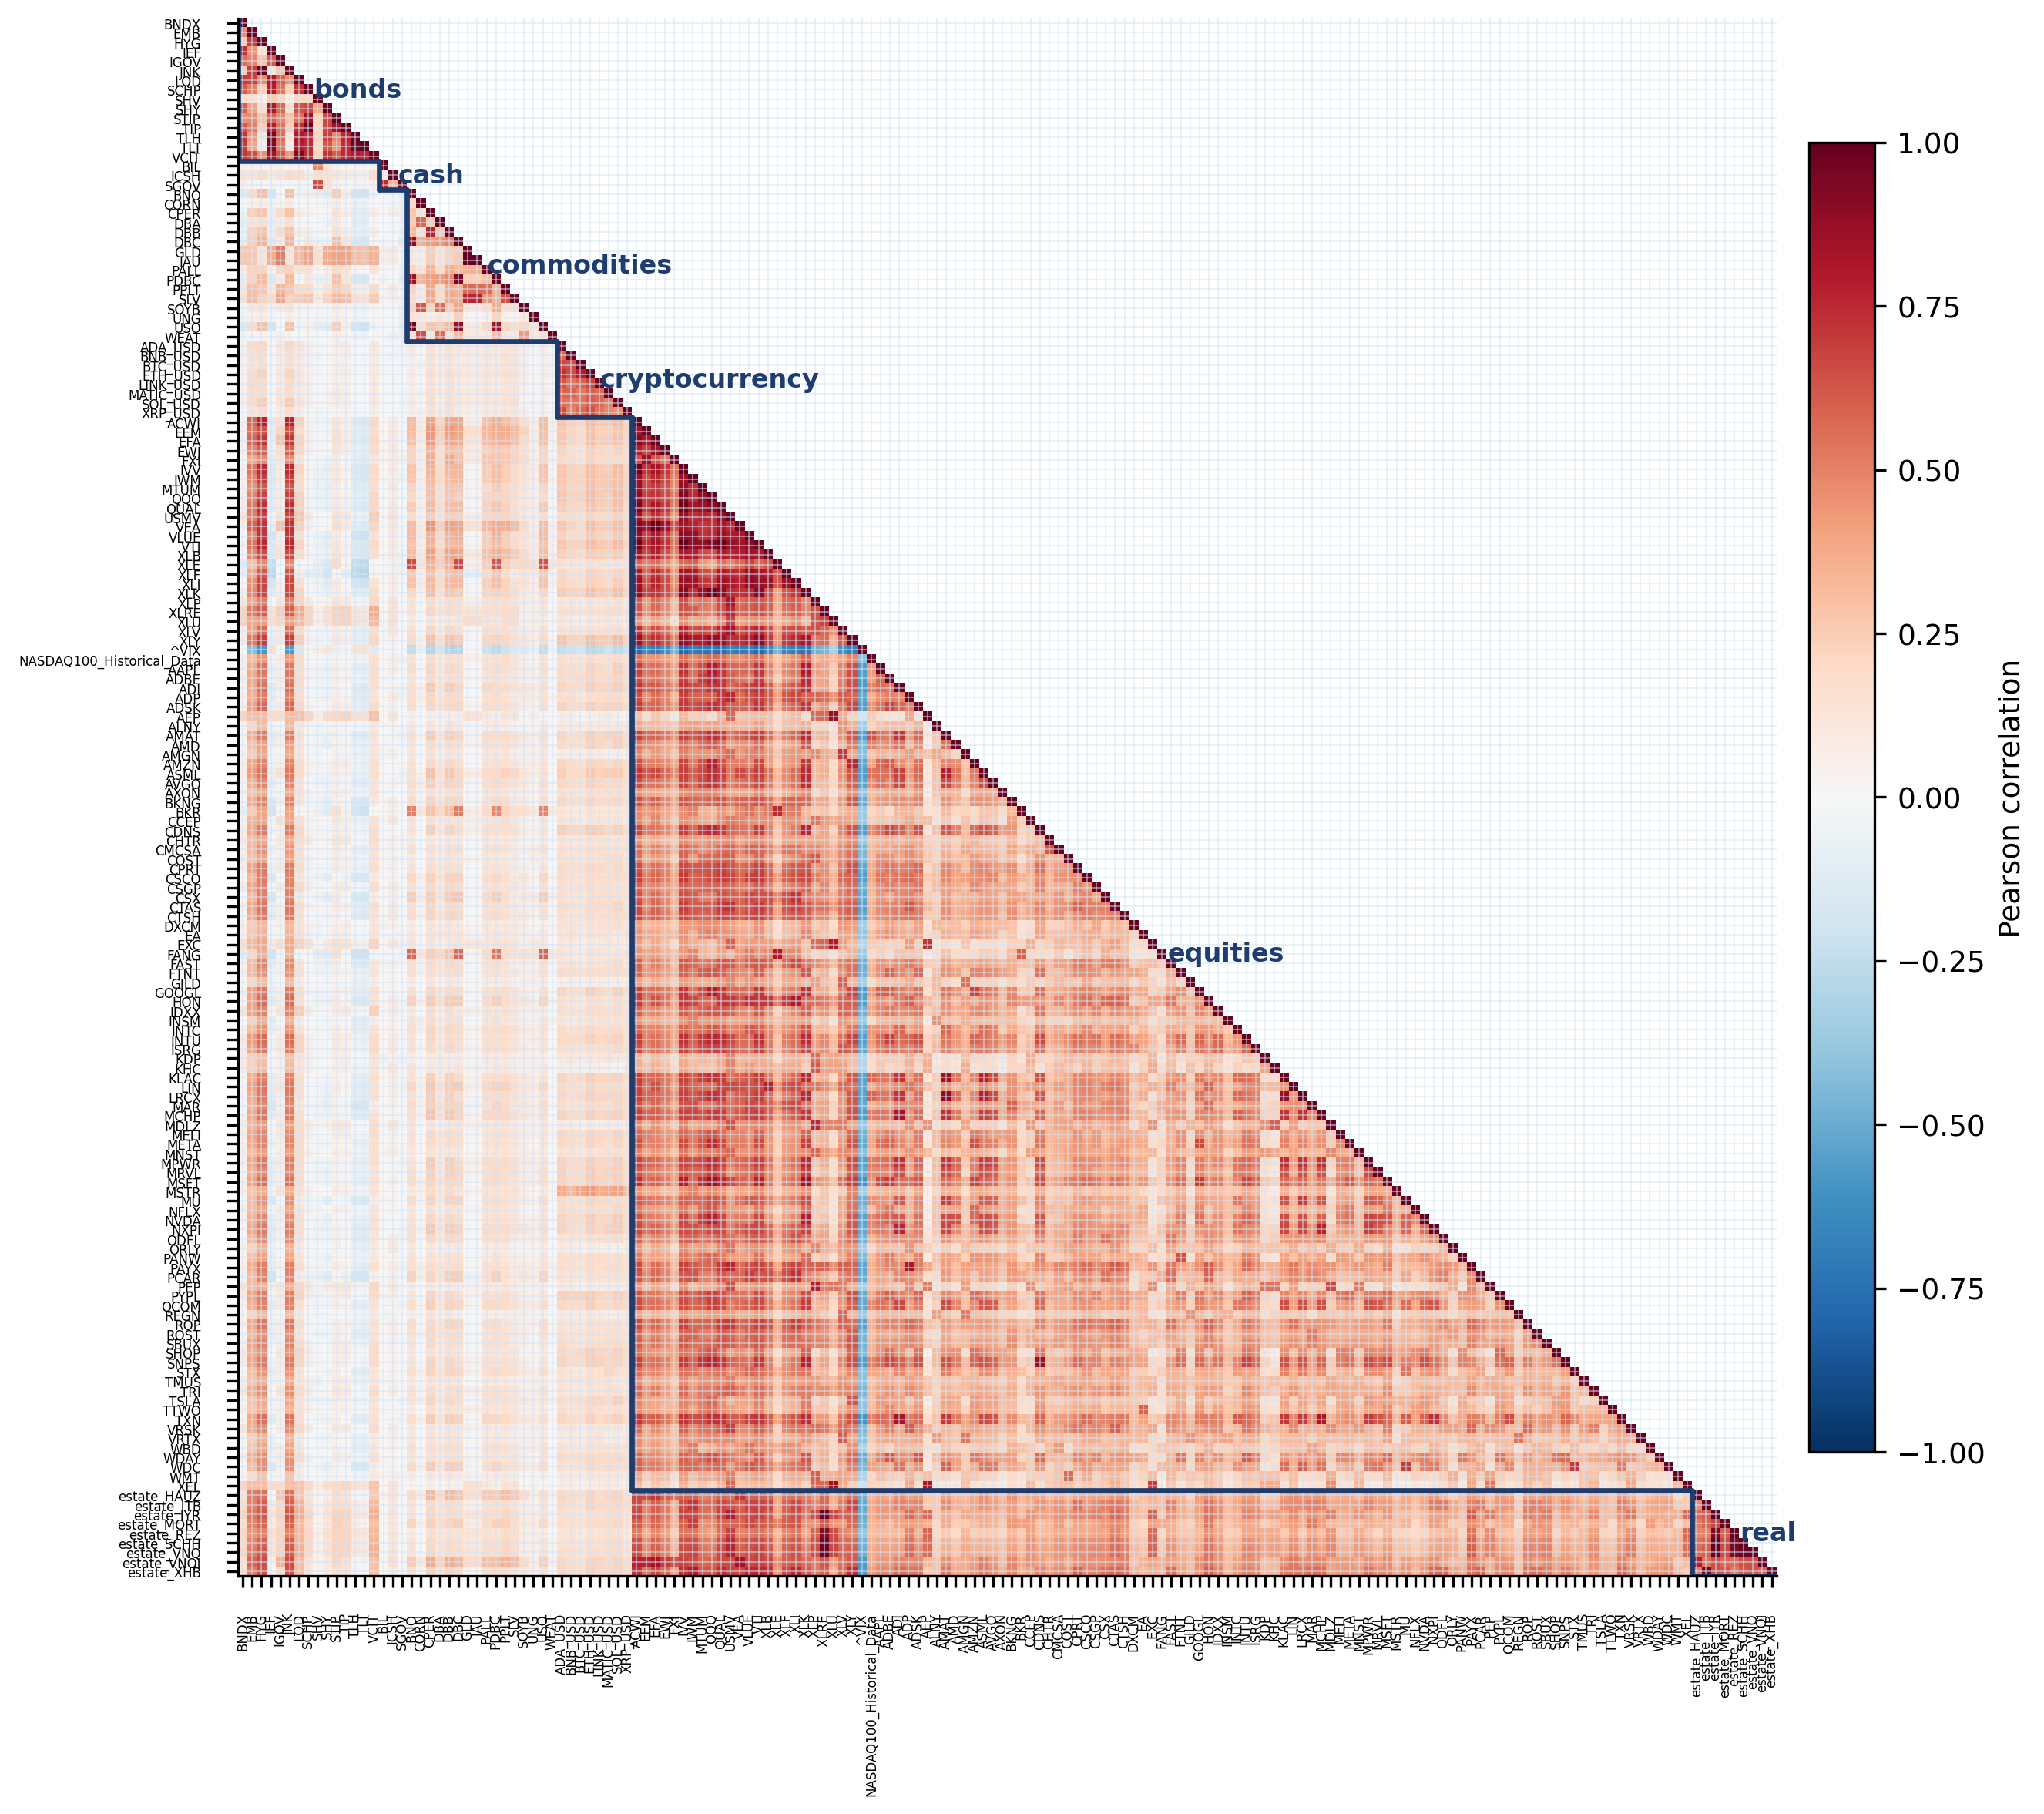
Figure 4: Pairwise Pearson correlation heatmap over all asset classes.
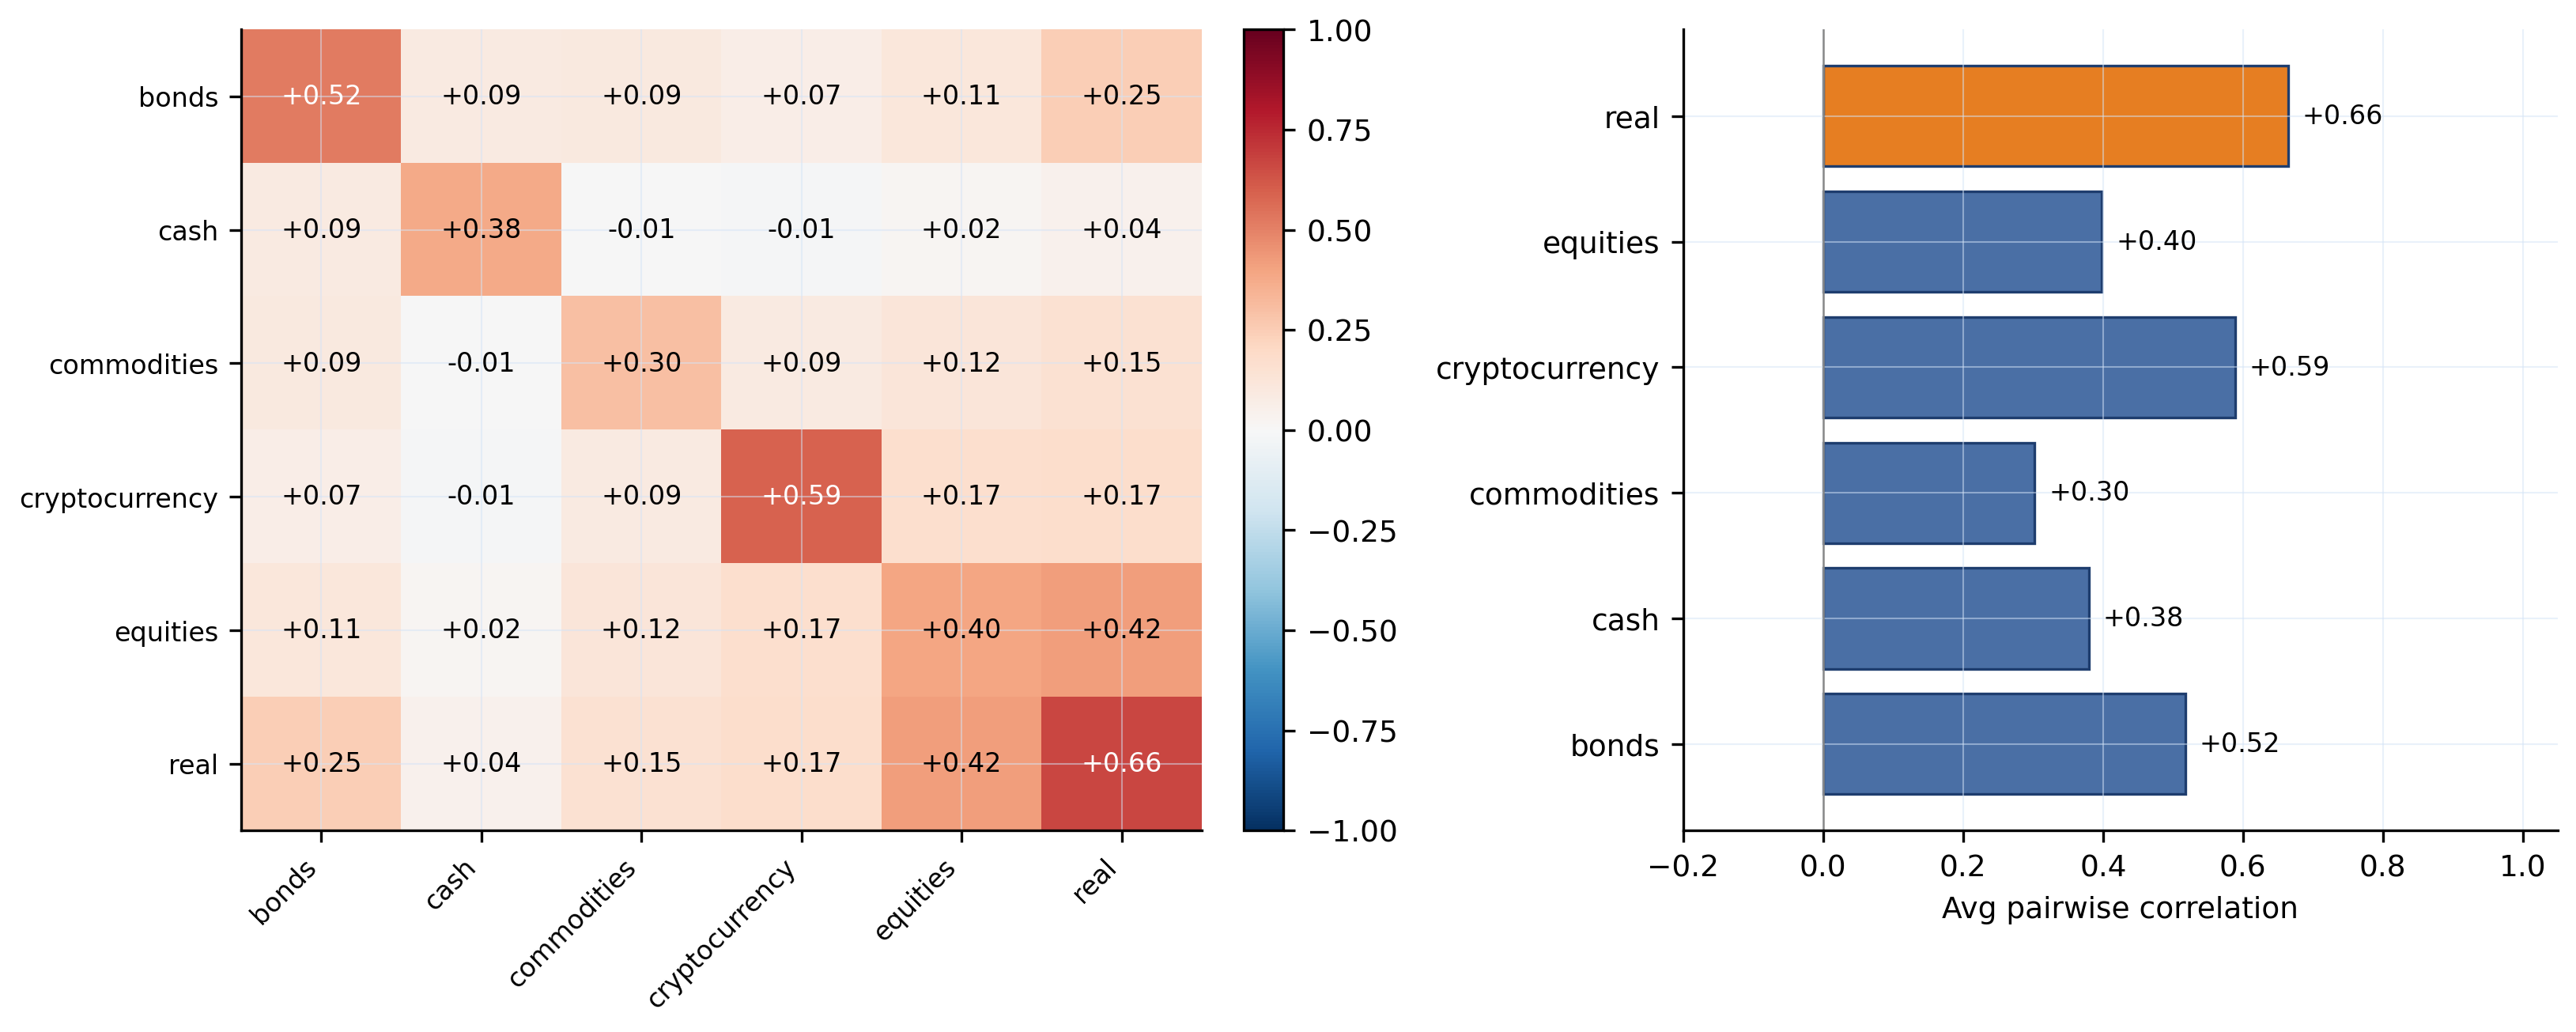
Figure 5: Mean inter-class correlation per asset class; confirms true risk reduction necessitates class boundaries.
Empirical Results and Analysis
On closed-form formula-driven QA (min-variance/max-Sharpe), nearly all LLMs saturate performance (T4, T5 scores ≈1.00, 0.94+), regardless of underlying correlation. However, judgment-driven tasks (direction prediction, rebalancing) reveal substantial gaps—no model exceeds 0.52 on T1 or 0.88 on T6. Static QA scores do not reliably predict dynamic allocation performance, particularly when the covariance matrix is stripped from prompts.
Pipeline Evaluation: Error Propagation and Baseline Comparison
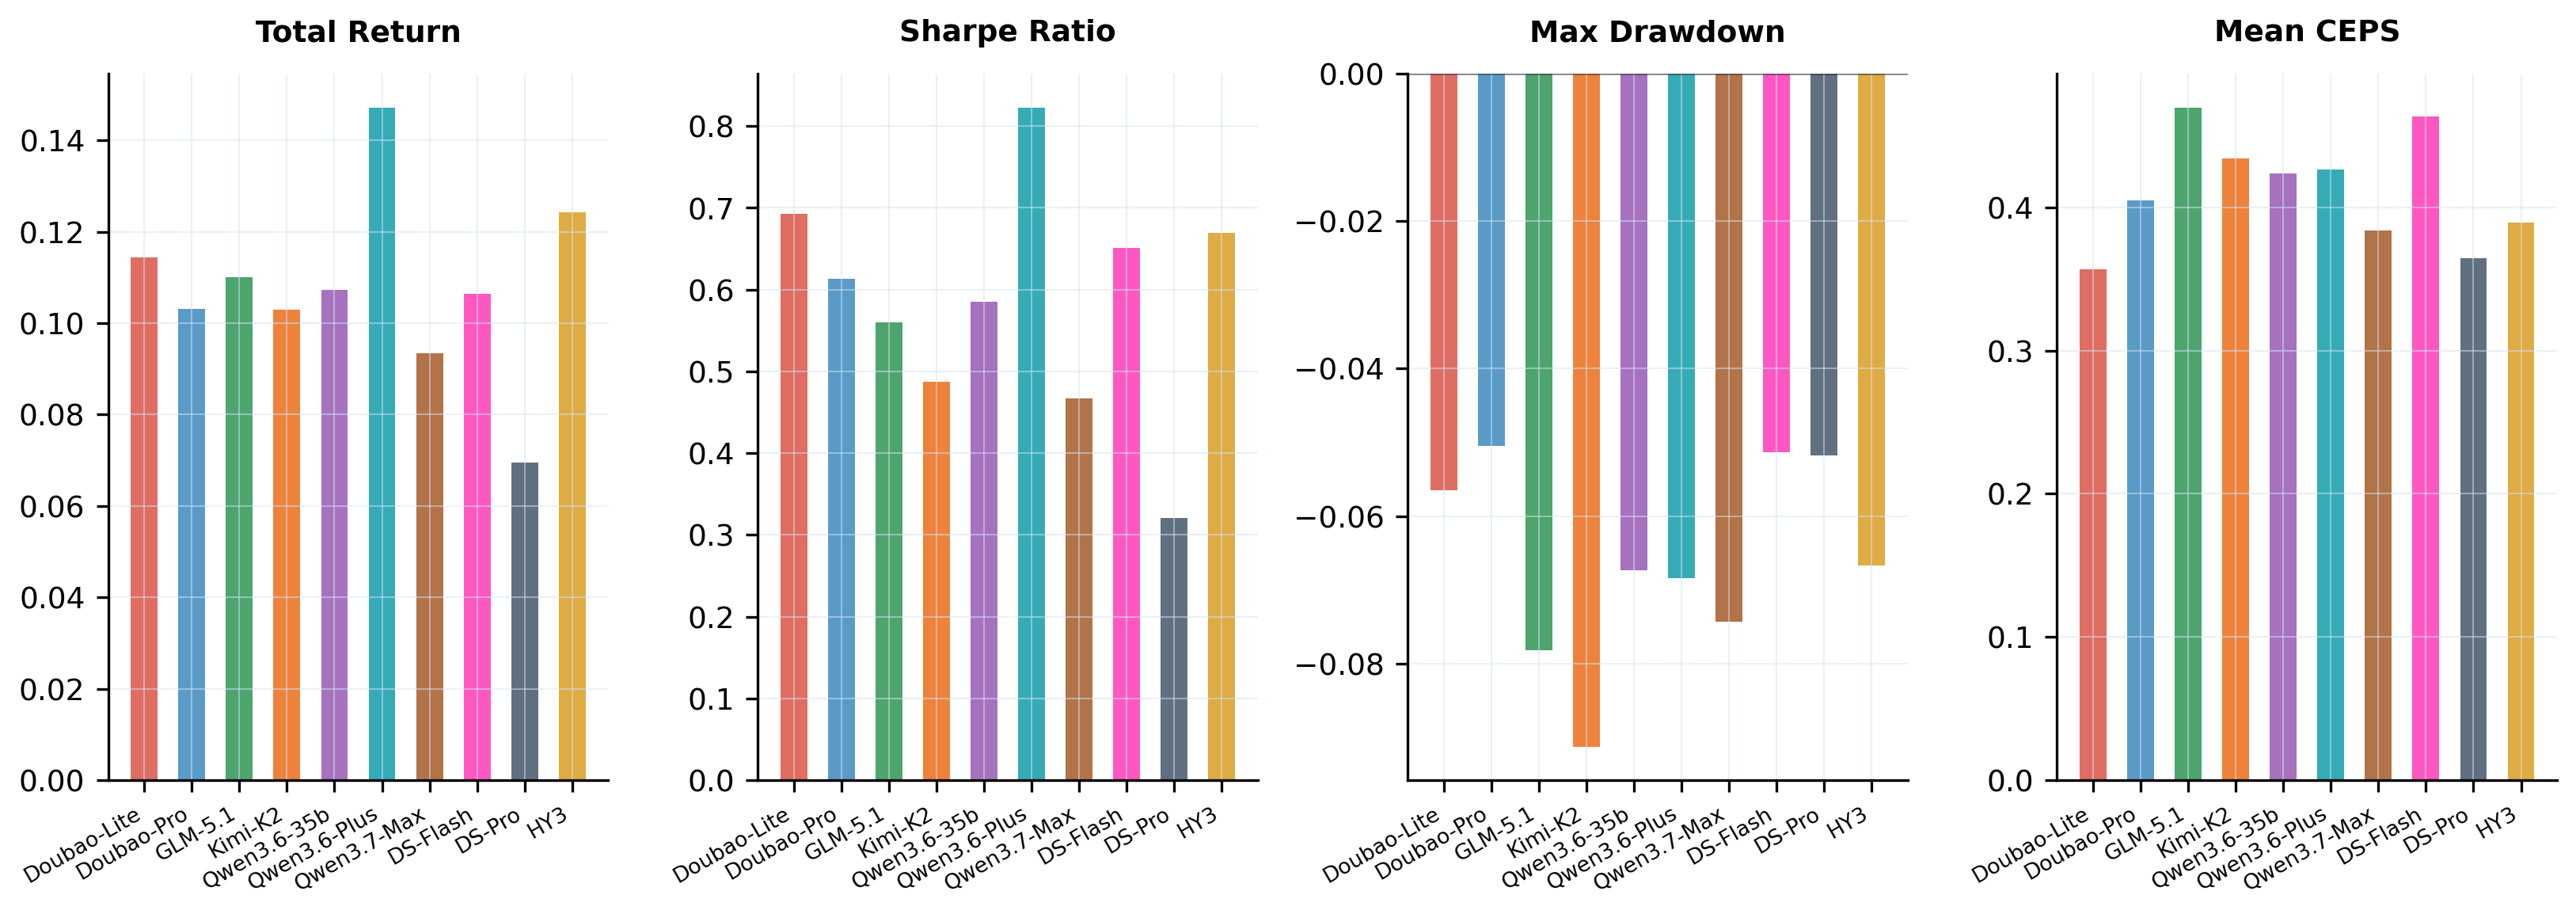
Despite strong QA performance, LLMs degrade sharply in dynamic evaluation. S1 market interpretation is robust, S2 signal generation moderately variable, but S3-S5 scores compress or collapse:
Critically, 90% of LLM–profile combinations fail to outperform the naive equal-weight baseline. Only Qwen3.6-Plus achieves simultaneous outperformance and passes the stress gate in one profile, corroborating classic results that $1/N$ diversification is difficult to beat without accurate risk estimation [demiguel2009optimal].
Stress Regimes: Robustness and Drawdown Control
Stress evaluation surfaces catastrophic failures even in models that satisfy all process constraints. Small allocations to high-risk assets (e.g., crypto) amplify into large drawdowns during regime shocks, especially for conservative profiles.
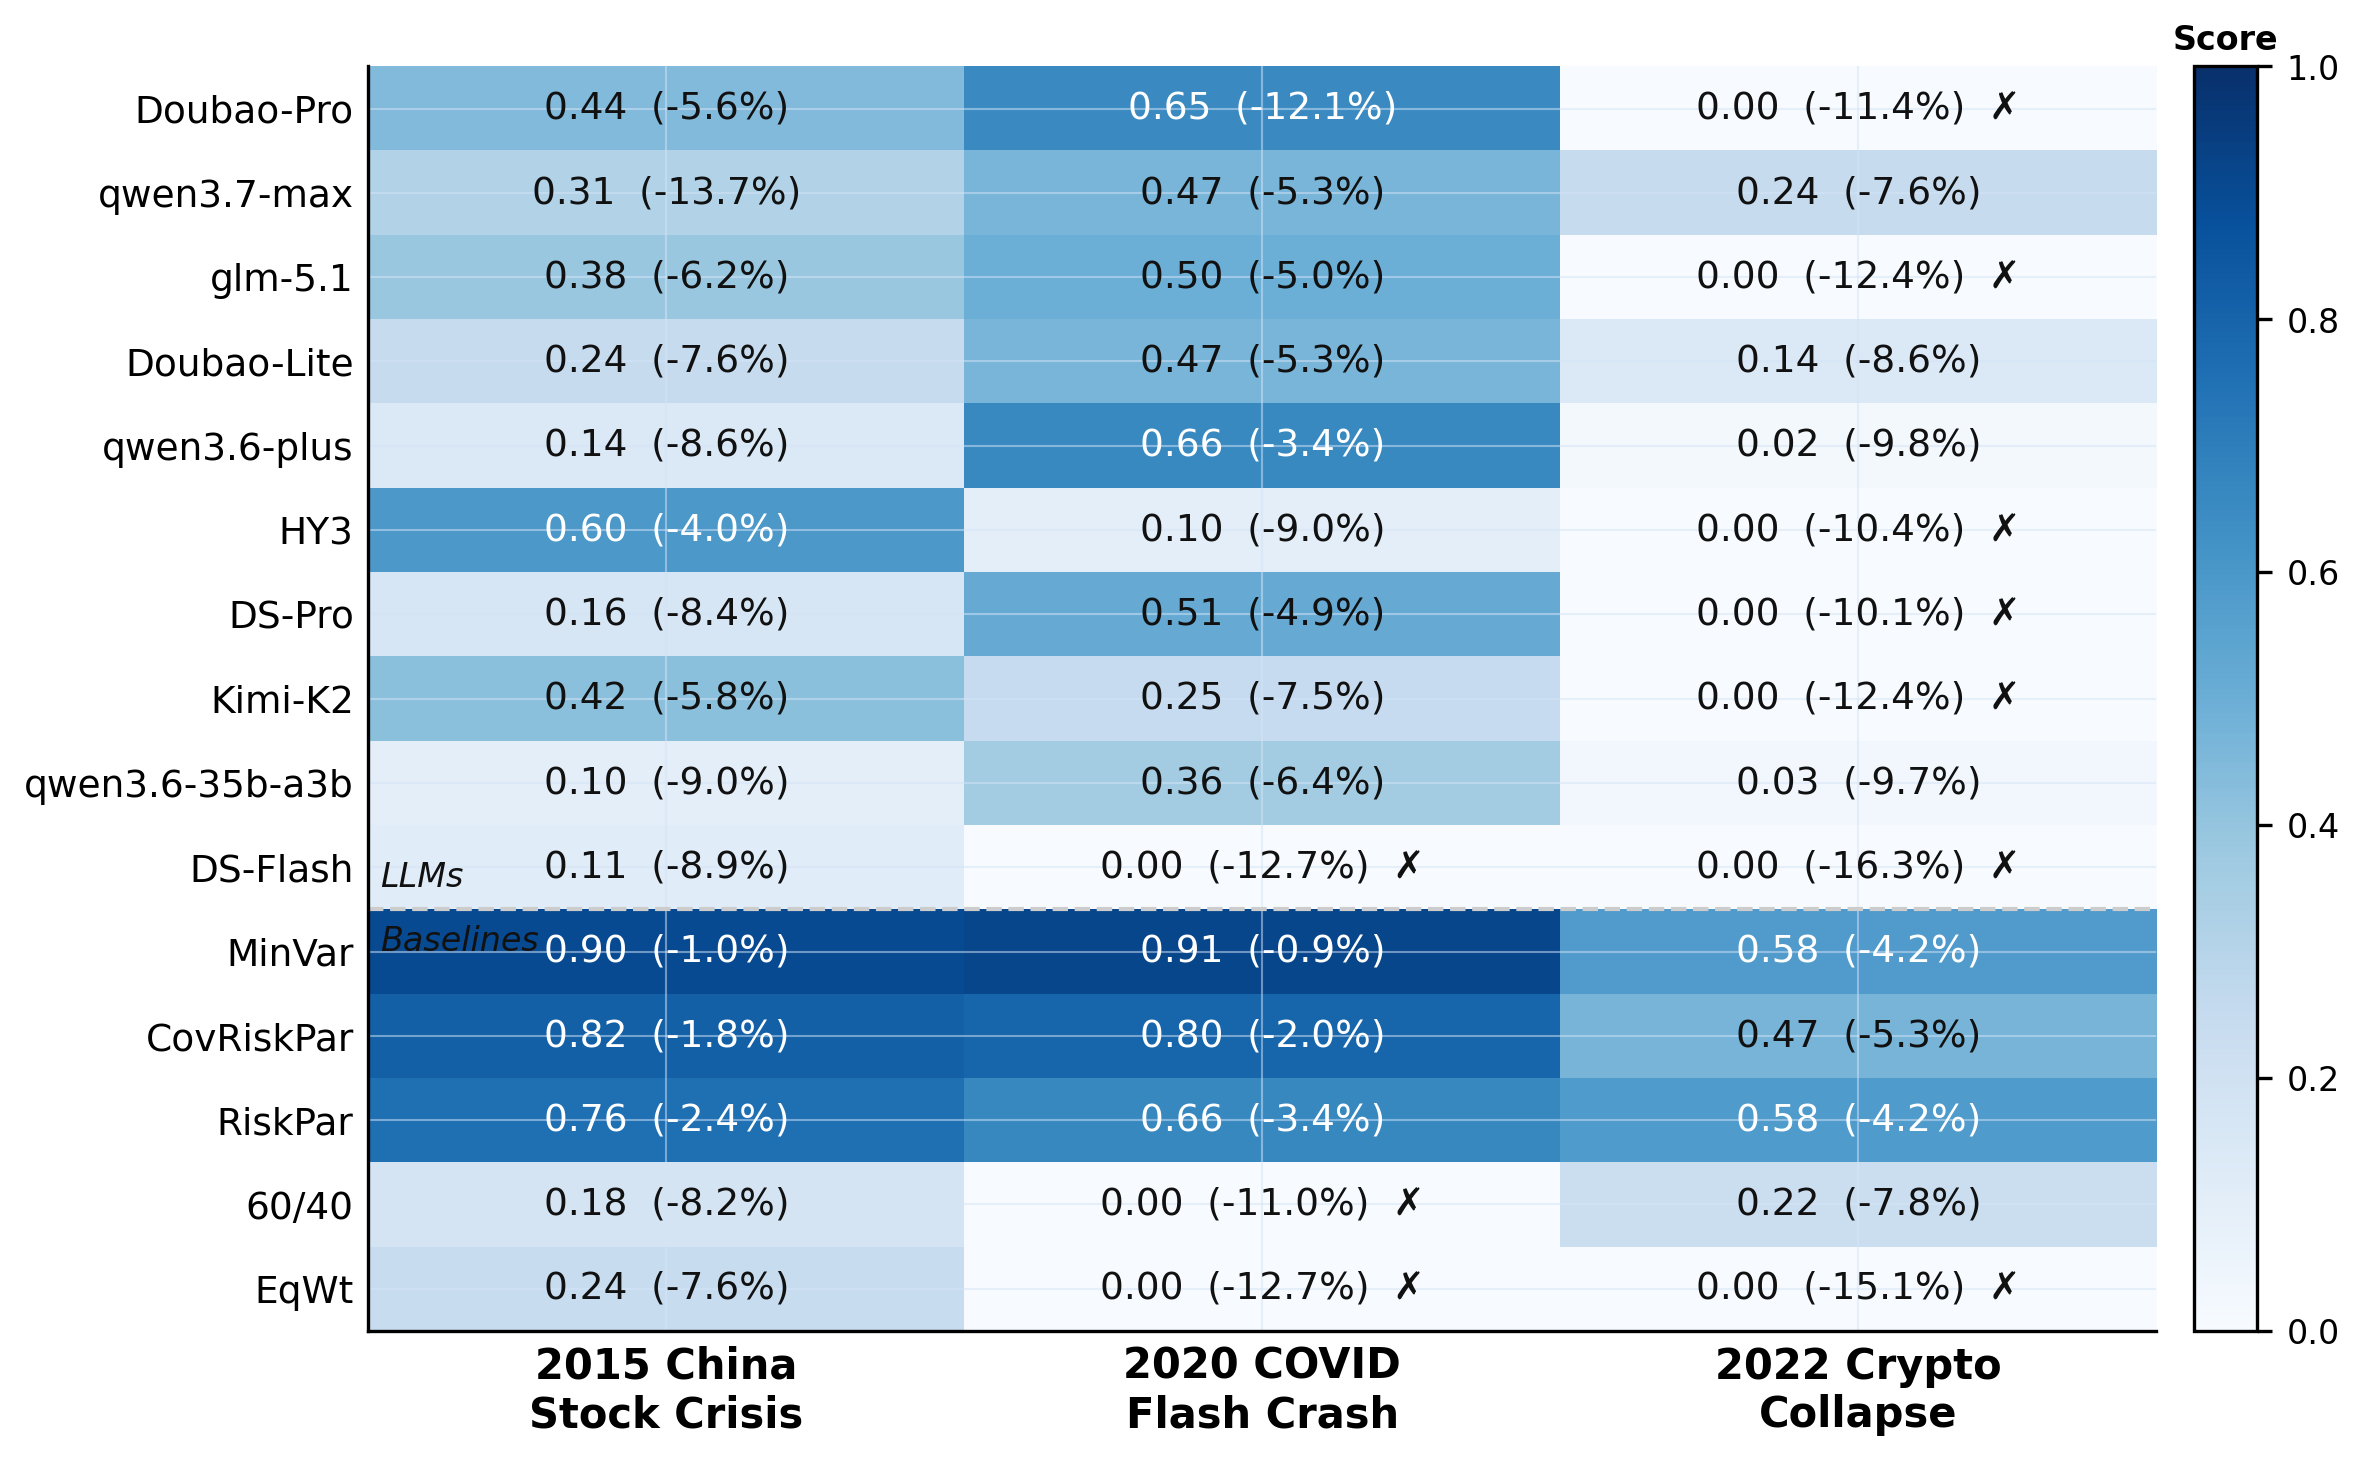
Figure 7: Worst-case drawdown per model across stress regimes.
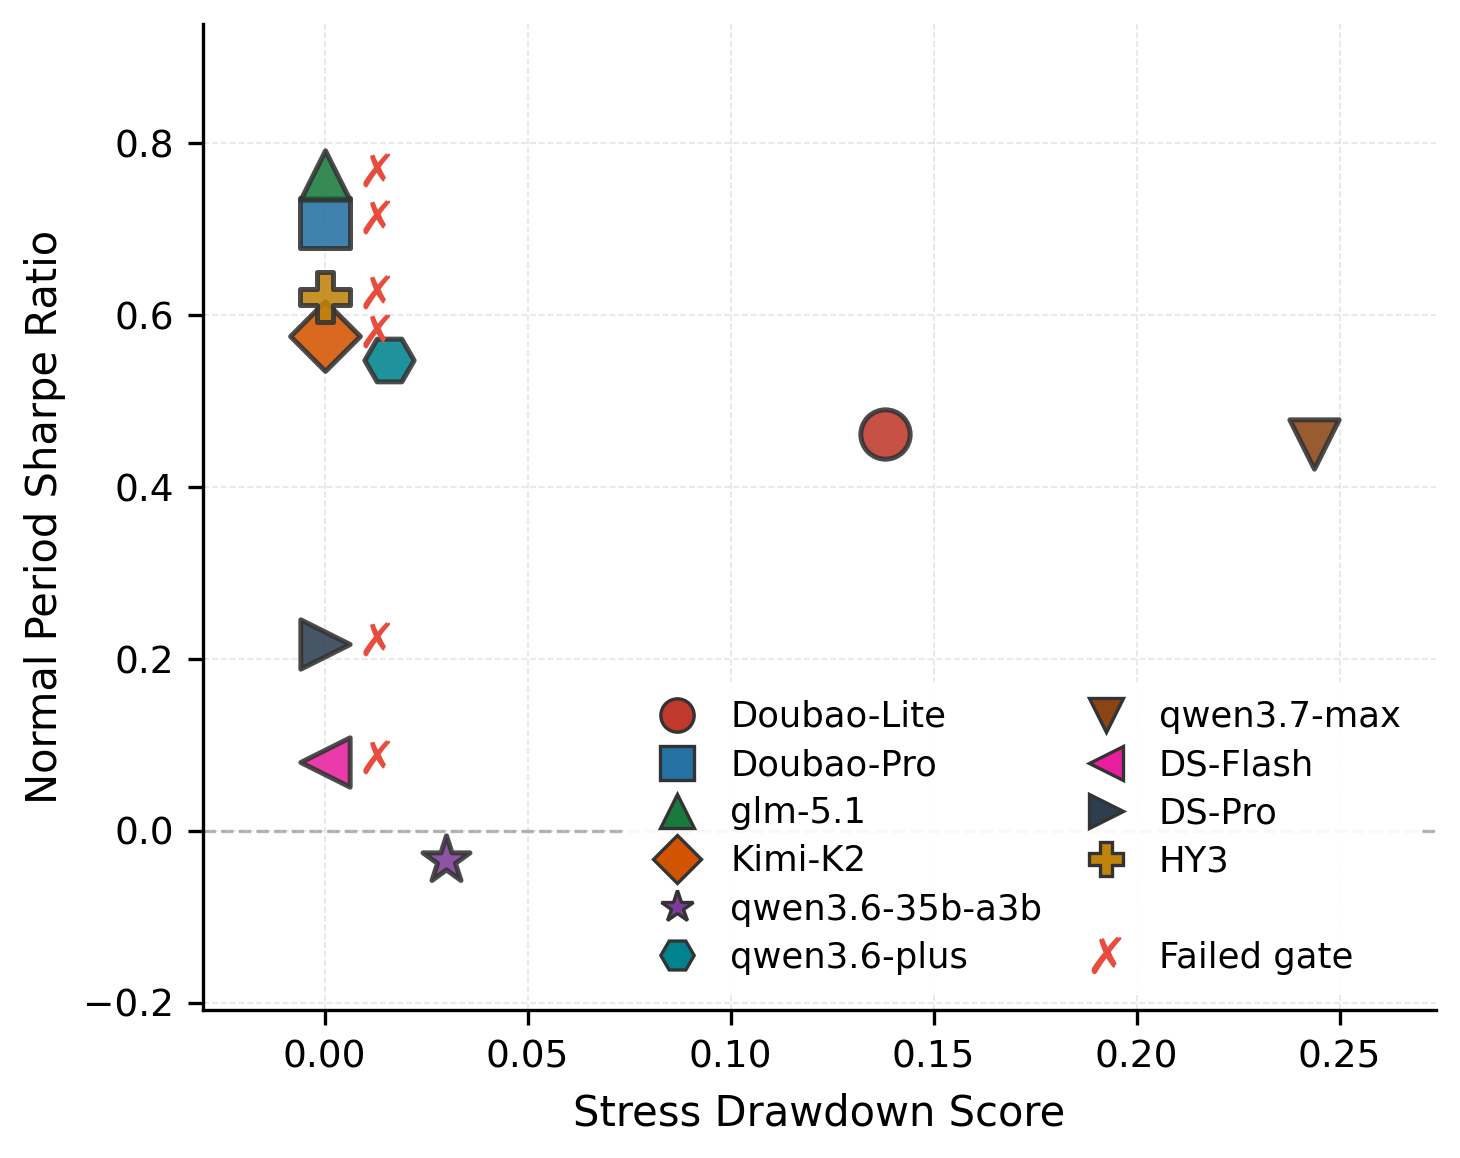
Figure 8: Sharpe ratio vs. stress drawdown; stress gate-failing models marked.
Models that pass stress gates do not share common strengths—robustness is not explained by return optimization nor CEPS, but by alignment and consistency of strategy relative to risk settings.
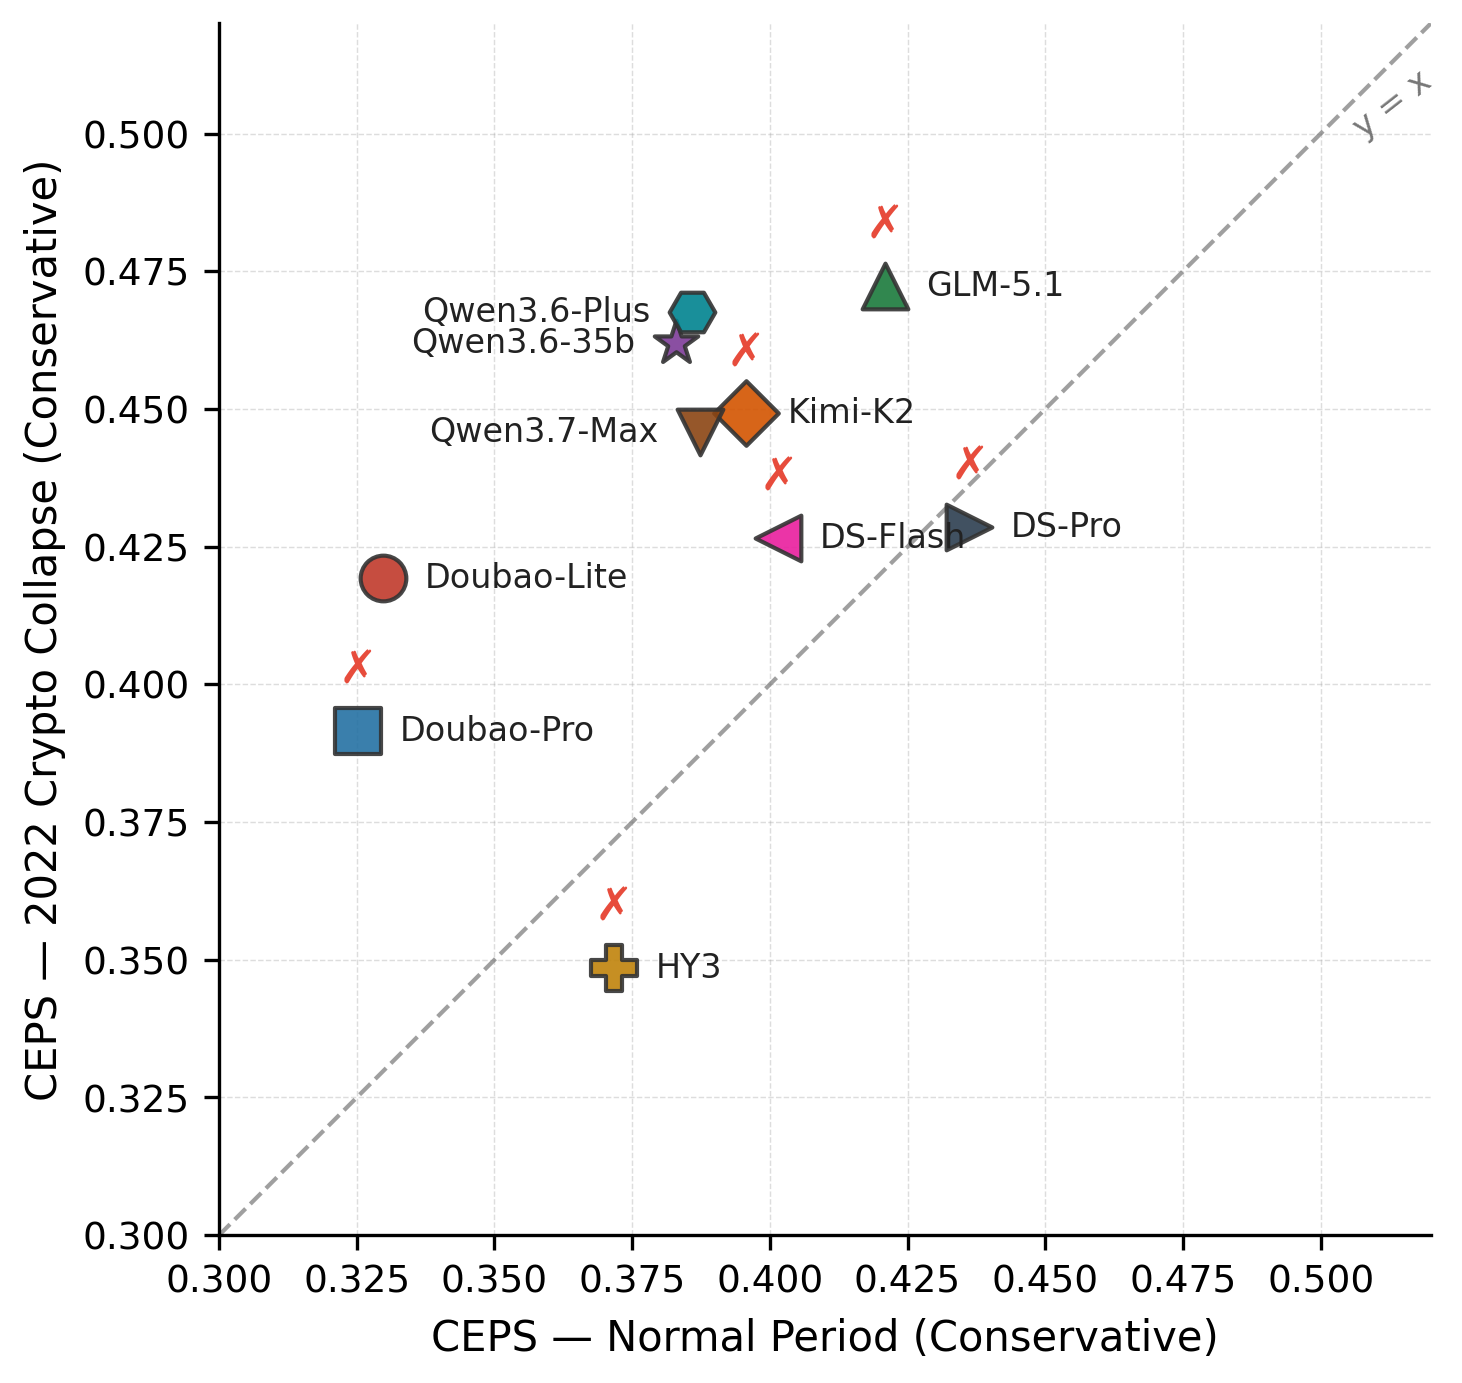
Figure 9: Normal- vs. stress-period CEPS under the 2022 Crypto Collapse (conservative profile).
Profile Adaptation and Constraint Satisfaction
LLMs provide a unique value in adapting allocation to profile-specific constraints—baselines such as equal-weight or 60/40 are insensitive to profile changes, whereas LLMs can calibrate PAS (profile alignment score) across risk tolerances.
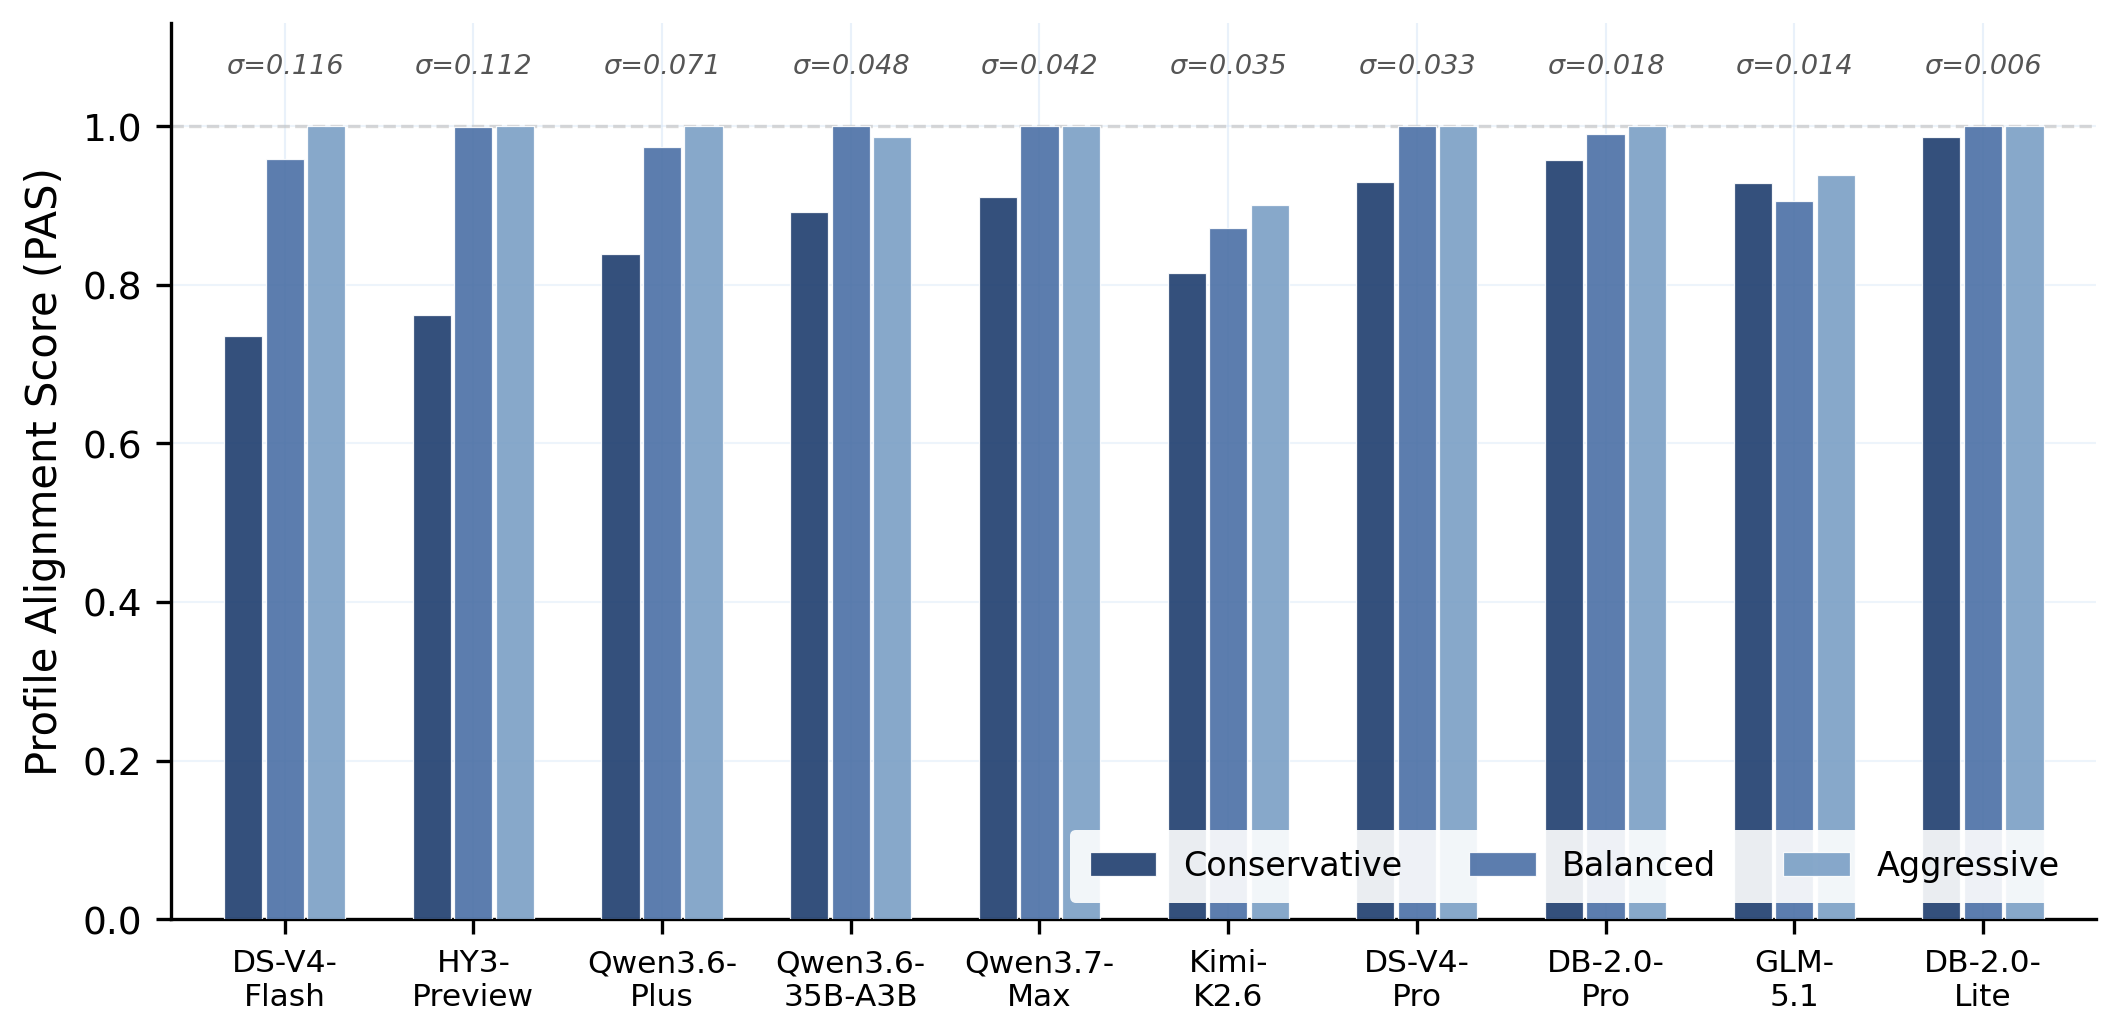
Figure 10: PAS per model; models sorted by adaptation std deviation.
Pipeline Error Dynamics
S2–S4 disconnect is remarkably consistent: models fail to translate strong signals into actionable portfolio changes, under-trading relative to ground-truth, and default to distributed allocations. Only DeepSeek models benefit from explicit covariance data; for others, high QA performance is generally format-matching rather than true numerical reasoning.
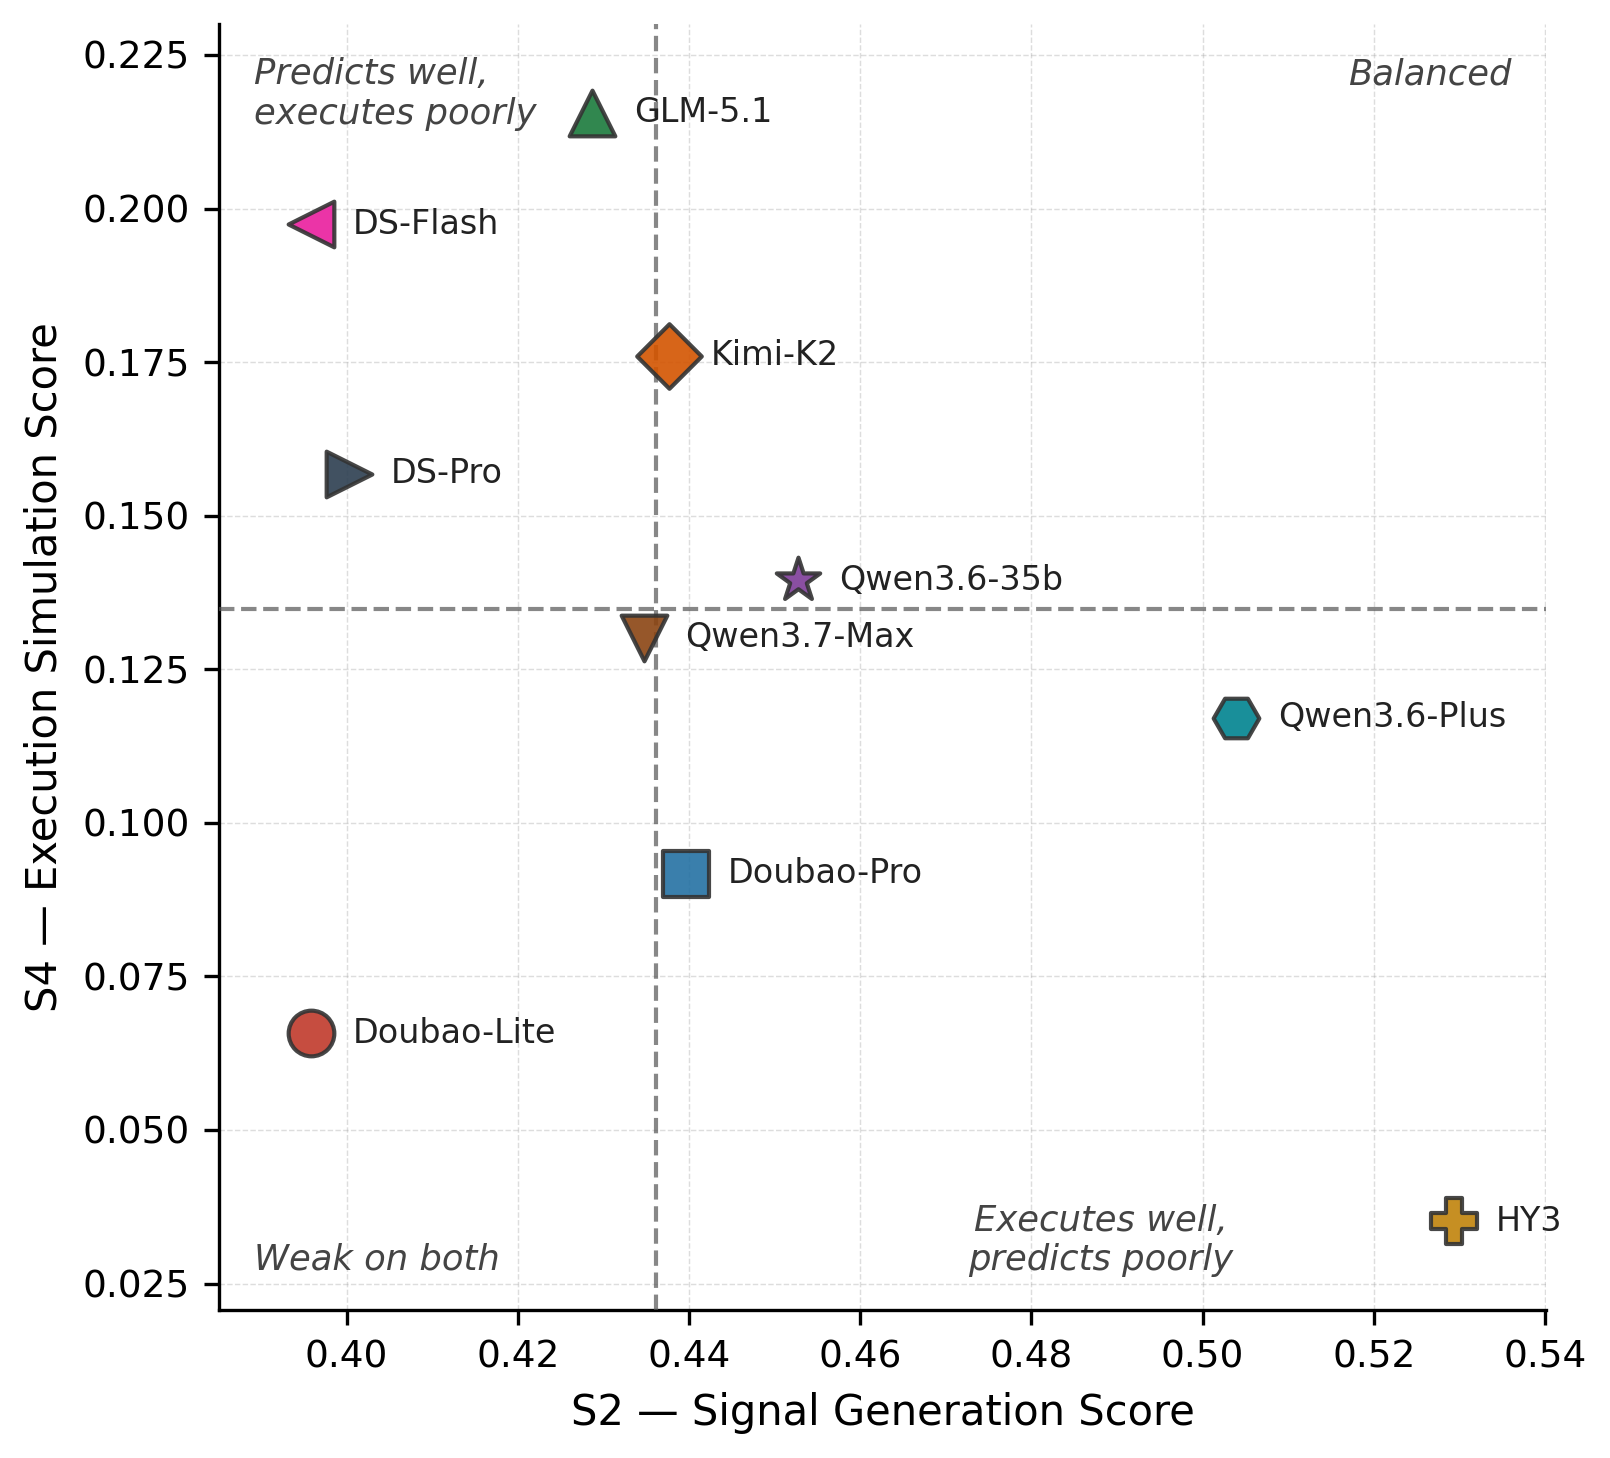
Figure 11: S2 vs. S4 scatter; S4 execution collapse prevalent across models.
Implications, Theoretical and Practical
PortBench’s results clarify the delta between factual recall and sustained reasoning in PM. LLMs excel at formulaic QA but cannot yet reliably optimize allocations in environments requiring dynamic, correlation-aware risk management, especially over sequential stages or under stress.
- Constraint Adaptation: LLMs trail classical strategies on raw return, but offer adaptive allocation and tail-risk management tuned to user profiles.
- Stress Resilience: Return-based evaluation is insufficient; regime shocks and correlation surges produce outcome failures not captured by average scores.
- Correlation Awareness: Benchmark design must include diversified scoring and stress tests to distinguish genuine reasoning from prompt format retrieval.
- Agentic Extensions: Integration of generative market simulators and multi-agent architectures (e.g., MarS) will be required for realistic execution dynamics and longer-horizon reasoning.
Limitations and Future Directions
The framework abstracts away market microstructure, uses monthly rebalancing, and lacks persistent memory, tool-calling, or agentic coordination. Extending PortBench with generative simulation, finer temporal granularity, and agent interaction will be necessary for next-generation PM benchmarking.
Conclusion
PortBench provides a structured, correlation-aware benchmark for LLM-driven portfolio management, offering robust evaluation across data-driven QA, pipeline execution, stress regimes, and investor profile adaptation. Results demonstrate that current LLMs—despite strong financial QA competence—fail to outperform naive diversification and remain fragile under correlation shocks, with genuine value only in constraint adaptation and tail-risk awareness. The benchmark is foundational for future research aiming to close the gap between statistical knowledge and reliable, adaptive decision-making in financial AI.