BrainExplore: Large-Scale Discovery of Interpretable Visual Representations in the Human Brain
Abstract: Understanding how the human brain represents visual concepts, and in which brain regions these representations are encoded, remains a long-standing challenge. Decades of work have advanced our understanding of visual representations, yet brain signals remain large and complex, and the space of possible visual concepts is vast. As a result, most studies remain small-scale, rely on manual inspection, focus on specific regions and properties, and rarely include systematic validation. We present a large-scale, automated framework for discovering and explaining visual representations across the human cortex. Our method comprises two main stages. First, we discover candidate interpretable patterns in fMRI activity through unsupervised, data-driven decomposition methods. Next, we explain each pattern by identifying the set of natural images that most strongly elicit it and generating a natural-language description of their shared visual meaning. To scale this process, we introduce an automated pipeline that tests multiple candidate explanations, assigns quantitative reliability scores, and selects the most consistent description for each voxel pattern. Our framework reveals thousands of interpretable patterns spanning many distinct visual concepts, including fine-grained representations previously unreported.
Paper Prompts
Sign up for free to create and run prompts on this paper using GPT-5.
Top Community Prompts
Explain it Like I'm 14
What is this paper about?
This paper introduces BrainExplore, a computer-assisted way to find and describe what kinds of pictures the human brain responds to. It looks for hidden “patterns” in brain scans and explains them in simple words (like “hands holding objects” or “stone buildings”). The goal is to discover, at a large scale, which visual ideas are represented in different parts of the brain, without hand-picking a few categories or doing everything by hand.
The big questions they asked
- Can we automatically discover many different visual ideas (concepts) the brain uses, not just a few (like “faces” or “places”)?
- Can we explain these brain patterns in natural language, using examples of the images that trigger them?
- Which brain regions represent which kinds of visual ideas?
- Do newer techniques and extra data help us find clearer, more detailed patterns?
How did they study it?
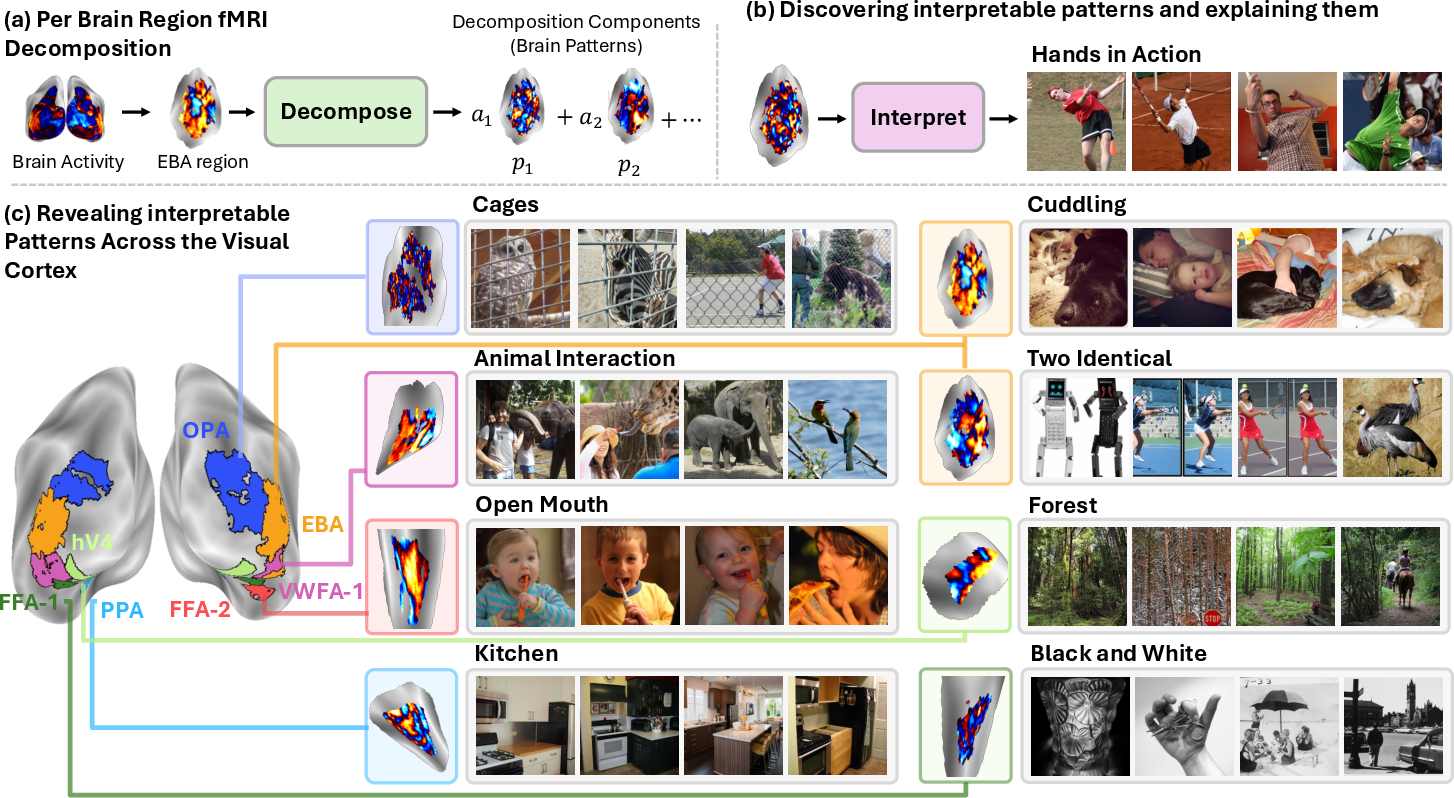
They used fMRI, which is like taking a movie of brain activity while people look at images. Each tiny 3D “pixel” of the brain scan is called a voxel. The brain’s response to a picture is a mix of many underlying patterns, but those patterns are not obvious. BrainExplore tries to separate and explain them.
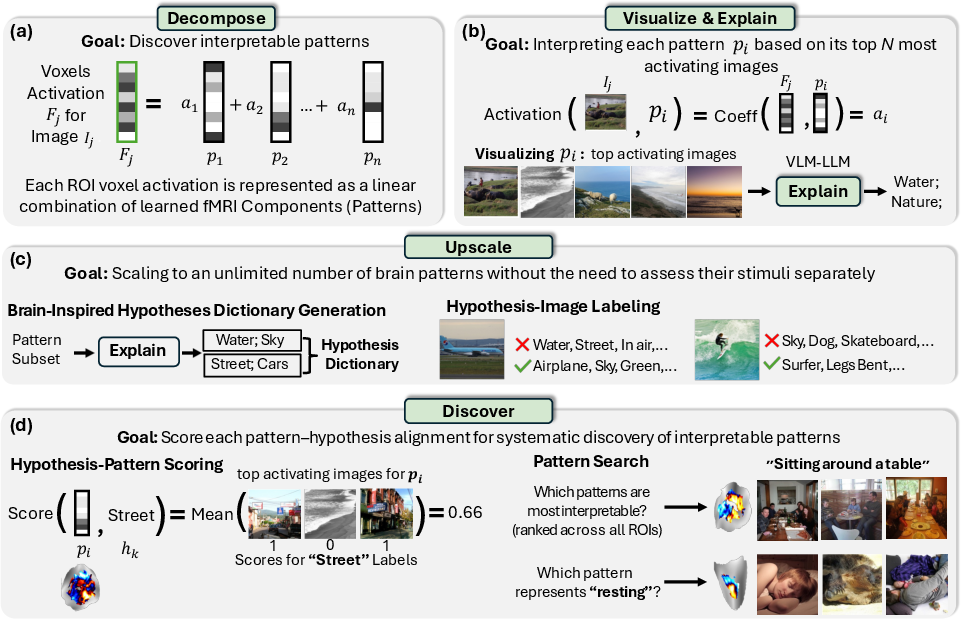
Step 1: Split brain responses into patterns
Think of a brain response like a song made from many instruments. The team used methods that separate a complicated signal into simpler pieces (the “instruments”):
- PCA, NMF, ICA: classic math tools for breaking a big signal into parts.
- SAE (Sparse Autoencoder): a modern AI method that learns a large “dictionary” of brain patterns but encourages using only a few of them for each image (like a recipe that uses just a few ingredients out of a huge pantry). “Sparse” means most ingredients are zero; only a small set is active at a time.
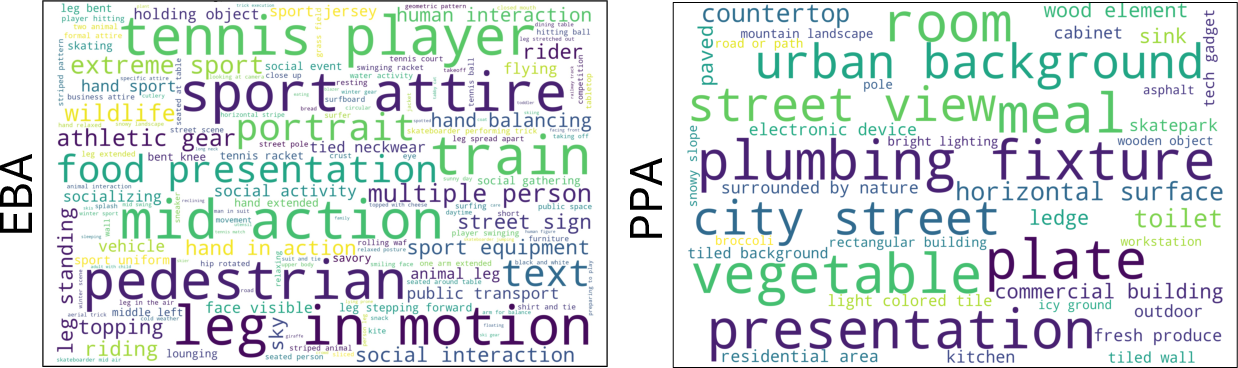
Each brain region (ROI) is handled separately (for example: EBA for bodies/actions, PPA for places/scenes, OPA for scene layout/navigation, V4 for color/shape).
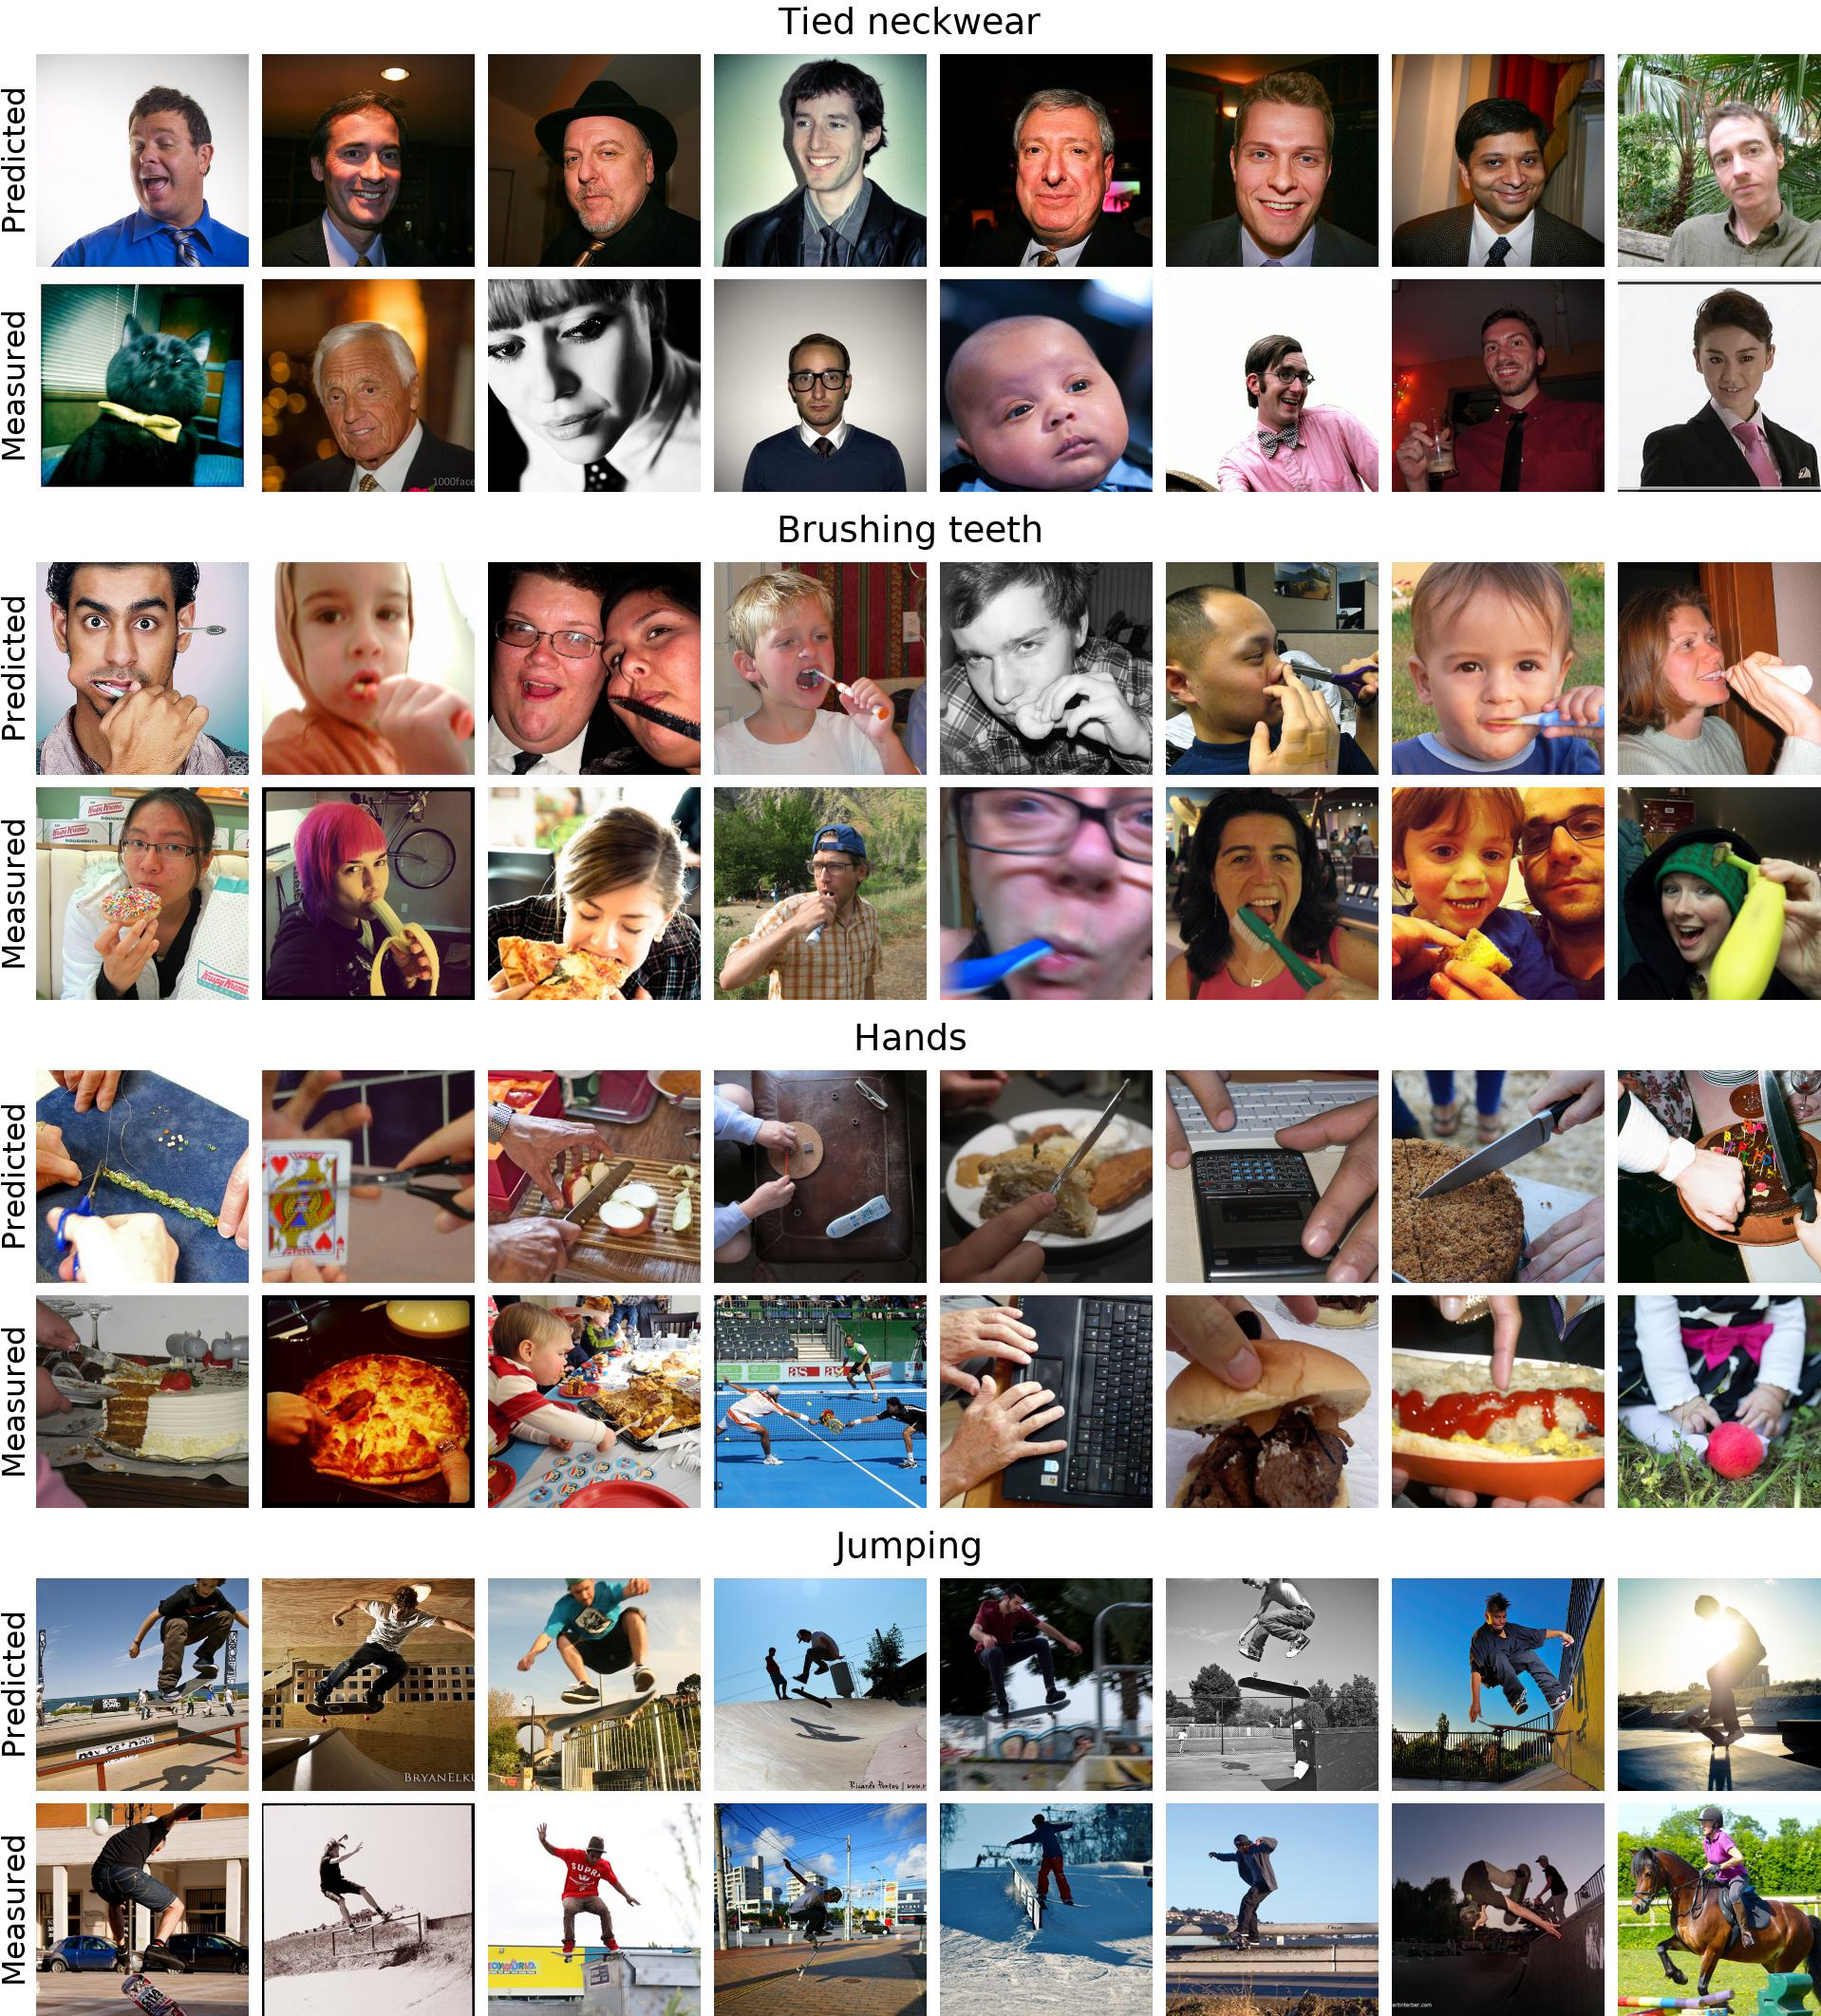
Step 2: Find the pictures that “wake up” each pattern
For each pattern, they looked for the images that made it respond the strongest. These top images help reveal what that pattern “likes.”
Step 3: Teach computers to describe patterns in words
They used AI that understands both images and language to:
- Caption the top images for a pattern.
- Propose a small set of simple explanations (hypotheses), like “open mouths,” “people jumping,” “stone buildings,” or “bathrooms.”
Step 4: Scale up with a brain-inspired concept dictionary
Explaining every pattern one-by-one is slow, so they built a dictionary of about 1,300 brain-inspired concepts. Then they labeled the whole image set with which concepts apply to which images. To do this efficiently and accurately:
- They first used an image–text matching model (CLIP) to shortlist likely concepts per image.
- Then they used a vision–LLM (VLM) twice to confirm “yes/no” labels for each shortlisted concept.
Now, any new brain pattern can be tested by checking how consistently its top images match concepts in this dictionary.
Step 5: Score how well words match patterns
They scored each pattern against each concept: if many of a pattern’s top images match a concept (like “frisbees” or “stone arches”), that concept probably explains the pattern. They also adjust for rare concepts so they’re not unfairly penalized.
Extra: Use predicted brain signals to get more data
Real fMRI data is limited (about 10,000 images per person). The team used a separate model that predicts brain responses for new images the participants never saw—like a “what-if” brain simulator. This expanded their image–brain dataset to over 120,000 images. More data helped the pattern-finding methods work better.
What did they find, and why is it important?
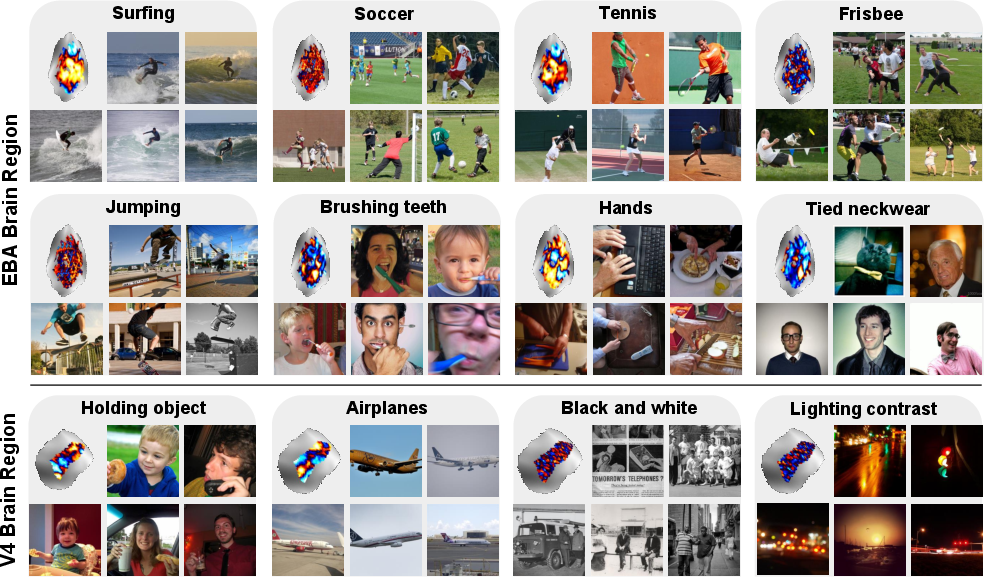
- They discovered thousands of interpretable brain patterns across many regions. These include detailed, fine-grained ideas:
- People and actions: surfing, soccer, tennis, jumping, tooth brushing.
- Body details: open mouths, hands holding objects, bent knees, neckwear.
- Objects: identical objects, specific tools or items.
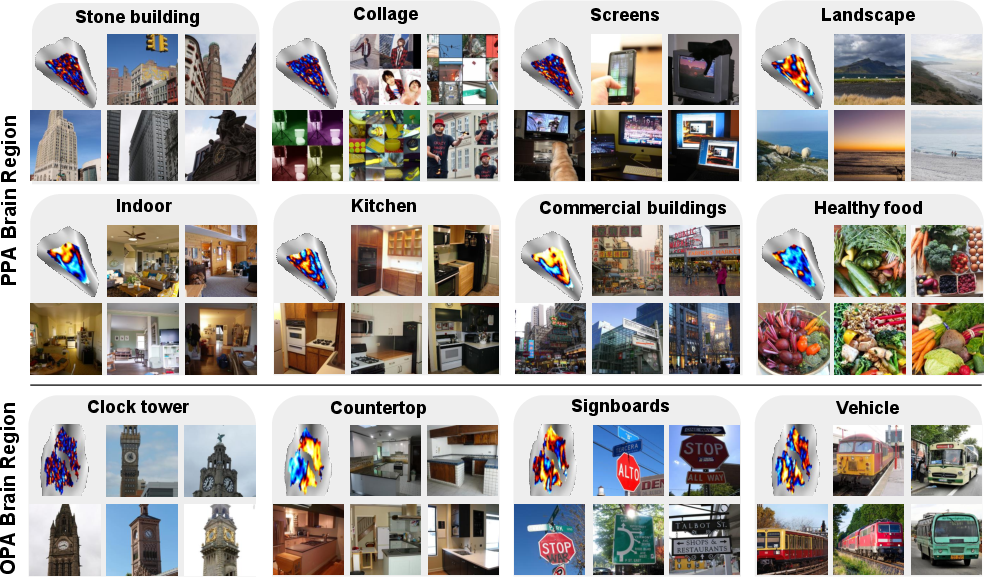
- Scenes: nature, streets, oceans, bathrooms, different kinds of buildings (e.g., stone or commercial).
- Different regions prefer different ideas (as expected), but the method reveals much finer detail:
- EBA (body/action) showed patterns for specific sports and body poses.
- PPA (places/scenes) showed nuanced scene types (landscapes, stone architecture, commercial buildings), not just “indoor vs. outdoor.”
- OPA (scene layout/navigation) and V4 (color/shape) also showed meaningful specializations.
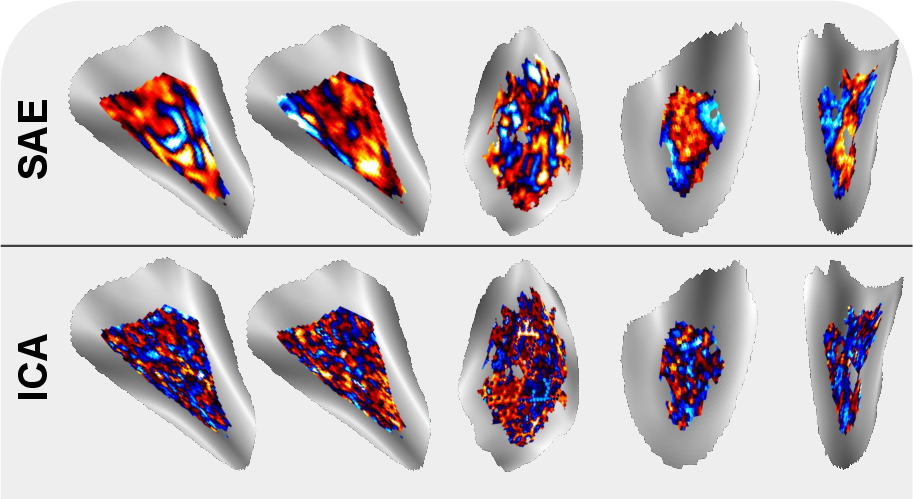
- The SAE method found patterns that were more spatially “tidy” (localized on the brain’s surface), which is biologically sensible and helps interpretation.
- Using predicted brain data greatly improved results. For example, one classic method (ICA) went from explaining less than 1% of concepts to about 18% after adding the extra data. Combining methods (ICA + SAE) did best overall (around 22% at a moderate bar).
- They checked their explanations using measured fMRI signals not used in choosing the explanations, to make sure the results were reliable.
In short, BrainExplore scales brain interpretability beyond small, hand-crafted studies and reveals many new, specific visual ideas represented in the brain.
What does this mean for the future?
- Faster discovery in neuroscience: Scientists can now search across many brain regions and many possible visual ideas automatically, rather than testing one idea at a time. This can speed up mapping what different parts of the brain do.
- Better tools and benchmarks: They plan to release their code, the concept dictionary, and large labeled datasets, so others can improve and compare new methods.
- More detailed brain–AI links: As AI vision/LLMs get better, this approach can uncover even more precise brain concepts and help align AI and human perception.
- Potential long-term uses: Understanding how the brain organizes visual ideas could guide better brain–computer interfaces, assist diagnosis or tracking of brain conditions, and inspire more human-like AI systems.
Overall, BrainExplore shows that with smart data tools and AI, we can uncover a rich “vocabulary” of visual concepts in the human brain—clearly, automatically, and at large scale.
Knowledge Gaps
Knowledge gaps, limitations, and open questions
Below is a focused list of what remains missing, uncertain, or unexplored in the paper, articulated as concrete, actionable items for future research:
- Generalizability beyond NSD/COCO: Assess whether discovered patterns and alignment scores replicate across different datasets (e.g., BOLD5000, movie stimuli), scanner strengths, acquisition protocols, and tasks, not just NSD’s 7T static-image paradigm.
- Cross-subject consistency and alignment: Quantify how consistently the same concepts and spatially localized patterns appear across all NSD subjects, and develop subject-to-subject alignment (e.g., hyperalignment) to map patterns to shared cortical coordinates.
- Dependence on predicted fMRI augmentation: Evaluate how much interpretability relies on the universal encoder’s predicted responses by systematically varying augmentation strength and testing measured-only baselines with controlled sample sizes and matched image pools.
- Potential circularity with vision models: Audit the universal brain encoder and CLIP/VLMs for shared feature spaces or training dependencies to rule out representational circularity that could inflate alignment when CLIP guides hypothesis shortlist and the encoder uses CLIP-like features.
- Ground-truth validation of labels: Replace or augment CLIP/VLM-derived binary concept labels with human-annotated ground truth and quantify label noise, precision/recall per concept, and its effect on alignment scores.
- Statistical calibration of alignment scores: Introduce rigorous significance testing (e.g., permutation, hypergeometric/binomial tests with multiple-comparison correction) instead of heuristic normalization and hard thresholds (0.5/0.8) to control false positives across thousands of hypotheses/patterns.
- Sensitivity to scoring choices: Ablate key scoring hyperparameters (top-activating image fraction at 0.2%, frequency normalization cap=2, exclusion of nonpositive coefficients) and demonstrate robustness of interpretability rankings to these choices.
- Negative-direction selectivity: Explicitly analyze patterns activated in the negative direction (currently excluded for non-SAE methods) and test whether negative coefficients encode meaningful, complementary representations.
- Confound disentanglement in natural images: Use controlled stimulus manipulations or synthesis (e.g., generative models) to decouple co-occurring features (e.g., “soccer” vs “grass”, “beach” vs “ocean”) and verify that discovered concepts are not driven by scene context or correlated artifacts.
- Coverage and bias in the concept dictionary: Quantify dictionary coverage relative to the space of possible visual features (low-level, mid-level, high-level, relational, action, affordance), measure biases introduced by seeding from top-CLIP-consistent patterns, and expand beyond ~1,300 concepts to underrepresented visual properties.
- Graded and relational labels: Replace binary labels with graded/probabilistic and relational attributes (e.g., pose angles, part-whole relations, interactions) to better capture nuanced and overlapping concepts within a single pattern.
- Mixture-of-concepts within patterns: Move beyond “best hypothesis per pattern” to model compositionality (multiple concepts per pattern), quantify mixtures, and test whether subcomponents can be disentangled.
- ROI parcellation dependence: Evaluate how decomposition results change with different parcellations (e.g., multimodal, functional connectivity-based) and compare per-ROI versus whole-cortex or subcortical-inclusive decompositions.
- Spatial localization quantification: Provide quantitative spatial metrics (e.g., cluster compactness, anatomical overlap, test-retest reliability) to substantiate claims that SAE yields more localized patterns.
- Whole-brain networks and connectivity: Extend from per-ROI analyses to network-level characterization (functional connectivity among patterns, cross-ROI co-activation, hierarchical organization) to capture distributed representations.
- Low-level feature mappings: Systematically test whether the pipeline recovers known low-level maps (retinotopy, orientation, spatial frequency, color) and how these interact with high-level semantics in regions like V1–V4.
- Temporal dynamics and naturalistic viewing: Incorporate time-resolved data (e.g., movie stimuli, event-related designs) to study temporal evolution, invariances, and sequence-level representations beyond static images.
- Causal perturbations and behavioral relevance: Validate discovered concepts with causal manipulations (e.g., TMS, adaptation), psychophysics, and encoding-decoding performance gains to connect interpretability to behavior and neural mechanism.
- Stability across decomposition runs: Quantify the stability and reproducibility of learned components across seeds, hyperparameters, and methods (PCA/NMF/ICA/SAE), including component matching and variance in spatial maps.
- SAE design space and spatial priors: Systematically explore SAE architectures (expansion factors, sparsity regimes) and introduce spatial priors/constraints to explicitly test their role in localization and interpretability.
- Bias from CLIP-based shortlist: Measure how CLIP-driven hypothesis preselection shapes concepts recovered (precision/recall trade-offs) and compare against alternative retrieval/shortlisting strategies (e.g., category taxonomies, human-curated lists).
- Evaluation on measured-only top images: Report interpretability using top-activating images drawn exclusively from measured fMRI, matched in number to predicted pools, to ensure fairness and isolate augmentation effects.
- Multiple-comparison control over “thousands of patterns”: Implement false discovery rate (FDR) or family-wise error control across the large number of pattern–hypothesis tests to mitigate spurious interpretability.
- Beyond vision-related ROIs: Extend analyses to non-visual and associative cortices (e.g., memory, semantics, decision-making regions) to explore how visual concepts interface with higher cognition.
- Generalization to out-of-distribution stimuli: Test robustness on images beyond COCO (sketches, synthetic renderings, adversarial cases, culturally diverse datasets) and measure drops/gains in concept alignment.
- Practical scalability and compute: Characterize time/memory costs of the full pipeline (dictionary generation, image labeling, scoring) and propose optimizations or incremental updating strategies for “unlimited number of patterns”.
- Public benchmark validation: When releasing the concept dictionary and rankings, include standardized tasks, ground-truth subsets, and reproducibility scripts to enable comparable evaluation and method benchmarking.
- Ethical and reliability considerations for automated explanations: Assess risks from LLM/VLM hallucinations and provide uncertainty estimates or confidence intervals for explanations to guide responsible interpretation by neuroscientists.
Practical Applications
Below are practical, real-world applications that follow from the paper’s findings, methods, and innovations. Each item notes sectors, potential tools/products/workflows, and feasibility dependencies.
Immediate Applications
- Interpretable fMRI analysis at scale for research (Academia; Software/AI)
- Use BrainExplore’s automated pipeline (per-ROI decomposition + image retrieval + hypothesis scoring) to rapidly annotate and compare interpretable patterns across new fMRI datasets.
- Tools/workflows: Open-source BrainExplore code and brain-inspired concept dictionary; integration with existing Python neuroimaging stacks (e.g., Nilearn/BrainIAK); “interpretability scorecard” exports for publications.
- Assumptions/dependencies: Access to voxelwise fMRI data with ROI parcellations; adequate compute for decomposition and VLM/LLM labeling; reliance on quality of VLM/LLM and CLIP embeddings; reproducibility may vary across scanners/protocols.
- Benchmarking and model selection for decomposition/encoding methods (Academia; Software/AI)
- Compare PCA/NMF/ICA/SAE variants via standardized interpretability metrics (pattern–hypothesis alignment) to choose methods/hyperparameters per ROI or dataset.
- Tools/workflows: Unified scoring harness; multi-run aggregation (as in SAE+ICA) to select best components; CI dashboards for labs.
- Assumptions/dependencies: Consistent train/eval splits; availability of predicted fMRI augmentation improves stability but is optional.
- Stimulus set design for vision experiments (Academia; Education)
- Retrieve top-activating images per pattern to build targeted stimulus batteries (e.g., “open mouth,” “bent knees,” “stone architecture”) for hypothesis-driven studies.
- Tools/workflows: Pattern search → top-images export; concept-to-stimulus recommender; subject-specific or group-average sets.
- Assumptions/dependencies: Generalization from COCO-like images to lab stimuli; ethics approval for subject testing; validation on measured fMRI recommended.
- Rapid annotation of existing datasets with concept labels (Academia; Software/AI)
- Use the brain-inspired dictionary and two-pass VLM verification to produce sparse, higher-precision concept labels for large image sets linked to fMRI.
- Tools/workflows: CLIP-based hypothesis shortlist → VLM verification pipeline; batch processing on new image-fMRI corpora.
- Assumptions/dependencies: VLM/LLM reliability; label bias from web data; post-hoc spot checks advisable.
- Cross-subject harmonization using predicted fMRI (Academia)
- Augment small per-subject datasets with predicted responses (e.g., universal brain encoder) to stabilize decomposition and improve component interpretability across individuals.
- Tools/workflows: Train/run an image-to-fMRI encoder; mixed measured+predicted pooling for decomposition and image retrieval; per-ROI pipelines.
- Assumptions/dependencies: Availability of a robust universal encoder; domain shift across cohorts/scanners; measured data still needed for evaluation.
- Educational visualization of brain representations (Education; Public outreach)
- Interactive atlases showing top images and textual explanations by ROI (e.g., EBA body/action patterns, PPA scene subtypes) to teach visual cortex organization.
- Tools/workflows: Web demos using released patterns; lightweight dashboards for classroom use.
- Assumptions/dependencies: Appropriate simplification for non-experts; clear caveats about variability and non-causality.
- AI model diagnostics and brain alignment studies (Software/AI; Academia)
- Compare CNN/VLM features to brain-derived concept patterns; use BrainExplore’s dictionary to quantify model–brain concept overlap and gaps.
- Tools/workflows: Feature-to-concept probes; alignment metrics; brain-inspired regularizers during model training.
- Assumptions/dependencies: Access to model activations; caution interpreting correlation ≠ causation; concepts biased by training data distribution.
- Quality control for neuromaging pipelines (Academia; Healthcare—research use)
- Use interpretability metrics as a QC signal: sudden loss of interpretable patterns can flag preprocessing/registration errors or scanner artifacts.
- Tools/workflows: Routine interpretability checks embedded in preprocessing pipelines; threshold-based alerts.
- Assumptions/dependencies: Baseline interpretability profile per site/protocol; clear SOPs to interpret deviations.
- Content selection for neurocognitive training/rehabilitation pilots (Healthcare—research use; Education)
- Select images that strongly activate specific visual representations for exploratory neurofeedback or cognitive training protocols.
- Tools/workflows: Pattern-guided content curation; neurofeedback software integration.
- Assumptions/dependencies: Research setting only; clinical efficacy not established; IRB approvals; inter-subject variability.
- Open science and reproducibility resources (Policy; Academia)
- Adopt the released dataset of image–fMRI–explanation rankings as a community benchmark for interpretability, aiding funding and peer-review standards.
- Tools/workflows: Shared leaderboards; standardized reporting templates for interpretability results.
- Assumptions/dependencies: Community uptake; sustained hosting/maintenance; clear data licenses.
Long-Term Applications
- Fine-grained clinical mapping for neurosurgery (Healthcare)
- Use interpretable component maps to refine pre-surgical localization of visual functions (beyond coarse face/place areas), reducing risk to patient vision.
- Tools/products: “Concept-driven fMRI mapping” modules integrated into surgical planning suites.
- Assumptions/dependencies: Validation in clinical cohorts; robustness across scanners and tasks; regulatory approvals; per-patient calibration.
- Biomarkers for visual processing disorders (Healthcare)
- Identify atypical representation profiles (e.g., prosopagnosia, ASD-related social perception differences) via deviations in concept–pattern alignment.
- Tools/products: Clinical assessment workflows with normative databases; longitudinal monitoring tools.
- Assumptions/dependencies: Large normative/reference datasets; test-retest reliability; ethical safeguards; diagnostic validation studies.
- Targeted neurostimulation and neurofeedback (Healthcare)
- Guide TMS/tES/EEG-neurofeedback to modulate specific interpretable patterns (e.g., scene layout in OPA), enabling personalized therapy for visual deficits or recovery post-stroke.
- Tools/products: Closed-loop systems integrating real-time signals with pattern targets.
- Assumptions/dependencies: Causal evidence linking patterns to function; safety/efficacy trials; device integration.
- Brain–computer interfaces with interpretable latent spaces (Healthcare; Software/AI)
- Use brain-derived concept spaces to constrain decoders for image reconstruction or communication (e.g., selecting semantically meaningful categories).
- Tools/products: Decoders using concept-regularized latent spaces; user-facing UIs for semantic selection.
- Assumptions/dependencies: Sufficient SNR; training data per user; privacy/security frameworks; clinical-grade reliability.
- Neuroadaptive XR/AR interfaces (Education; Software/AI)
- Adapt visual content in XR based on inferred engagement with particular brain concept patterns (e.g., emphasize navigable layout cues during learning).
- Tools/products: XR SDKs with brain-aligned personalization hooks; on-device pattern inference.
- Assumptions/dependencies: Real-time or near-real-time proxies (EEG, eye-tracking) mapped to fMRI-derived patterns; user consent and privacy.
- Population-scale mapping and precision neuroscience (Academia; Policy)
- Harmonize multisite cohorts by anchoring analyses in shared concept dictionaries and pattern-scoring, facilitating large-scale studies of variability across age, culture, or disease.
- Tools/workflows: Cross-site calibration protocols; federated scoring frameworks.
- Assumptions/dependencies: Data-sharing agreements; standardized acquisition; governance for sensitive data.
- Drug discovery and pharmacodynamic monitoring (Healthcare; Pharma)
- Measure how candidate compounds affect visual cortical representations (e.g., modulation of object/scene concept patterns) as mechanistic biomarkers.
- Tools/products: fMRI interpretability endpoints for early-phase trials.
- Assumptions/dependencies: Sensitive, reproducible metrics; correlation to clinical outcomes; regulatory acceptance of biomarkers.
- Neuro-inspired representation learning for vision/robotics (Software/AI; Robotics)
- Train models with losses that encourage alignment to brain concept dictionaries and localized pattern structure to improve robustness and sample efficiency.
- Tools/products: “Brain-aligned” pretraining objectives; model selection via interpretability alignment scores.
- Assumptions/dependencies: Proven transfer benefits; scalable training; careful handling of human-bias artifacts in the concept set.
- Ethical frameworks and regulation for brain data interpretability (Policy)
- Develop standards for labeling, scoring, and reporting interpretability to mitigate privacy risks of brain-to-image or concept decoding.
- Tools/workflows: Audit checklists; risk classification guidelines for neuro-AI applications.
- Assumptions/dependencies: Multistakeholder consensus; evolving legal landscape; alignment with medical privacy regulations.
- Extension to other modalities and multimodal cognition (Academia; Healthcare)
- Apply the pipeline to auditory/language or multimodal datasets to build dictionaries for speech, music, or cross-modal semantics.
- Tools/workflows: Modality-specific decompositions; generalized hypothesis generation/labeling.
- Assumptions/dependencies: Availability of large naturalistic datasets; improved encoders for non-visual domains.
- Personalized education and training content (Education)
- Inform design of visual teaching materials by leveraging which concepts are most saliently represented across learners or subgroups.
- Tools/products: Content authoring tools that prioritize visuals aligned with robust cortical patterns.
- Assumptions/dependencies: Evidence that alignment improves learning outcomes; ethical use of cognitive data; privacy-preserving analytics.
- Neuromarketing and user research with safeguards (Finance/Marketing; Policy)
- Explore fine-grained engagement with visual concepts in products/ads while enforcing strict consent and privacy standards.
- Tools/products: Research-only analytics platforms with interpretable concept reports; built-in compliance (consent, anonymization).
- Assumptions/dependencies: Strong governance; risk of misuse; uncertain generalizability from lab to real-world behavior.
Notes on feasibility across applications:
- Generalization: Many findings are derived from NSD (COCO images, 7T fMRI); replication on diverse stimuli/scanners/populations is essential.
- Data augmentation: Gains depend on the quality and domain-match of image-to-fMRI encoders; measured fMRI remains critical for validation.
- AI dependencies: CLIP/VLM/LLM accuracy and bias directly affect hypothesis dictionaries and labels; continuous updates may change results.
- Interpretability vs. causality: High alignment scores indicate consistent co-activation with concepts but do not establish causal necessity; clinical uses require additional evidence.
Glossary
- Alignment score: A quantitative measure of how well a hypothesized concept matches the images that most strongly activate a brain pattern. "then automatically select the best matching concept and assign an alignment score."
- BGE text encoder: A text-embedding model used to represent hypotheses for clustering or deduplication. "we embed each hypothesis with a BGE text encoder~\cite{chen2024bge}"
- CLIP: A contrastive vision–LLM used to compute image–text similarity and semantic consistency. "we compute a CLIP-based consistency score for every pattern"
- Coefficient matrix: In a decomposition, the matrix containing coefficients that reconstruct each fMRI response from learned components. "a coefficient matrix, which contains the linear coefficients reconstructing each fMRI response from these patterns."
- Component matrix: The matrix whose columns are the learned fMRI component patterns. "a component matrix, where each column is a learned fMRI pattern (for PCA, NMF, and ICA this is the standard loading matrix; for SAEs it corresponds to the decoder weights);"
- Decoder weights: The parameters of an autoencoder’s decoder that map latent features back to voxel space. "for SAEs it corresponds to the decoder weights);"
- Encoding model: A model that predicts brain responses (e.g., fMRI) from images or features. "This includes encoding models that predict fMRI responses from images~\cite{Kay08,Naselaris11,beliy2024wisdom}"
- Extrastriate Body Area (EBA): A body- and action-selective region in lateral occipitotemporal cortex. "EBA is known to process bodies and actions;"
- Fusiform Face Area (FFA): A face-selective region in ventral temporal cortex associated with face processing. "the fusiform face area (FFA)"
- Image-to-fMRI encoder: A model that maps images to predicted fMRI responses. "employ the image-to-fMRI encoder of \citet{beliy2024wisdom} to predict fMRI responses for each subject."
- Independent Component Analysis (ICA): A statistical method that decomposes signals into maximally independent components. "Independent Component Analysis (ICA)~\cite{comon1994independent}"
- Loading matrix: In factor/decomposition models, the matrix specifying how components load onto observed variables. "for PCA, NMF, and ICA this is the standard loading matrix;"
- Natural Scenes Dataset (NSD): A large-scale 7T fMRI dataset of responses to diverse natural images. "We use the Natural Scenes Dataset (NSD)~\citep{allen2022massive}"
- Navigability: A scene property relating to layout and possible movement paths, used in scene-selective cortex analyses. "OPA is known to process scene layout and navigability;"
- Non-negative Matrix Factorization (NMF): A decomposition technique that factors data into nonnegative parts-based components. "Non-negative Matrix Factorization (NMF)~\cite{lee1999learning}"
- Occipital Place Area (OPA): A scene-selective visual region involved in processing scene layout. "OPA is known to process scene layout and navigability;"
- One-hot voxel basis: A baseline representation where each voxel is treated as its own unit/component. "effectively serving as a one-hot voxel basis."
- Parahippocampal Place Area (PPA): A scene/place-selective region implicated in processing environmental scenes and landmarks. "PPA encodes scenes and places (e.g., indoor/outdoor, landmarks)."
- Principal Component Analysis (PCA): A linear decomposition that captures directions of maximal variance in data. "Principal Component Analysis (PCA)~\cite{hotelling1933analysis}"
- Region of Interest (ROI): A predefined brain area used to constrain or organize analysis. "region of interest (``ROI'')"
- Retinotopic maps: Systematic mappings of visual field positions across cortical surface. "Early work targeted retinotopic maps and low-level features"
- Retinotopic organization: The spatial organization in visual cortex reflecting the layout of the visual field. "ICA has seen more limited use, mainly for demonstrating retinotopic organization and low-level visual mapping"
- Semantic coherence: The degree to which a set of images shares a common meaning or concept. "use the mean similarity as a proxy to semantic coherence."
- Sparse Autoencoder (SAE): An autoencoder trained with sparsity constraints (and often dimensional expansion) to yield interpretable features. "Sparse Autoencoders~\cite{cunningham2023sparseautoencodershighlyinterpretable} (SAEs)"
- V4: A mid-level visual cortical area involved in processing color and shape. "V4 is known to encode mid-level features (e.g., color, shape)."
- Vision–LLM (VLM): A multimodal model that connects images and text, used here for captioning and hypothesis verification. "We generate captions for these images using a VisionâLLM (VLM)"
- Voxel: A volumetric pixel; the basic 3D unit of fMRI measurement. "parceled into tiny volume elements (``voxels'')."
Collections
Sign up for free to add this paper to one or more collections.