- The paper introduces the adoption-side energy exposure envelope to quantify operational energy changes beyond traditional data centre consumption.
- It employs two attribution methods—economics-proportional and energy-relevance-weighted—to estimate robust, sector-specific net energy changes.
- The study finds net savings in commercial sectors but significant energy increases in industrial and transport sectors, urging a shift in energy planning.
AI-Driven Energy Transitions: Sectoral Heterogeneity and Net Outcomes
Overview
The paper "AI adoption induces divergent net energy changes across economic sectors" (2607.04016) presents a rigorous quantitative analysis of how AI adoption impacts operational energy consumption across the US economy. The authors introduce the concept of the "adoption-side energy exposure envelope," which is the total operational energy in sectors where AI deployment can effect meaningful change—not merely the energy consumed by AI infrastructure itself. The work sharply distinguishes between compute-side (data centre) energy consumption and the far larger, distributed sectoral energy flows potentially affected by AI-mediated transformation of work.
Results robustly demonstrate that AI adoption produces sectorally divergent net energy impacts: commercial sectors generally yield net savings, while industrial and transport sectors see clear net increases. These findings question the prevailing emphasis on compute-side energy planning, highlighting that the adoption-side footprint is both substantially larger and geographically heterogeneous.
Adoption-Side Energy Exposure Envelope
The methodological core is the mapping of occupation-level AI exposure—quantified through task-based measures of automatable and augmentable work—onto sector-level energy baselines. Two attribution approaches guide the quantification: an economics-proportional method (Approach A) and an energy-relevance-weighted method (Approach B). These bracket the plausible scope of exposure ranging from direct proportionality to nuanced relevance, ensuring methodological robustness.
Under Approach A, the theoretical energy exposure envelope in the US reaches 12.1 quadrillion BTU (Q), with current observed deployment exposing approximately 1.4 Q—already on par with 2023 US data-centre electricity consumption. Approach B, incorporating energy relevance at the occupation level, yields a range of 8.8 Q theoretical and 0.45 Q observed exposure. Most of the exposure centers on industrial (4.5 Q) and commercial (4.2 Q) sectors, with transport (3.4 Q) also substantial.
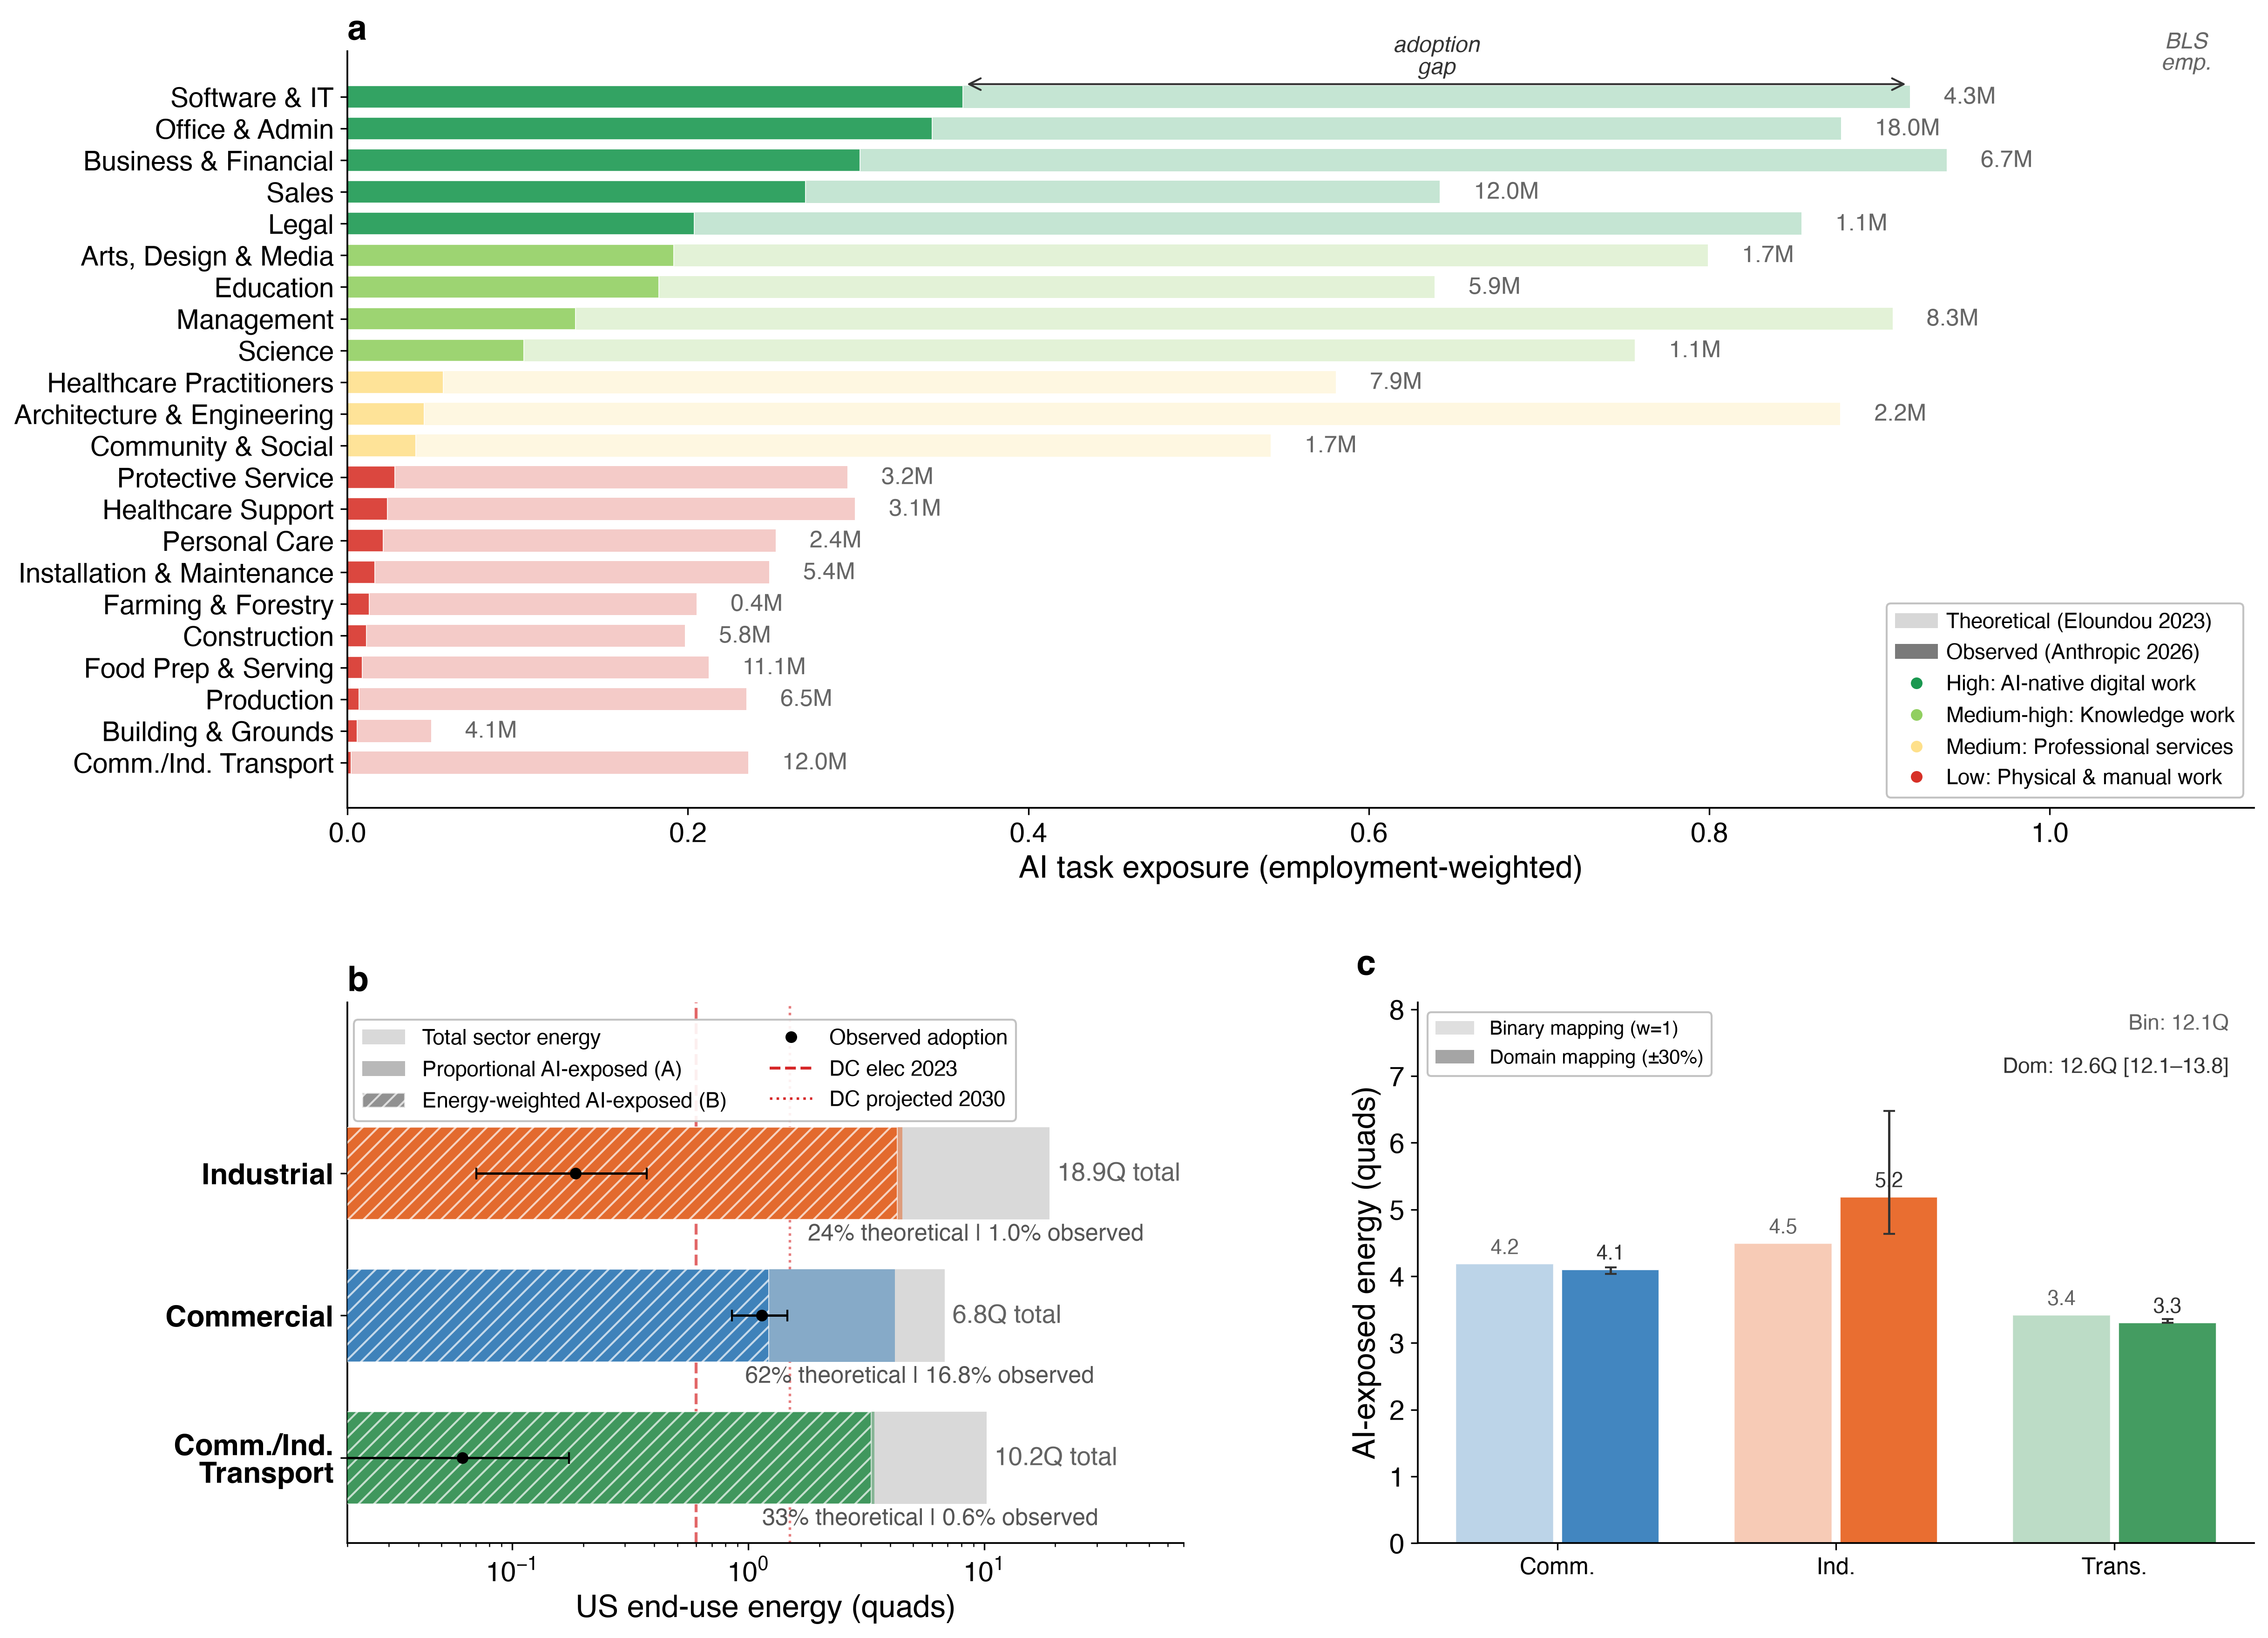
Figure 1: US adoption-side energy exposure envelope—SOC group exposures and sector-level breakdowns benchmarked against current and projected data-centre loads.
The sensitivity of this envelope to crosswalk and citation choices is limited; total envelope estimates remain stable across stress tests, and the divergence between A and B is localized, especially among knowledge-dominant commercial work.
Sector-Level Net Energy Effects: Efficiency, Rebound, and Mechanism
The analytic framework decomposes sectoral net energy change into three channels: efficiency gains per output unit, demand-induced rebound, and enablement (entirely new energy-consuming activity). The model integrates literature-calibrated priors on both efficiency and rebound, propagated through a Monte Carlo joint supply–demand decomposition.
- Commercial Sector: Characterized by inelastic demand and predominance of augmentation over substitution, this sector exhibits net energy savings of -0.22 Q (90% MC range [-0.50, +0.08]), with 88% robustness to parameter draws.
- Industrial Sector: Combining moderate substitutability with high demand elasticity, exhibits net energy increase of +1.25 Q (90% MC range [+0.49, +2.19]), robust across 99% of parameter draws.
- Transport Sector: Highest substitutability and demand elasticity, produces a net energy increase of +1.12 Q (90% MC range [+0.40, +2.02]), also robust at the 99% level.
The aggregate US net change converges at +2.16 Q (90% range [+0.52, +4.12]), severalfold above compute-side projections. Even under stringent assumptions (price-channel-only rebound), the effect remains more than double the current US data-centre electricity footprint.
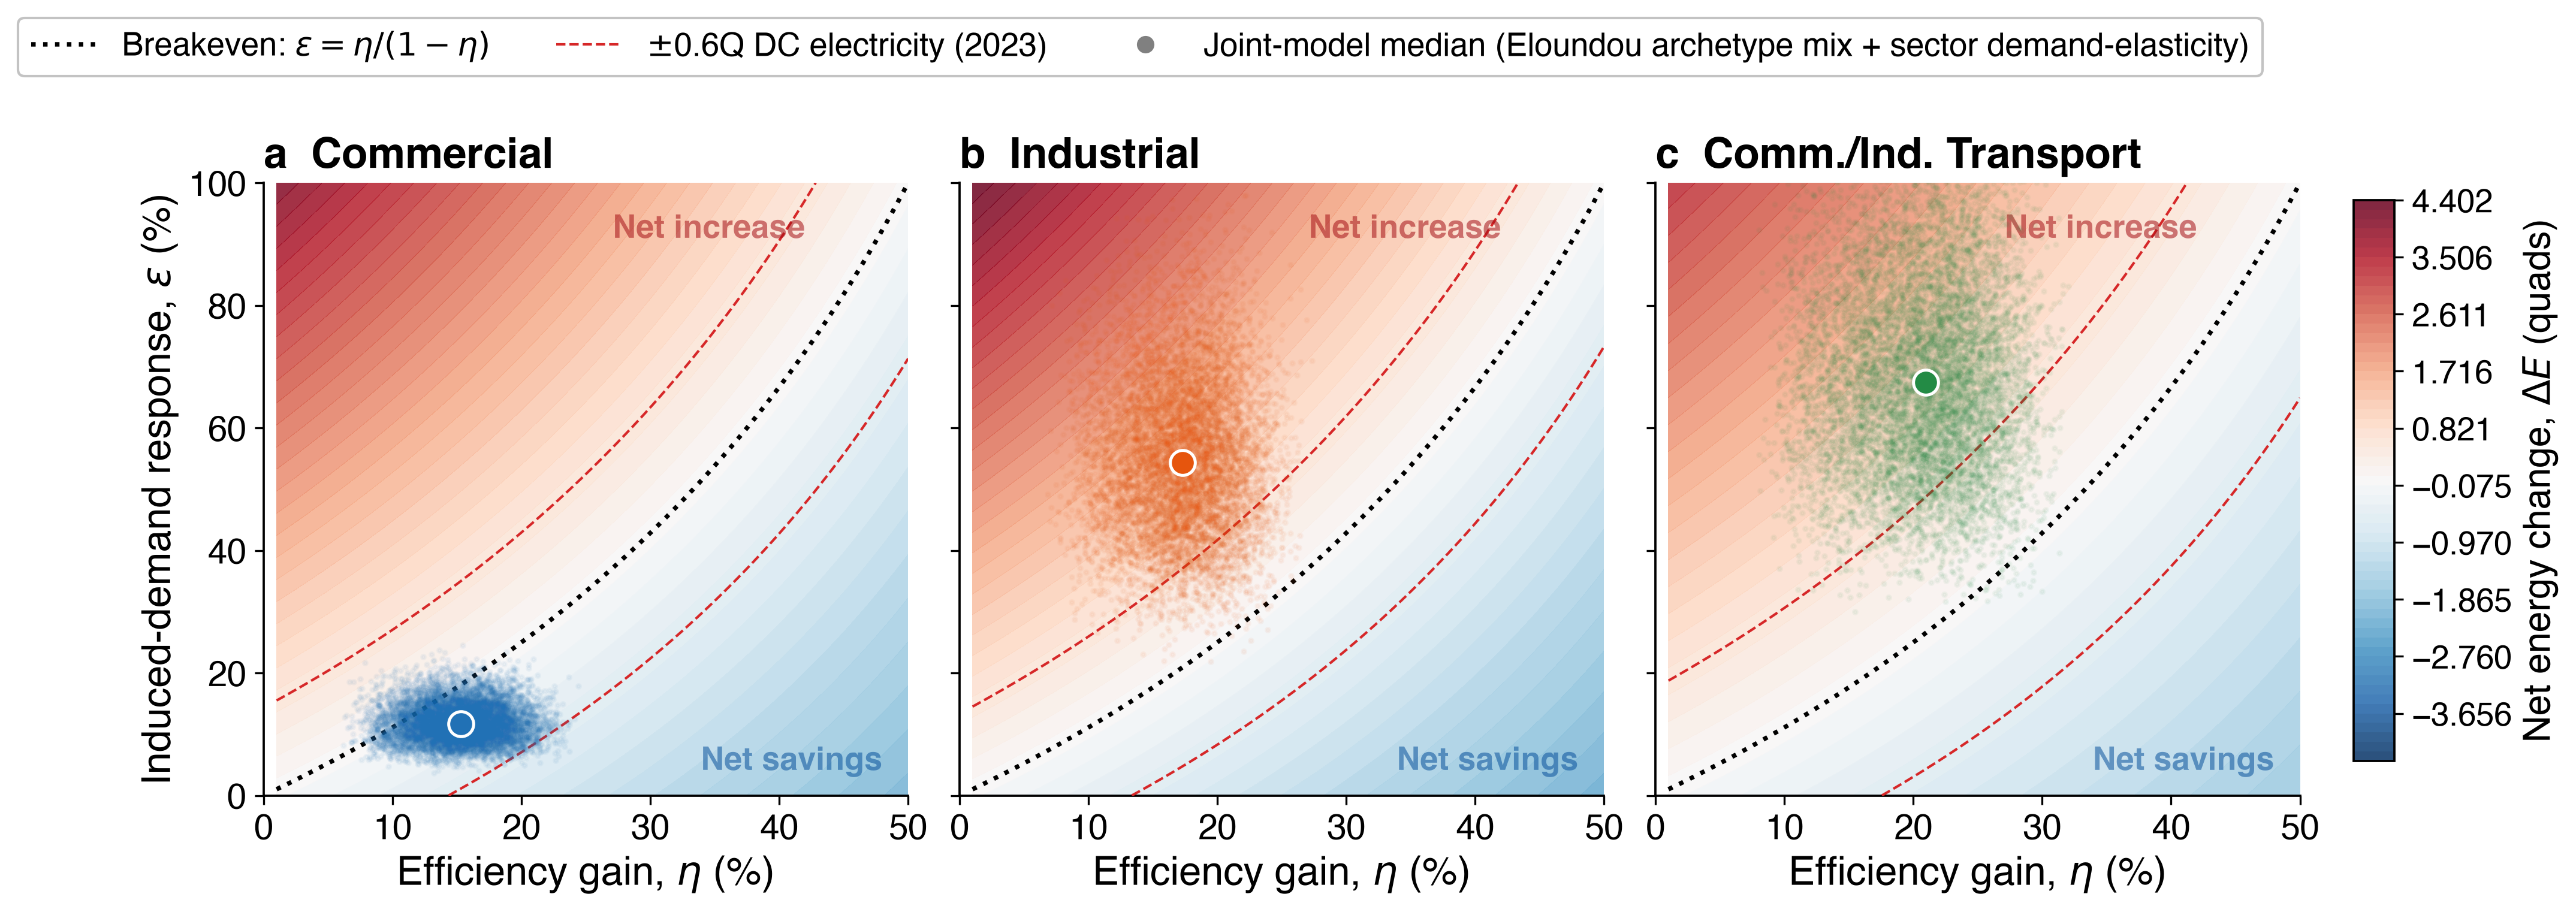
Figure 2: Net energy change under AI adoption as a function of efficiency and rebound; sector-specific Monte Carlo clouds with breakeven contours.
The sectoral thresholds for demand elasticity (λs∗) determining sign flips are clustered near 0.8—a value substantially surpassed by industrial and transport sectors, cementing their robust increase projection.
Enablement and substitution are not explicitly modeled for their decadal scales but are highlighted as additive and likely to accentuate the net increase, particularly outside commercial sectors.
Geographic and Jurisdictional Heterogeneity
The study finds substantial spatial heterogeneity in adoption-side energy impact, driven by each state's sectoral energy endowment and occupational mix. Industrial- and freight-intensive states (Texas, Louisiana, Indiana) absorb a disproportionate share of net increase, while commercial-heavy states (New York, Massachusetts, DC) see near-neutral or marginal increases.
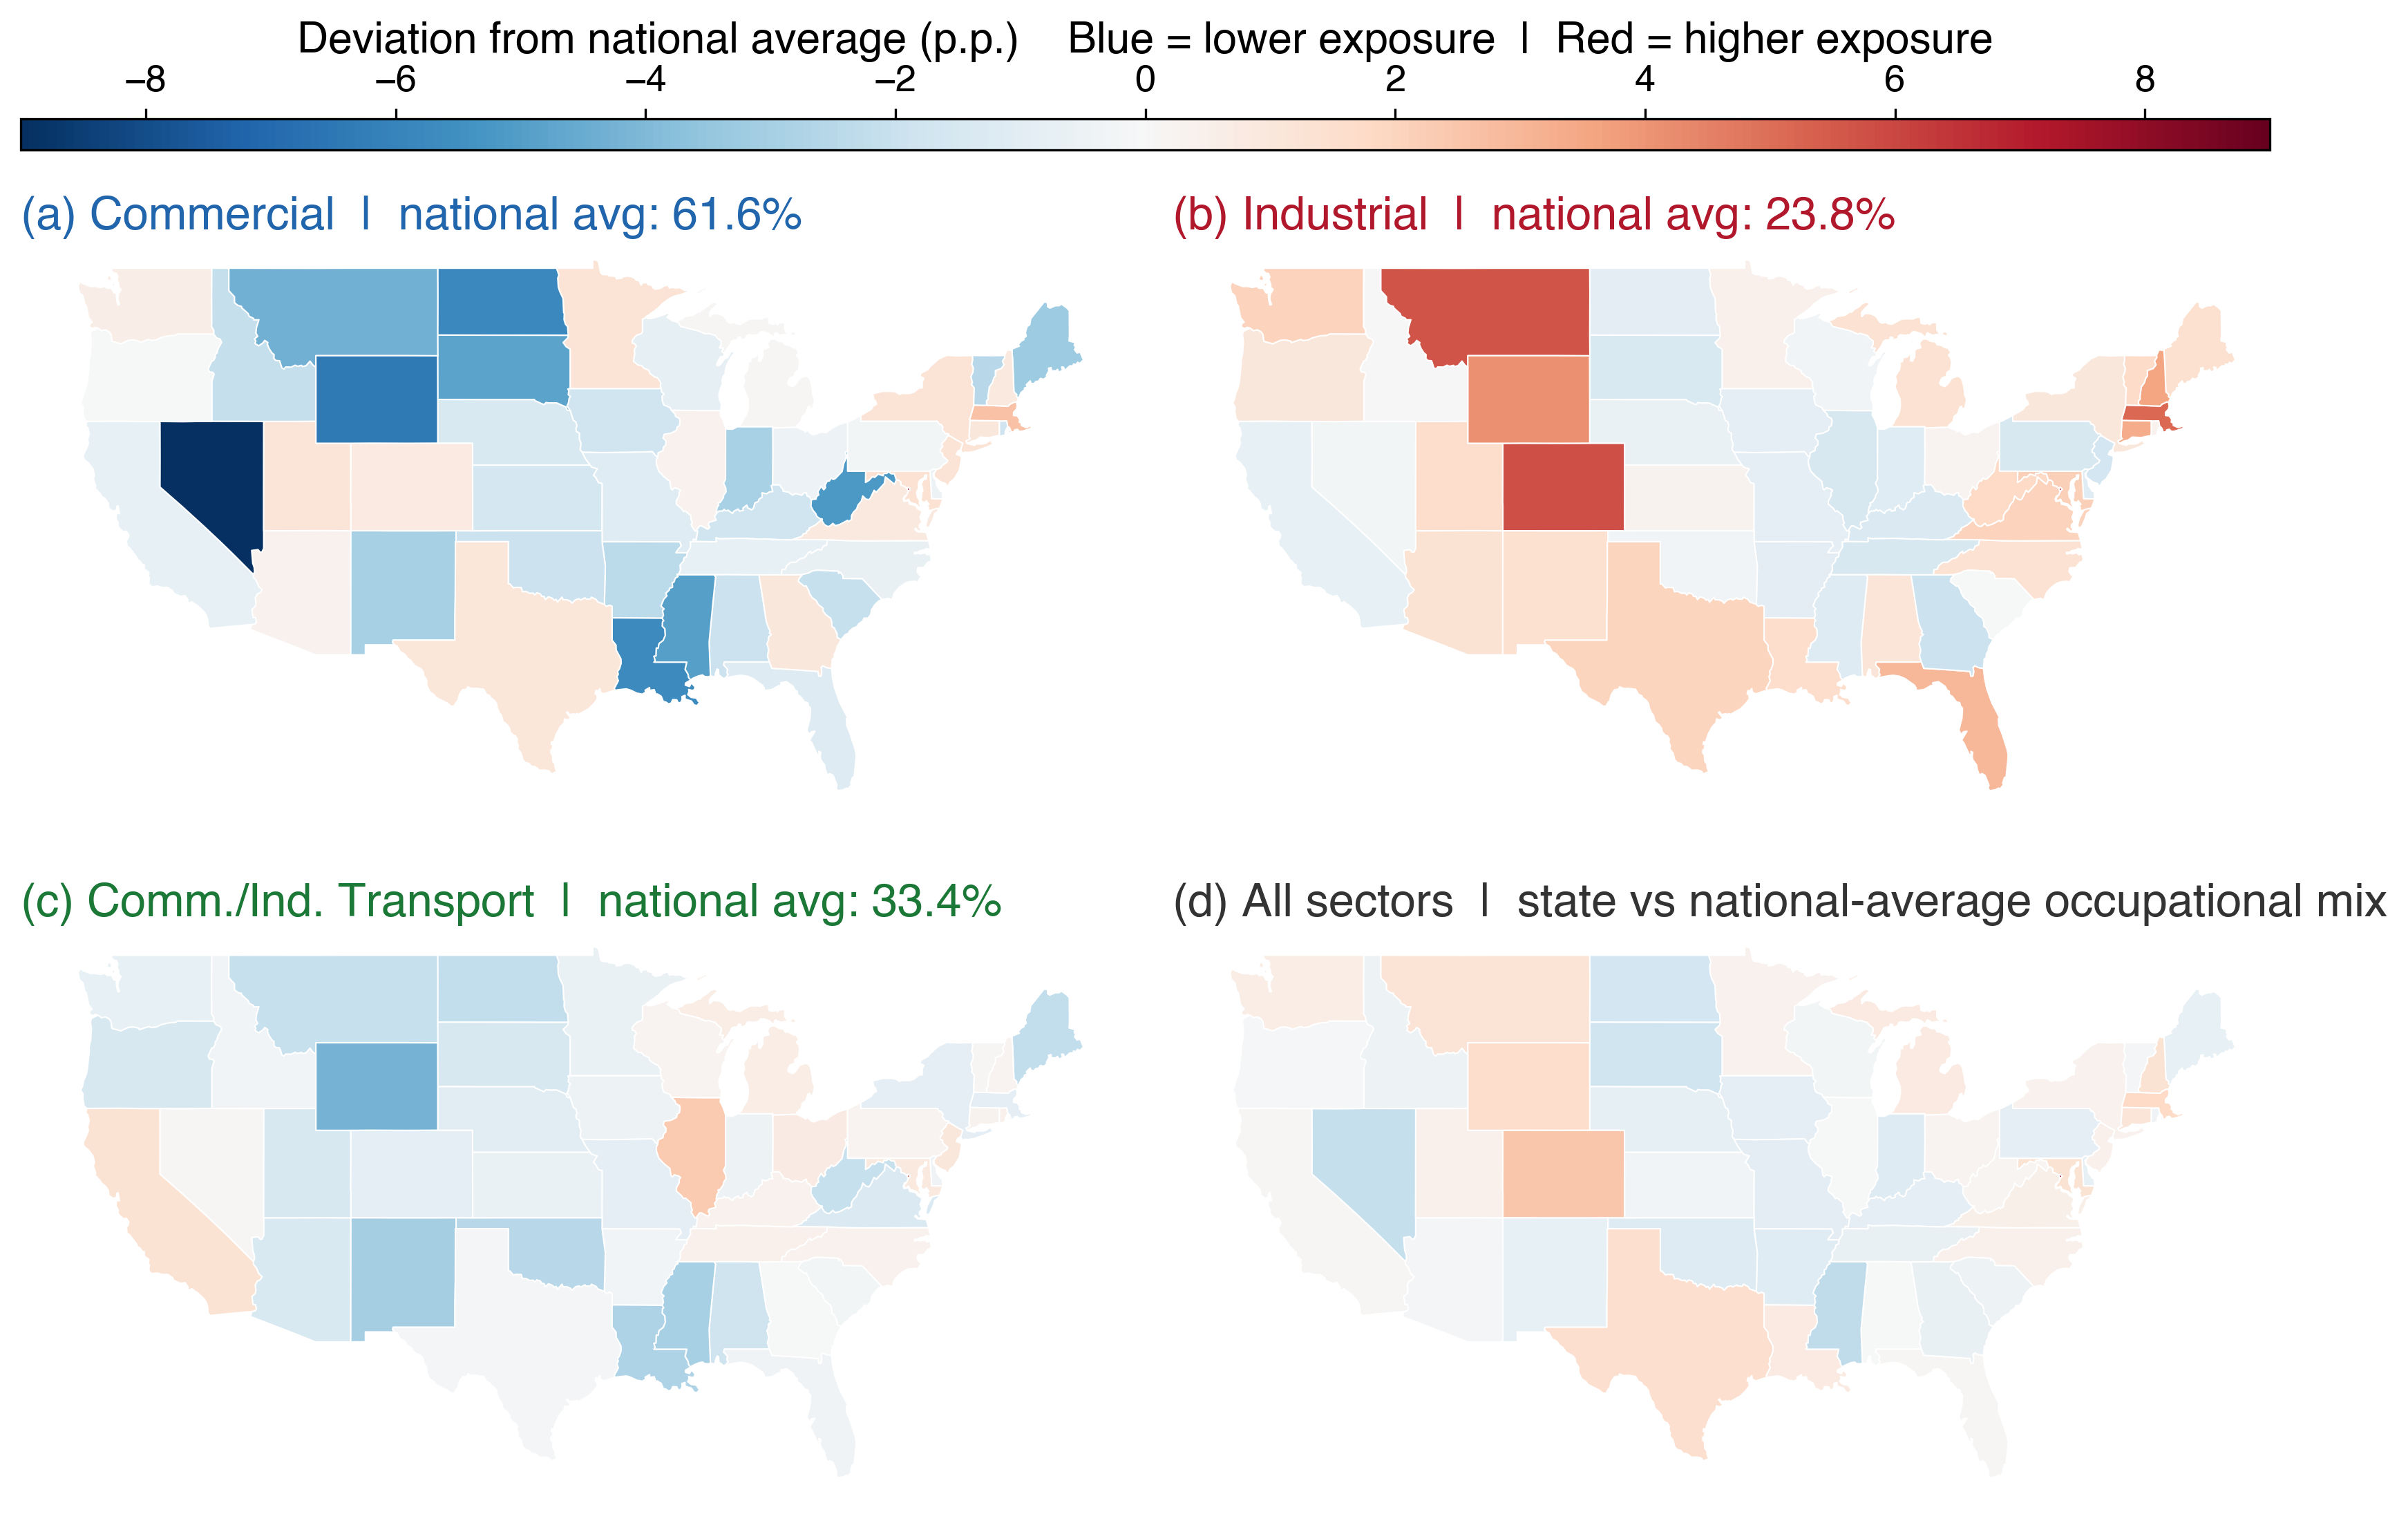
Figure 3: State-level deviation from the national average AI energy exposure, disaggregated by sector.
Cross-national extension to the UK yields compatible exposure patterns, with commercial, industrial, and transport sectors absorbing 67%, 38%, and 43% exposure rates, respectively (of a national 3.7 Q baseline). The mapping is structurally portable but depends on the granularity of regional occupational statistics.
Implications and Future Directions
The results challenge current policy and planning paradigms that focus almost exclusively on data-centre energy, which is likely to understate or misallocate energy system investments. The study argues for:
- Disaggregation of compute-side and adoption-side impacts in energy modeling.
- Integration of AI-deployment indicators in sectoral energy surveys to enable fine-grained tracking of operational shifts.
- Regionally resolved load projection, accounting for sectoral and geographic heterogeneity in both energy systems and emissions portfolios.
- Strategic grid planning to anticipate load-shape and fuel-mix changes induced by AI across non-compute sectors.
These recommendations underscore the need for upgraded statistical infrastructure—particularly high-resolution occupational data and facility-level AI deployment measurement—to overcome current observational limitations. Improved measurement will allow for calibration of rebounding and efficiency priors specifically for AI, which are inferred here from non-AI literatures.
Conclusion
This work offers a sectorally resolved, prior-robust framework for quantifying the adoption-side energy impact of AI, revealing fundamentally divergent outcomes: commercial savings, but strong, robust increases in industrial and transport sectors. These effects are geographically heterogeneous and significantly outweigh direct data-centre energy consumption. The results mandate a revised approach to infrastructure planning and policy, grounded in detailed sectoral and occupational tracking and attentive to operational, not only computational, energy transformation.
Future research should refine rebound and enablement estimation using AI-specific data, extend systematic measurement frameworks internationally, and integrate non-energy outcomes for a holistic view of AI-driven economic transitions.