Have Data Centers Raised Your Electric Bill? Causal Evidence from the United States
Abstract: We estimate that data centers caused average retail electricity rates to fall modestly in the United States from 2015 to 2024 using an instrumental variables approach. Despite prevailing sentiment, the finding is consistent with economic reasoning: existing large power system fixed costs, economies of scale in transmission and distribution, and declining unit costs for generation imply that durable demand growth lowers average prices. We find patterns of economies of scale for transmission, distribution, and generation costs as well as within and across retail customer classes. We caution that future supply constraints could reverse the effect.

Paper Prompts
Sign up for free to create and run prompts on this paper using GPT-5.
Top Community Prompts
Explain it Like I'm 14
Overview: What this paper is about
This paper asks a timely question: Have the many new data centers in the United States made people’s electricity bills go up or down? Even though many people worry that big data centers (which power things like cloud storage and artificial intelligence) will push prices up, the authors find the opposite for 2015–2024: on average, data centers slightly lowered the electricity price households pay.
Key questions the researchers wanted to answer
- Do data centers cause average retail electricity prices (especially for households) to go up or down?
- Why might adding big new electricity users lower prices in a system where we usually think “more demand means higher prices”?
- Are there “economies of scale” in the power system—that is, does the cost per unit of electricity go down when the system serves more electricity overall?
- Do effects spill over across customer types (like industrial customers affecting household bills), or across neighboring states?
How they studied it (in everyday terms)
To figure out cause-and-effect (not just correlation), the researchers used a few steps:
- They gathered public data on:
- Electricity sales and prices by state and year
- Utility costs for power plants and the grid (wires and transformers)
- Where and when data centers were built or expanded
- State population and economic size
- They looked for patterns showing “economies of scale”
- Think of the power grid like a school bus: the bus costs a lot to buy and maintain whether it’s half empty or full. If more students ride (more electricity is sold), the cost per student (per kilowatt-hour) can go down because the same fixed cost is shared by more riders.
- They used a technique called an instrumental variable (IV) to pin down causality
- Problem: Data center companies choose where to build. They might pick places with already-low expected prices, which would confuse the results.
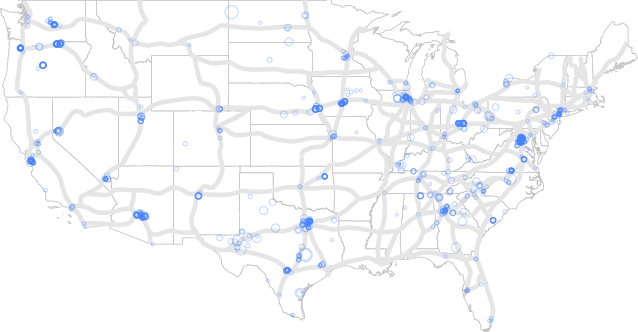
- Their clever workaround: They used the length of highway routes laid out in the 1947 Interstate Highway Plan in each state as a “tool” (the instrument). Why?
- Fiber-optic cables (internet backbones) often run along interstate highways.
- Good fiber makes a state attractive for data centers.
- Highways drawn up in 1947 don’t directly cause today’s electricity prices—but they do help predict where data centers go.
- By controlling for population and GDP, they block the obvious ways highways could influence prices (more people, more businesses), leaving fiber/internet as the main link to data center siting.
- In simple terms: They compared price changes in states that the old highway map made more attractive for data centers to states it didn’t, while holding other factors steady. This lets them estimate the effect of data centers on prices as if it were random.
- They checked robustness
- They tried different time windows (e.g., 2019–2024), different statistical controls (state vs. regional effects), and tested for “spillovers” to neighboring states.
Main findings and why they matter
- Data centers modestly lowered average residential electricity prices
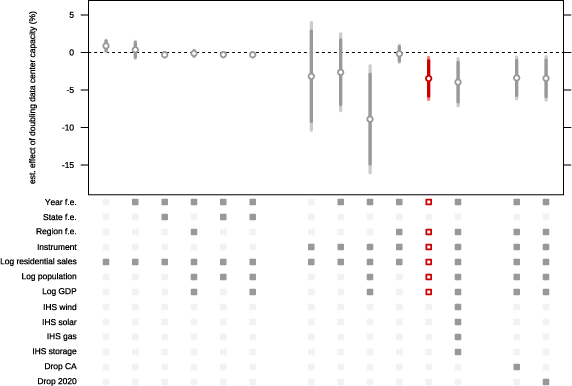
- Best causal estimate: Doubling data center capacity in a state is linked to about a 3.5% drop in household electricity prices (holding household usage fixed).
- Put another way: A 10% increase in data center capacity is linked to roughly a 0.4% decrease in average residential prices.
- From 2019–2024, the average residential customer lived in a state where data center capacity grew by about 160%, which the authors estimate caused roughly a 6% drop in their average electricity rate compared to what it would have been without that growth.
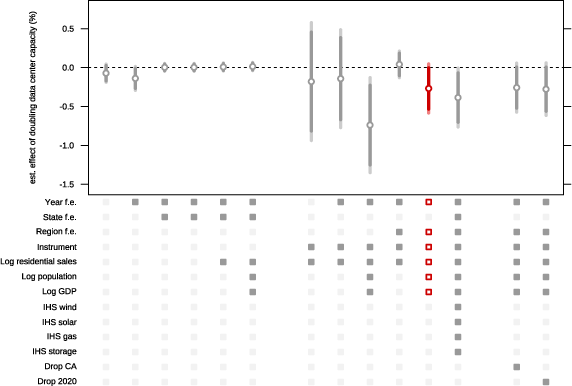
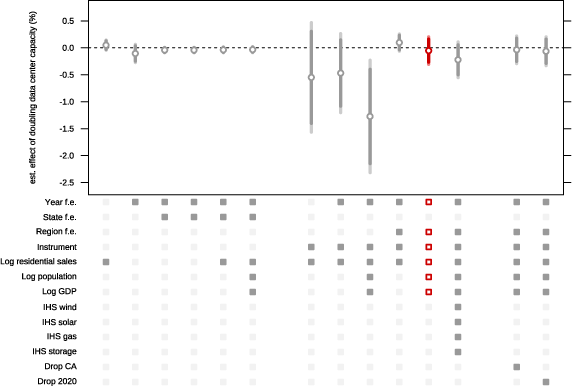
- Effects for commercial and industrial customers were smaller
- The biggest benefit showed up in residential rates.
- Why can more demand lead to lower average prices?
- The power system has lots of fixed costs (building and maintaining wires, transformers, and many parts of power plants). When more electricity flows over the same grid, those fixed costs are spread over more kilowatt-hours, lowering the average cost per unit.
- Newer power plants and technologies (like modern wind, solar, and efficient gas) often have lower costs than older ones. If demand grows steadily, the system invests in more efficient equipment, pushing average costs down further.
- Important distinction: The “price on the margin” (what the next unit costs in the short run) can go up during peak hours, but the “average price” customers pay also reflects those big fixed costs. Sharing those fixed costs across more sales can outweigh short-run bumps.
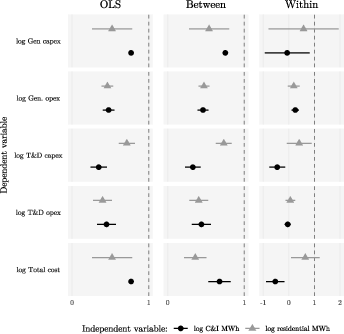
- Evidence of economies of scale across the grid
- As utilities serve more electricity, the cost per unit for:
- Transmission and distribution (the wires)
- Power plant investments and operations
- tends to grow more slowly than demand, and in some cases falls on a per-unit basis.
- They also found no broad evidence that one customer class (like households) routinely subsidizes another when demand grows.
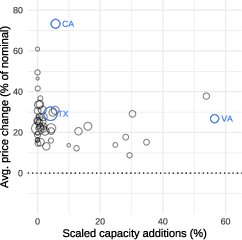
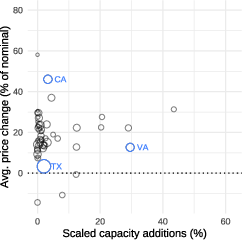
- Little sign of price increases where data centers grew the most
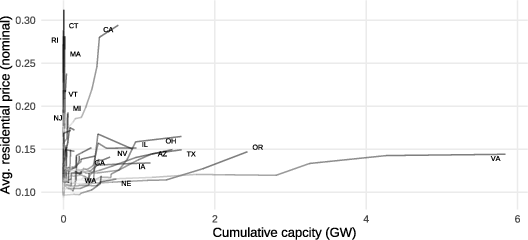
- For example, Virginia (with very large data center growth) did not see unusual price increases compared to the national average.
What this means going forward
- The optimistic take
- If the grid can keep building new capacity when needed, and if new equipment stays cost-effective, adding big steady users—like data centers—can help everyone by lowering average electricity prices, especially for households.
- This also hints that broader electrification (like more heat pumps and electric cars) could reduce average prices by spreading fixed costs, if managed well.
- The cautions
- Supply bottlenecks could flip the result:
- Equipment shortages (like transformers), backlogs for connecting to the grid, or higher costs for new power plants or solar panels could raise costs.
- If utilities overbuild for demand that doesn’t fully show up, the cost per unit could rise.
- Fuel price effects weren’t a main focus:
- National fuel markets (like natural gas) didn’t seem strongly affected by data centers in this period, but this could change under different market conditions.
Bottom line
For 2015–2024 in the United States, the paper finds that growth in data centers slightly lowered the average electricity prices paid by households. The main reason is that the power grid has large fixed costs, and spreading those costs over more electricity—combined with adding newer, often cheaper generation—can reduce average prices. However, this benefit depends on the grid’s ability to build and connect new capacity efficiently. If future constraints bite, the effect could reverse.
Knowledge Gaps
Knowledge gaps, limitations, and open questions
Below is a single, focused list of what remains missing, uncertain, or unexplored in the paper, framed to be actionable for future research.
- Instrument validity and exclusion: The 1947 Interstate Highway Plan may correlate with contemporary electricity prices through channels beyond population and GDP (e.g., long-run industrial structure, grid topology, fuel logistics, urbanization, regulatory history). Conduct falsification tests, add historical infrastructure controls (e.g., pre-1990 pipeline/rail density, legacy generation capacity), use Conley-style “plausibly exogenous” bounds, and report sensitivity of 2SLS estimates to residual instrument–outcome correlation.
- Weak-instrument risk in main specification: The first-stage F-statistic is <10 for the preferred IV in the full sample. Develop stronger or time-varying instruments (e.g., state-level fiber-route kilometers by year, 1990s telecom backbone nodes, pre-2010 internet exchange points, submarine cable landings × routing to data centers, shift-share using global hyperscaler rollouts × pre-period fiber density) and assess identification with overidentification tests.
- Loss of state fixed effects in IV stage: Because the IV is time-invariant, state FE cannot be included. Explore designs that preserve within-state identification (e.g., time-varying instruments, panel GMM, control-function with time-varying proxies for fiber buildout), or use border discontinuity designs near interstate corridors.
- Monotonicity and LATE interpretability: Clarify who the “compliers” are (states whose data center siting responds to interstate-linked fiber availability) and evaluate external validity (e.g., stratify by pre-period fiber intensity or siting policies).
- Measurement of data center demand: Outcomes use capacity additions and assume 50% utilization; pre-2015 capacity is missing for many sites. Validate with metered data where possible (utility special-contract billing, ISO LSE load, EPA eGRID for large customer IDs), incorporate PUE and ramp-up schedules, and bound estimates under alternative utilization paths.
- On-site/self-generation and backup: Quantify prevalence and energy shares of on-site generation and diesel backup that bypass grid sales; adjust demand measures or instrument for net-to-grid load to avoid bias.
- Outcome construction and rate design: Using log(revenue) conditional on sales proxies for average price but mixes volumetric and fixed charges, riders, and surcharges. Decompose fixed vs volumetric components using tariff datasets (eTariff, RAP/SEPA repositories), and test whether effects differ for fuel cost adjustment riders vs base rates.
- Customer-level incidence: The residential average masks distributional impacts (e.g., low-income customers, rural vs urban). Use utility-level or household microdata (RECS, smart-meter panels) to examine heterogeneity in bill impacts and rate design exposure.
- Time-varying confounders: State-year shocks like wildfire liabilities, storm hardening, decarbonization mandates, ROE changes, resource-adequacy procurement, net-metering reforms, and fuel cost pass-through mechanisms are not fully controlled. Incorporate policy indices, utility financial parameters, and cost-recovery mechanisms; include HDD/CDD weather controls to net out weather-driven cost variation.
- Structural break and pandemic/inflation shocks: 2019–2024 includes extraordinary shocks. Perform Chow tests and subperiod analyses (pre-2019 vs post-2019), and report stability of coefficients.
- Spillovers and market boundaries: State-adjacent “neighbor” spillovers are weakly identified. Redefine markets using ISO/RTO regions, NERC areas, or transmission transfer capacities; weight neighboring effects by intertie ATC/flowgate PTDFs; re-estimate with spatial econometric methods and spatial HAC errors.
- Mechanism decomposition: Evidence for economies of scale is correlational. Causally decompose contributions from generation vs transmission vs distribution capex/opex using utility-level Form 1 matched to data center exposure (e.g., event-study around DC commissioning) and instrumented segment-specific costs.
- Dynamic effects and lags: First-difference estimates near zero imply delayed pass-through. Estimate distributed lag models or event studies around commissioning dates to map impulse responses and time-to-effect.
- Nonlinearities and thresholds: Investigate whether effects diminish or reverse when reserve margins tighten, interconnection queues lengthen, or load additions exceed T&D headroom; estimate interactions with proxies for capacity constraints (reserve margin, queue backlog, transformer lead times, congestion metrics).
- Heterogeneity by market structure: Quantify differences between restructured vs vertically integrated jurisdictions, decoupling vs non-decoupling states, and utility ownership types (IOU vs muni/co-op). Stratified estimates can separate regulatory incidence and pass-through channels.
- Cross-class cost allocation: The paper finds smaller C&I effects but does not test cost-shifting under special contracts or economic-development riders. Collect data on data center-specific tariffs/riders, contributions to network upgrades, and allocation rules to assess whether benefits accrue disproportionately to residential customers.
- Wholesale vs retail components: Decompose retail price effects into wholesale energy/capacity vs T&D components using ISO market price data, RA/capacity market prices, and purchased-power costs to verify the hypothesized operating-margin and build-margin channels.
- National fuel price feedbacks: The paper sets aside natural gas price impacts. Bound or estimate these using structural gas–power models or instruments for exogenous gas supply shifts (e.g., LNG export capacity outages, pipeline incidents) to quantify indirect nationwide effects.
- Generalizability beyond the U.S. and to other loads: Test whether findings extend to other countries/markets and to different load shapes (EVs, heat pumps). Contrast results for flexible vs inflexible demand and for coincident vs off-peak load additions.
- Load shape and flexibility of data centers: Explicitly quantify how 24/7 flat load vs flexible load (demand response, load shifting) mediate price effects; use high-frequency data where available to isolate dispatch vs capacity effects.
- Policy endogeneity: Data center tax incentives and expedited permitting are correlated with pro-growth regulatory environments and cost recovery norms. Assemble a state-year database of DC-targeted incentives and permitting reforms and control or instrument for these.
- Geography and aggregation bias: State-level aggregation masks localized distribution constraints and upgrade costs. Re-run at utility service territory or county level using substation/feeder proximity to data centers and interconnection queue location data.
- Robustness to dominant states and sites: Test sensitivity to excluding top data center hubs (e.g., Virginia), high-cost outliers (e.g., California), or years with extreme shocks; report leave-one-out influence diagnostics.
- Control set completeness: Beyond population and GDP, add industry mix, per-capita income, housing stock electrification, renewable penetration, storage capacity, and weather to reduce omitted-variable bias.
- Treatment definition and timing: Use commissioning dates vs power-in dates; verify whether grid upgrades precede commissioning (leading effects). Cross-validate with interconnection agreements and utility construction work in progress (CWIP) schedules.
- Generation additions as controls vs mediators: Capacity additions are likely mediators of the data center effect. Implement causal mediation analysis to quantify indirect (generation mix) vs direct (T&D scale) effects rather than controlling them away.
- Reserve-margin and RA price measurement: Empirically estimate the “shadow cost of capacity” posited in the theory using RA/capacity market prices or utility IRP capacity costs and test the model’s inequality condition for price reductions.
- Spatial dependence in errors: Given regional shocks and interties, standard clustering by state may understate uncertainty. Employ spatial HAC or multi-way clustering (state × year) and report robustness.
- Classification uncertainty (C vs I): Data centers’ classification varies across states and time, and C&I sales are omitted as controls to avoid overcontrolling. Use utility account-level data or special-contract identifiers to isolate data center meters and avoid conflation with other C&I dynamics.
- Sample selection and representativeness: Form 1 covers IOUs and omits many merchant generation costs; EIA 861 analysis covers bundled service providers. Extend to munis/co-ops and retail-choice states (energy-only and wires-only providers) to test representativeness.
- External procurement by hyperscalers: Corporate PPAs, 24/7 clean-energy matching, and behind-the-meter storage may change wholesale and retail incidence. Incorporate corporate procurement datasets and match to DC locations to isolate their role.
- Placebo and pre-trend tests: Implement placebo outcomes (e.g., pre-2010 periods, unrelated sectors) and leads of data center growth to confirm absence of anticipatory or spurious relationships.
- Alternative regional definitions: Validate robustness of results to different region partitions (ISO/RTO, NERC, EIA census divisions) beyond US-REGEN regions.
- Reporting of elasticities with asinh: Provide effect-size translations under alternative scaling and baseline levels to facilitate comparison and policy interpretation.
- Welfare and bills, not just prices: Translate price elasticities into average household bill impacts (accounting for quantity responses) and quantify consumer surplus changes.
- Environmental and reliability co-impacts: Although outside the paper’s scope, jointly estimate effects on emissions, local criteria pollutants, outage frequency (SAIDI/SAIFI), and reliability margins to contextualize price results.
Practical Applications
Immediate Applications
Below are actionable uses that can be deployed now, drawing directly from the paper’s findings on economies of scale and the causal price impacts of data centers (DCs). The estimates imply roughly a 0.4% reduction in average residential retail prices for each 10% increase in DC capacity (OLS context), and about a 3–4% reduction with a doubling of DC capacity in the IV specification—where feasible conditions are met.
Policy and Regulation (Energy, Economic Development)
- Recalibrate siting policy away from blanket moratoria toward conditional approvals
- What to do: Replace moratoria with standards that condition approvals on (i) “no net rate increase” guardrails, (ii) minimum-bill commitments, and (iii) transparent interconnection milestones.
- Tools/workflows: Standardized “Large Load Agreement” templates that include minimum bills, evergreen term lengths, and clawbacks if realized load underperforms forecasts.
- Assumptions/dependencies: System not supply-constrained; accurate load forecasts; stable or declining incremental build costs for generation/T&D.
- Incorporate DC-driven economies of scale into IRPs and rate cases
- What to do: Use study elasticities to update testimony and planning assumptions about average price impacts of long-lived load additions; quantify benefits to residential customers explicitly.
- Tools/workflows: A “Load-to-Rate Impact Calculator” parameterized with the paper’s elasticities and local cost/queue conditions.
- Assumptions/dependencies: Demand growth is durable; T&D and generation fixed costs spread over more kWh; regulators allow timely cost recovery for prudent investments.
- Adopt cost allocation and contracting that protects ratepayers from forecast error
- What to do: Require minimum bills or long-term take-or-pay contracts for large loads to mitigate overbuild risk if DCs ramp slower than expected.
- Tools/workflows: Contract playbooks for “Rate Safeguard Clauses” and “Capacity Reservation” charges.
- Assumptions/dependencies: Enforceability of contracts; regulatory approval; prudent risk-sharing frameworks.
- Interconnection and “speed-to-power” transparency
- What to do: Publish queue metrics; create fast-track pathways for large, schedulable loads that can tolerate curtailment windows.
- Tools/workflows: Queue dashboards and SLAs; standard curtailment service products for DCs.
- Assumptions/dependencies: ISO/RTO/utility data availability; ability to offer curtailable products without harming reliability.
Utilities and Grid Planners (Energy, T&D)
- Plan proactive T&D upgrades where economies of scale are strongest
- What to do: Target “slack-capacity” corridors for incremental investments to absorb DC load while reducing average costs per kWh.
- Tools/workflows: “Grid Economies-of-Scale Screener” combining T&D fixed-cost intensity, asset utilization, and location of fiber/highway corridors.
- Assumptions/dependencies: Equipment availability (transformers, switchgear); financeable capex; timely permitting.
- Rate design that shares gains from scale while aligning cost causation
- What to do: Maintain volumetric recovery of appropriate fixed costs while adding minimum-bill floors for DCs; preserve cross-class fairness (paper finds limited cross-subsidization).
- Tools/workflows: Tariff modules that simulate average price trajectories with and without DC growth.
- Assumptions/dependencies: Regulatory acceptance; robust metering and cost accounting.
Data Center Developers and Cloud Providers (Technology, Energy)
- Community and regulator engagement with quantified residential rate benefits
- What to do: Include rate-impact analyses in siting proposals; offer minimum-bill contracts and funding for local T&D reinforcements.
- Tools/workflows: “Community Rate Benefit Briefs” that translate IV elasticities into projected local bill impacts.
- Assumptions/dependencies: Realization of planned load; absence of severe supply constraints that could reverse effects.
- Siting strategy aligned to grid economics
- What to do: Prioritize locations with strong fiber (often along interstate corridors), available interconnection, and headroom for economies of scale.
- Tools/workflows: Siting decision engines integrating highway/fiber layers, queue speed-to-power metrics, and regional rate baselines.
- Assumptions/dependencies: Continued correlation between corridors and fiber; reliable interconnection timelines; stable local policy.
Finance and Insurance (Energy, Infrastructure)
- Update underwriting for rate trajectory and policy risk
- What to do: Adjust WACC and tariff risk models to reflect lower average price risk where DC growth is strong and supply constraints are manageable.
- Tools/workflows: “Rate Trajectory Risk Scoring” that weights demand durability, supply-chain tightness, and interconnection risk.
- Assumptions/dependencies: Materiality of economies-of-scale relative to fuel price volatility; regulatory stability.
Academia and Analytics (Economics, Energy Systems, Public Policy)
- Replicate and extend the IV approach and “build margin” framing
- What to do: Use the 1947 Interstate Highway Plan as a proxy for fiber availability to study other digital-load effects; include build-margin effects (not only operating margin) in rate and emissions models.
- Tools/workflows: Open-source notebooks implementing two-stage least squares with weak-IV-robust inference; teaching modules on build vs. operating margins.
- Assumptions/dependencies: Data access (FERC Form 1, EIA 861, DC capacity datasets); validity of the exclusion restriction after controlling for GDP and population.
Households and Small Businesses (Daily Life)
- Decision support for electrification
- What to do: Use the evidence to counter fears of across-the-board bill spikes when evaluating EVs and heat pumps.
- Tools/workflows: Consumer-facing “Rate Outlook” explainers showing that durable, well-planned load growth can reduce average prices.
- Assumptions/dependencies: Local conditions match study context; no acute supply constraints; utility passes scale benefits through rates.
Long-Term Applications
These opportunities require additional research, scaling, policy change, or supply-chain normalization to fully realize benefits and avoid reversals of the price-decreasing effect.
System Expansion and Flexibility (Energy, Software, Data Centers)
- Flexible computing as a grid resource
- What to build: Market products for flexible AI workloads (e.g., batch inference/training that shifts across hours/days), enabling DCs to provide demand response and capacity services.
- Potential products: “Compute Flex” tariffs; APIs that align workload schedulers with wholesale price signals and grid constraints.
- Assumptions/dependencies: Reliable workload-shaping capabilities; ISO/RTO products compensating flexibility; SLAs that tolerate deferral/curtailment.
- Co-location with renewables/storage and heat reuse
- What to build: DC campuses paired with storage and renewables; thermal networks using DC waste heat for district heating or industrial processes.
- Potential products: “Power+Compute Parks” with integrated PPAs and thermal offtake contracts.
- Assumptions/dependencies: Permitting certainty; bankable offtake; thermal demand density; water and environmental constraints.
Transmission and Supply Chain (Energy, Manufacturing, Policy)
- Resolve supply constraints to preserve price benefits
- What to do: Incentivize domestic transformer and high-voltage component manufacturing; streamline federal permitting for T&D and generation along existing right-of-way corridors (often overlapping with interstate highways).
- Potential products: “Transformer-as-a-Service” programs; pooled procurement to reduce lead times and costs.
- Assumptions/dependencies: Industrial policy execution; trade/tariff stability; coordinated regional transmission planning.
- Multi-state transmission planning that mirrors demand corridors
- What to do: Plan interregional lines along highway/fiber corridors that already signal economic activity and DC siting.
- Tools/workflows: Corridor-aware transmission siting models integrating load growth and economies-of-scale effects on average prices.
- Assumptions/dependencies: Interstate coordination; cost allocation agreements; environmental review reforms.
Market Design and Regulation (Energy, Finance)
- Resource adequacy and capacity remuneration that reflects the build margin
- What to do: Evolve RA/capacity constructs to appropriately value new capacity that lowers average costs for growing systems.
- Potential products: Capacity-lambda reflective pricing; long-term forward RA procurement aligned to durable loads.
- Assumptions/dependencies: Accurate valuation of capacity benefits; alignment with decarbonization goals.
- Rate stabilization and risk-sharing instruments
- What to do: Create “Rate Stabilization Agreements” and “Capacity Reservation Contracts” for large loads, balancing protection for ratepayers with investment certainty for developers.
- Potential products: Insurance-backed minimum-bill riders; indexed charges tied to realized load factors.
- Assumptions/dependencies: Credible measurement and verification; regulatory acceptance; predictable load trajectories.
Research and Modeling (Academia, Think Tanks, System Operators)
- Incorporate build-margin dynamics into marginal emissions and rate models
- What to do: Develop long-run marginal emissions frameworks that endogenize new capacity triggered by durable demand; estimate heterogeneous treatment effects by region and technology mix.
- Tools/workflows: Open datasets and model code linking IRP/expansion planning with retail rate formation and emissions trajectories.
- Assumptions/dependencies: Data granularity; plausible technology cost paths; robust identification of spillovers.
- Quantify national fuel price feedbacks and cross-border effects
- What to do: Model how DC-driven electricity demand impacts natural gas markets in a globally connected context, under different LNG export constraints.
- Tools/workflows: Gas–power co-integration models with scenario analysis for export capacity and geopolitical shocks.
- Assumptions/dependencies: Export policy; global commodity dynamics; electrification scale.
Communities and Workforce (Daily Life, Education, Economic Development)
- Local benefit-maximizing DC development
- What to do: Use evidence-backed narratives to negotiate community benefits (training, tax base, infrastructure co-investments) while maintaining guardrails that prevent bill increases.
- Tools/workflows: “Community Impact Planners” that integrate rate impacts, jobs, and infrastructure upgrades.
- Assumptions/dependencies: Authentic stakeholder engagement; cross-agency coordination; enforceable community agreements.
Notes on feasibility across applications
- Core assumptions from the paper underpinning most applications:
- Economies of scale in T&D and generation are realized in practice (fixed costs spread over more kWh).
- Durable load growth materializes (i.e., DC utilization does not significantly underperform).
- New capacity can be added without prolonged, pervasive supply constraints (transformers, turbines, PV, etc.).
- Incremental generation mix remains cost-competitive with incumbent average costs.
- Proper cost allocation and rate design ensure that gains are passed through to households and small businesses.
- Key dependencies and risks:
- Acute supply chain or permitting constraints can reverse price benefits.
- Overbuilding ahead of realized load can elevate average costs temporarily or persistently.
- Regional heterogeneity means effects may differ where grids are constrained or fuel prices volatile.
- Communicated price benefits rely on robust data and transparent tracking to maintain public trust.
Glossary
- Anderson-Rubin test: A hypothesis test for IV estimators that remains valid under weak instruments. "The Anderson-Rubin test---which is robust to weak instruments (F = 7.8 in the preferred specification)---is significant at the 0.1\% level, clearly rejecting positive effects."
- Amortized capital cost: The per-unit cost of capital spread over the output or time horizon. "thus lowering the amortized capital cost of generation per kWh."
- Build margin: The long-run margin reflecting the effects of adding new capacity when estimating impacts of persistent demand changes. "Our results underline the importance of the ``build margin'' when estimating the effect of long-lived demand."
- Capacity expansion problem: The optimization of when and how much new capacity to build and retire to minimize total system costs over time. "In the long-run, the system planner solves the capacity expansion problem, minimizing the present value of total costs by choosing investments in new capacity () and capacity retirements ()"
- Capacity lambda: The market-clearing shadow price for the capacity (resource adequacy) constraint. "or the market clearing ``capacity lambda''."
- Capital expenditures (capex): Utility investments in long-lived assets like generation, transmission, and distribution. "the four largest sub-categories of power systems costs---capital expenditures (capex) and operational expenditures (opex) of both transmission and distribution (T{paper_content}D) and generation"
- Clustered standard errors: Standard errors adjusted for correlation within clusters (e.g., states) over time. "All standard errors are robust to heteroskedasticity and are clustered by state to account for serial correlation."
- Cointegration: A statistical property where nonstationary series move together over time, implying a stable long-run relationship. "which has co-integrated natural gas prices with international oil and coal markets"
- Commercial and Industrial (C&I): Utility customer classes comprising business and industrial loads. "C{paper_content}I demand from neighboring states is associated with decreasing residential and increasing C{paper_content}I prices"
- CONUS: The contiguous United States, excluding Alaska and Hawaii. "To investigate power system costs, we use data collected by the Federal Energy Regulatory Commission (FERC) Form 1 for CONUS."
- Cross-price elasticity: The responsiveness of one variable (here, prices) to changes in another (data center capacity), expressed in percentage terms. " is our coefficient of interest and is interpreted as the cross-price elasticity of data centers"
- Dispatch curve: The supply stack ordering generators by marginal cost used to meet demand. "shifting the dispatch curve outward and lowering marginal variable cost."
- EIA Form 861: U.S. Energy Information Administration survey of retail electricity sales, revenues, and related data. "Retail revenue and sales come from US Energy Information Administration (EIA) Form 861"
- Elasticity: A unit-free measure of percentage responsiveness of one variable to another. "We also estimate spillover effects from neighboring states and find an elasticity of 0.007"
- Endogeneity: When an explanatory variable is correlated with the error term, biasing causal estimates. "However, these correlations do not establish causality due to omitted variable bias from endogenous selection into states"
- Envelope theorem: A result that simplifies how optimal values change with parameters, used to derive cost changes from demand shocks. "Using the envelope theorem,\footnote{}"
- Exclusion restriction: The IV assumption that the instrument affects the outcome only through the endogenous regressor. "By conditioning on state population and GDP, we block the first two channels, thus satisfying the exclusion restriction for instrumental variables."
- FERC Form 1: Federal Energy Regulatory Commission financial and operational data collected from large utilities. "To investigate power system costs, we use data collected by the Federal Energy Regulatory Commission (FERC) Form 1 for CONUS."
- First differences estimator: An estimator using changes over time to control for fixed unobserved factors. "In the Supplemental Appendix we provide robustness checks using the first differences estimator"
- First-stage F statistic: A diagnostic for instrument strength in IV/2SLS regressions. "The first-stage F statistic is less than 10 (a commonly used though imperfect critical value for weak instruments)"
- Fixed effects: Controls for unobserved, time-invariant differences across entities (e.g., states or utilities) or common time shocks. "Columns 2 and 5 compare changes within states by using both year and state fixed effects."
- Heteroskedasticity: Non-constant variance of errors across observations, affecting standard error validity. "All standard errors are robust to heteroskedasticity and are clustered by state to account for serial correlation."
- Hyperscale operators: Very large data center operators building at massive scale. "a period that also coincides with the rapid expansion of hyperscale operators."
- Instrumental variables (IV): A method for causal inference using external variation linked to the endogenous regressor but not directly to the outcome. "We estimate that data centers caused average retail electricity rates to fall modestly in the United States from 2015 to 2024 using an instrumental variables approach."
- Interconnection queue: The backlog of projects awaiting grid connection studies and approvals. "utilities that clear interconnection queues faster have higher capacity to update their infrastructure"
- Inverse hyperbolic sine: A transformation similar to the log that accommodates zeros, often used to interpret coefficients as elasticities. "The inverse hyperbolic sine behaves similarly to the natural log, allowing us to estimate elasticities, but, unlike the natural log, allows for zeros in the data"
- Investor-owned utility: A privately owned electricity utility regulated by public commissions. "The utilities represented in these data are exclusively large investor-owned utilities."
- Levelized cost of capital: The annualized cost of capacity investment per unit, net of operating savings, used in long-run adequacy considerations. "the levelized cost of capital for capacity net of the savings provided by shifting the dispatch curve outwards"
- Load shape: The temporal pattern of electricity demand across times of day, week, or year. "this study has abstracted away from the load shapeâthe pattern of load demand within a day, week, and yearâof hypothetical new demand."
- Marginal variable cost: The incremental operating cost of producing one more unit of electricity, excluding fixed capital costs. "the current marginal variable cost of electricity"
- Natural monopoly: An industry where high fixed costs and network characteristics make single-firm provision most efficient. "due to the natural monopoly of distribution networks and high fixed costs throughout the system"
- NERC (North American Electric Reliability Corp): The organization overseeing grid reliability standards and assessments in North America. "These regions roughly correspond to North American Electric Reliability Corp (NERC) Reliability Assessment Areas."
- Omitted variable bias: Bias in estimated effects due to unobserved factors correlated with included regressors. "do not establish causality due to omitted variable bias from endogenous selection into states"
- Operating margin: The short-run margin reflecting dispatch changes without new investments. "existing studies that exploit short-run random variation are only able to capture the dispatch effect (``operating margin'')"
- Ordinary least squares (OLS): A regression method minimizing squared residuals, sensitive to endogeneity. "An IV approach is required to adjudicate between hypotheses."
- Panel data: Multi-dimensional data following the same entities across time. "Using our panel of large investor-owned utilities"
- Reserve margin: The required capacity buffer above expected demand to ensure reliability. "The second constraint ensures that capacity satisfies the required reserve margin, denoted by ."
- Resource adequacy constraint: The requirement that capacity meets demand plus reserves to maintain reliability. "the shadow cost of the resource adequacy constraint"
- Shadow cost: The implicit value (Lagrange multiplier) of relaxing a constraint in an optimization problem. "the shadow cost of the resource adequacy constraint"
- Spillover effects: Impacts that extend beyond the directly affected unit, such as to neighboring states. "We also estimate spillover effects from neighboring states"
- Speed-to-power: Industry term for the time required to connect new load to the grid. "The trade press consistently identify ``speed-to-power'' as the dominant factor in siting decisions."
- Transmission and Distribution (T&D): The network infrastructure delivering electricity from generators to end users. "capital expenditures (capex) and operational expenditures (opex) of both transmission and distribution (T{paper_content}D) and generation"
- Two-stage least squares (2SLS): An IV estimation procedure using a first-stage prediction of the endogenous regressor. "We estimate regression \ref{eq:reg} using ordinary least squares (OLS) and two-stage least squares (2SLS) using an instrumental variable (IV)."
- US-REGEN model: A regional U.S. energy-economy equilibrium model used for policy and planning analyses. "U.S. Regional Economy, Greenhouse Gas, and Energy Model (US-REGEN) energy-economy quantitative equilibrium model"
- Vertically integrated utility: A utility that owns generation, transmission, and distribution assets within one organization. "represents a planner that serves all three components of the system (similar to a vertically integrated utility)"
- Weak instruments: Instruments with low explanatory power for the endogenous regressor, which can invalidate conventional IV inference. "which is robust to weak instruments"
Collections
Sign up for free to add this paper to one or more collections.