- The paper develops a comprehensive IV-based framework to accurately estimate gas demand elasticity on Ethereum L1 and Arbitrum L2.
- It finds Ethereum L1 to be nearly inelastic while Arbitrum L2 is six times more fee-responsive, with marked sensitivity in storage growth and refund operations.
- Clustering analysis reveals significant wallet behavioral heterogeneity, offering actionable insights for optimizing fee mechanism designs and resource pricing.
Price Elasticity of Gas Demand on L1 and L2: Evidence from Ethereum and Arbitrum
Overview
This paper develops a comprehensive empirical framework for the identification and estimation of the price elasticity of on-chain gas demand using granular panel data from Ethereum mainnet (L1) and Arbitrum One (L2). Through the systematic application of IV and panel-data econometric techniques, the study rigorously quantifies both aggregate and resource-level demand responses to gas fee fluctuations, reveals substantive behavioral heterogeneity among wallet populations, and distinguishes between extensive and intensive margin effects. The results inform both the practical calibration of fee mechanism designs and the theoretical understanding of blockchain resource allocation under congestion pricing.
Econometric Identification and Methodology
Estimation of gas demand elasticity is confounded by severe simultaneity and omitted-variable bias: congestion-induced fee increases and concurrent demand surges co-move, producing upward bias in naïve OLS elasticity estimates, as visualized in the raw (log gas, log fee) scatter on Arbitrum L2.
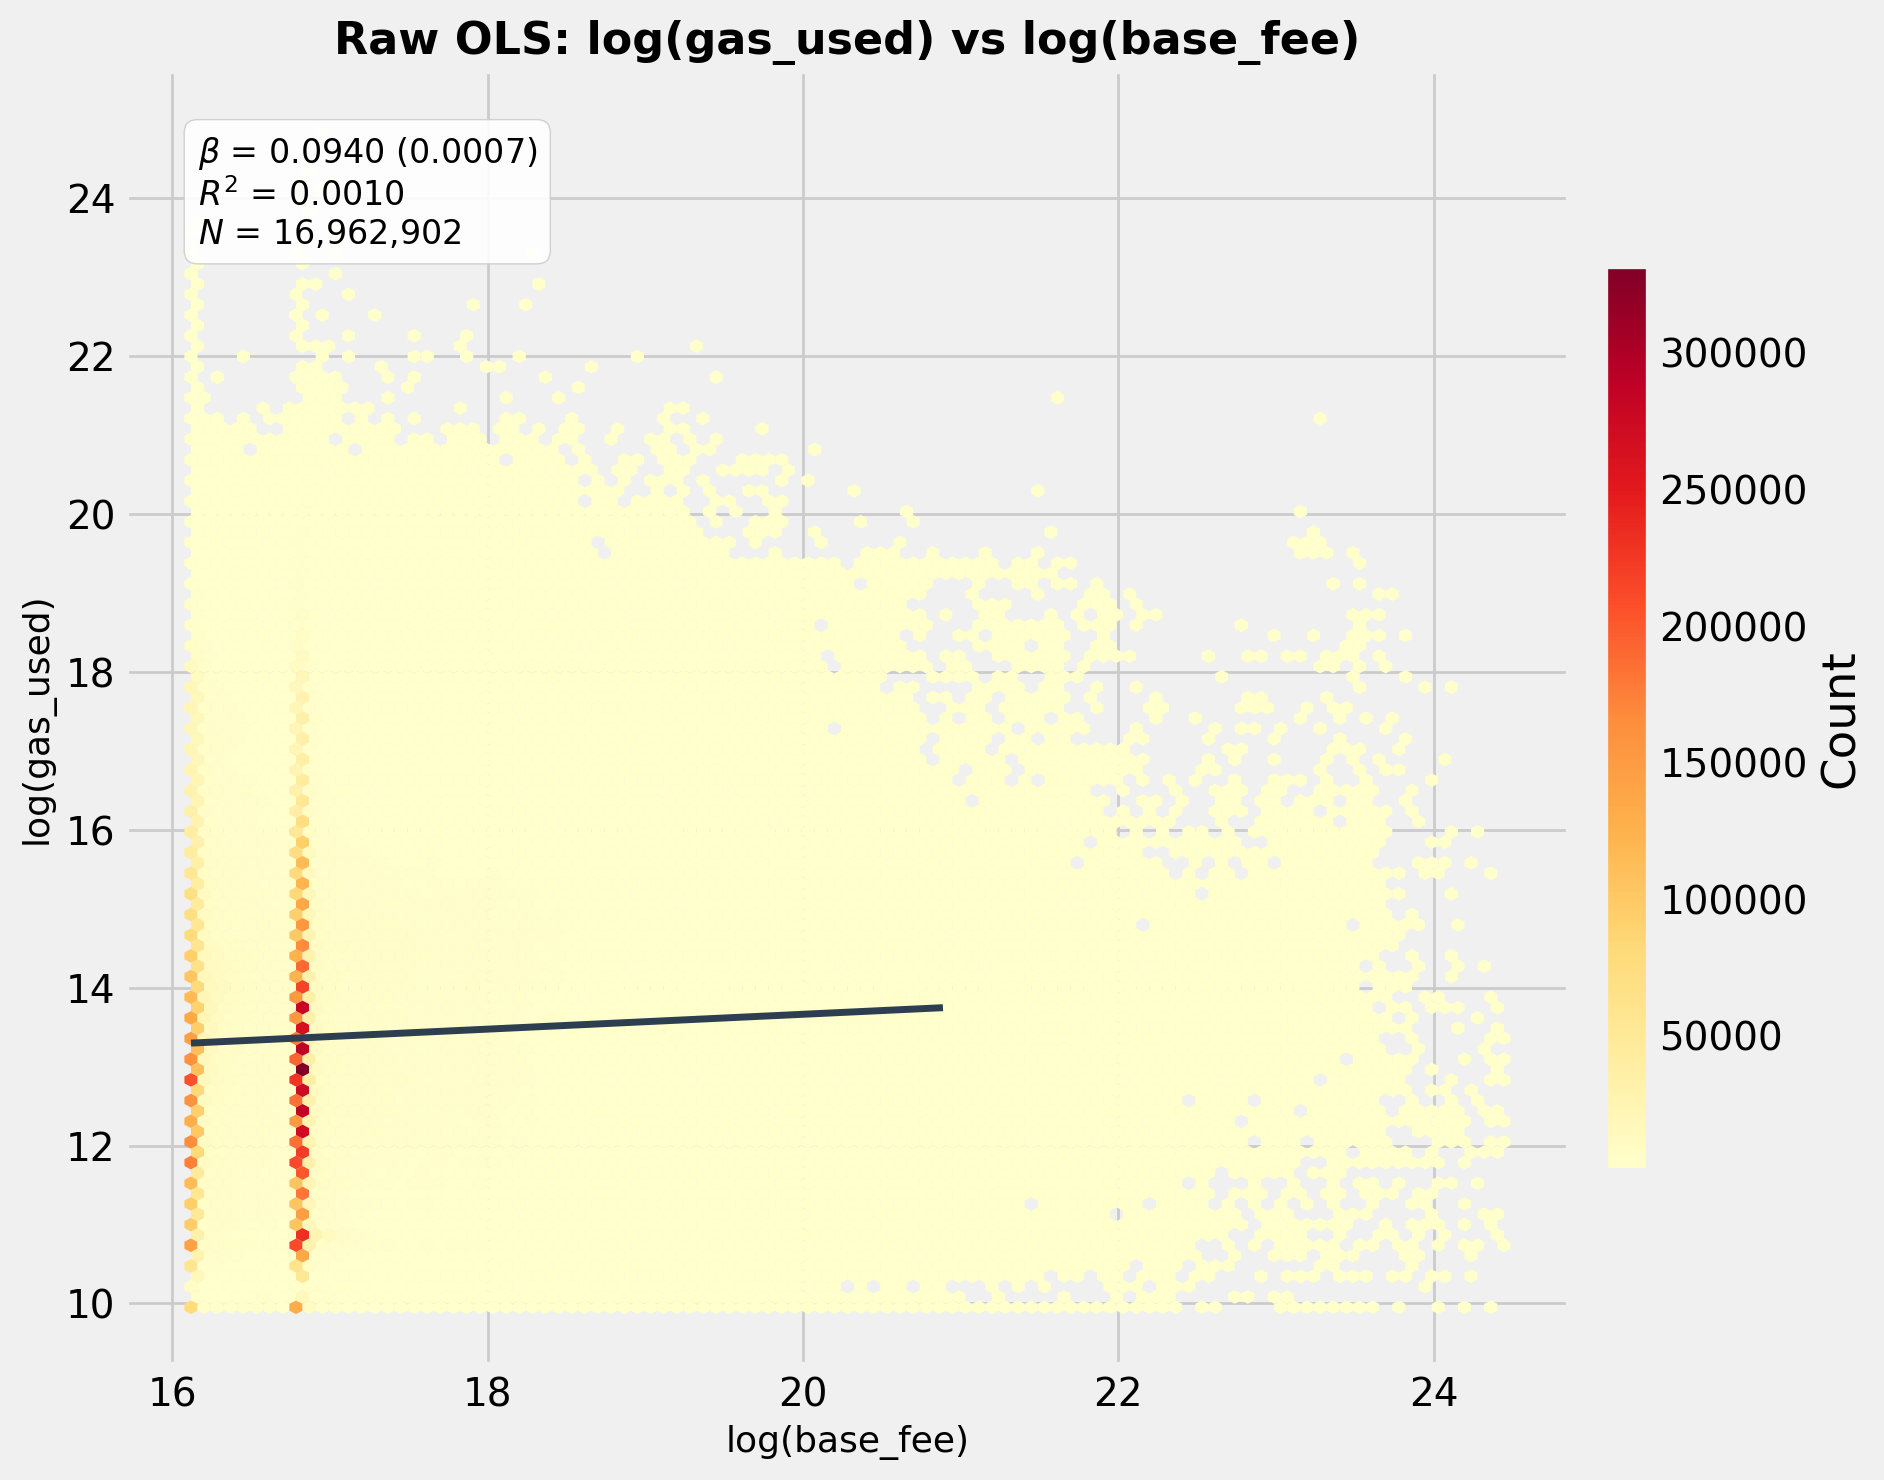
Figure 1: Raw OLS reveals spurious positive elasticity due to fee-demand simultaneity.
To address this, the analysis implements panel regressions with two-way (wallet, period) fixed effects. However, FE alone fails to eliminate within-cell congestion correlation. The core identification lever is an IV strategy that uses the wallet's own lagged base fee—predetermined by protocol dynamics and uncorrelated with present latent shocks for non-timing wallets—as an instrument for the contemporaneous fee. This approach, formalized via 2SLS, isolates exogenous within-wallet variation and enables estimation of the local average treatment effect of price changes on gas usage.
Data and Cluster Construction
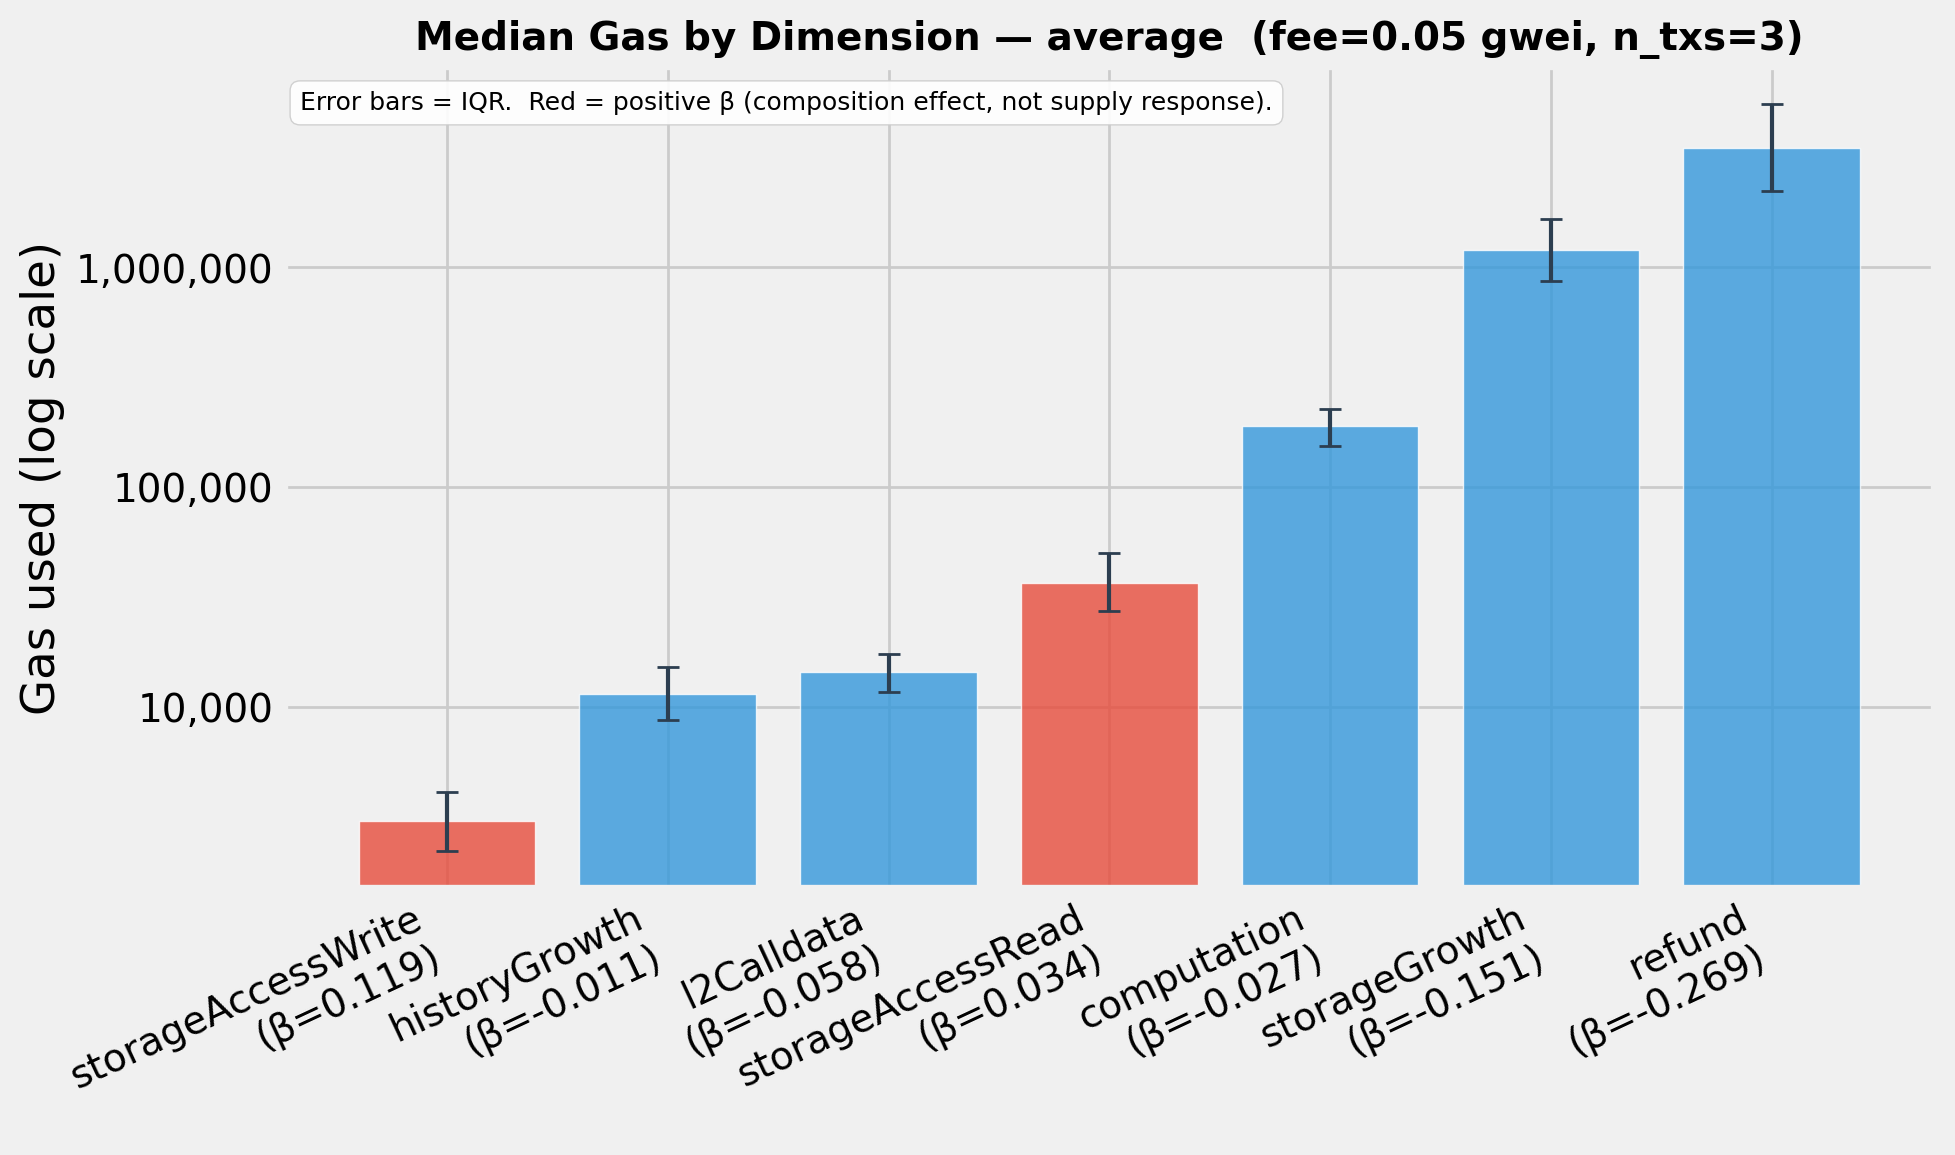
Comprehensive blockchain transaction panels are constructed for Ethereum (2025, ∼35M wallet-day obs) and Arbitrum (October 2025–April 2026, ∼17M wallet-hour obs), with wallet inclusion thresholds (>500 txs) set to guarantee within-unit variation. Importantly, Arbitrum’s data provides per-transaction decomposition into seven resource categories (e.g., computation, storage growth, calldata, refunds), facilitating resource-specific elasticity estimation.
Wallet behavioral heterogeneity is systematically interrogated using k=6 clustering on normalized features: transaction frequency, active duration, gas per tx, gas variance, and high-fee timing. t-SNE projections confirm tight cluster separation on both L1 and L2.
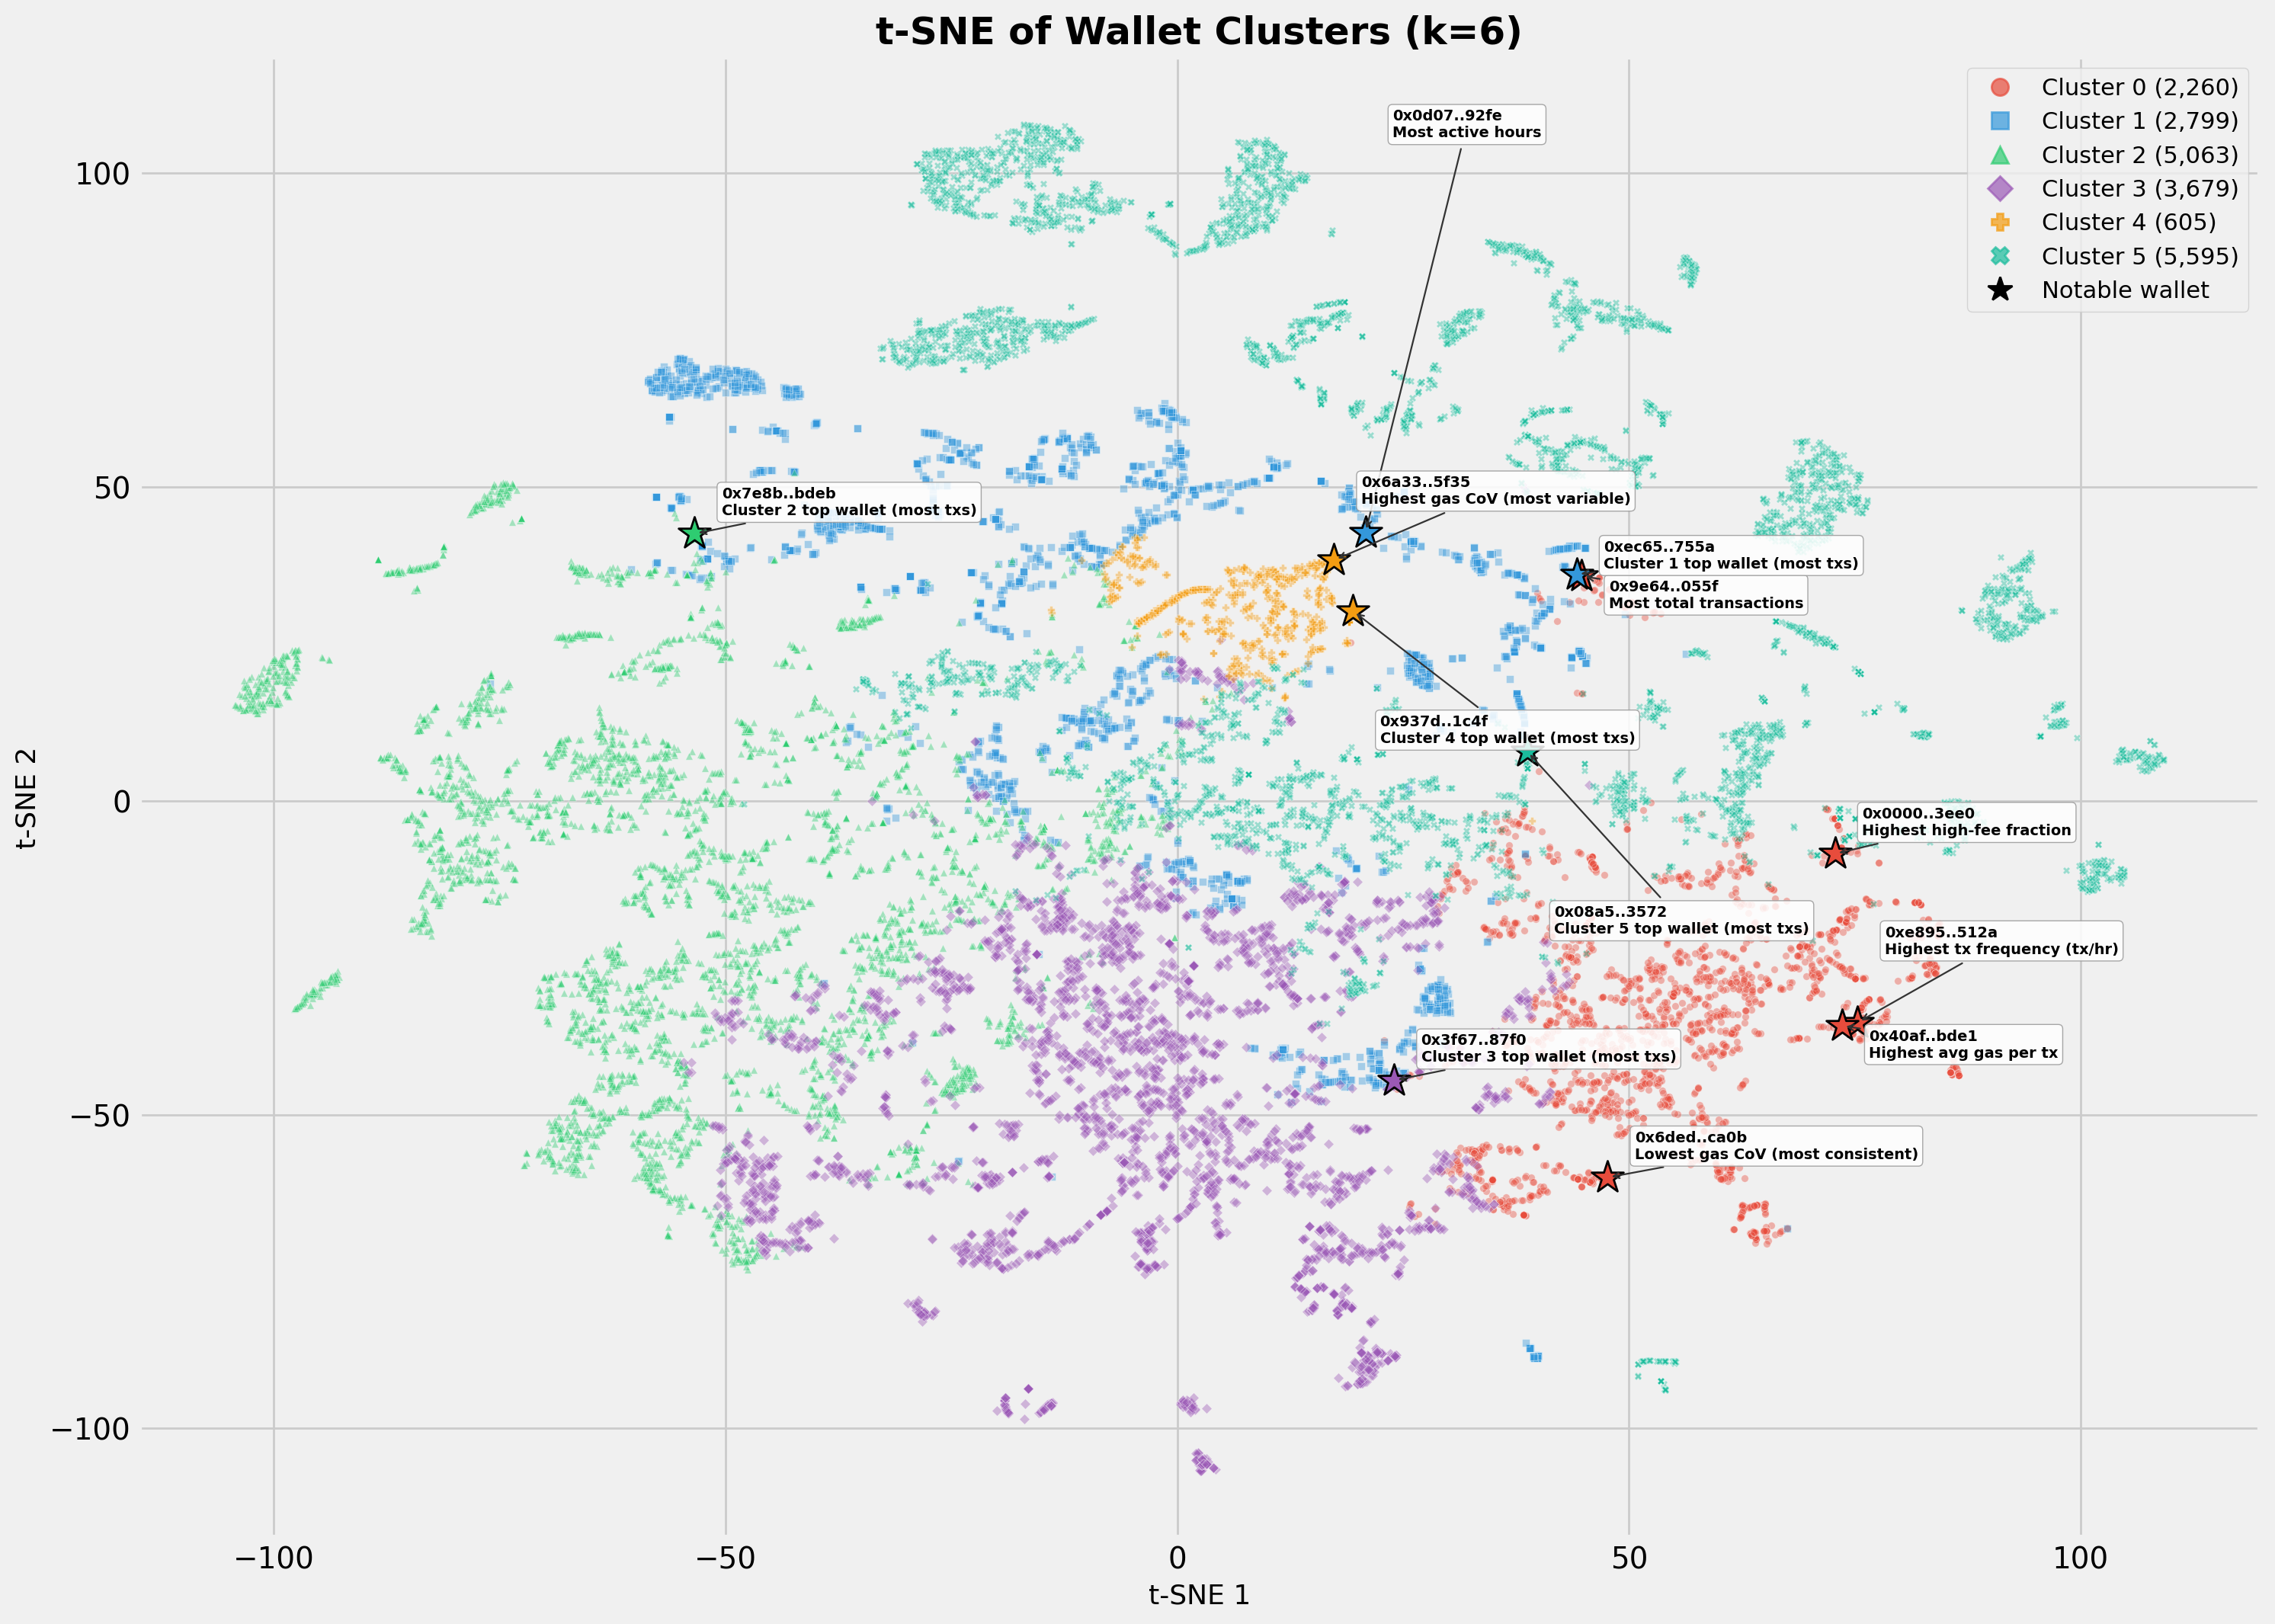
Figure 2: t-SNE confirms behavioral cluster separation for L1 wallet features.
Figure 3: L2 cluster structure reveals tight, distinct group (C5) transacting almost exclusively at high fees.
Per-resource clusters on L2 further leverage dimensions of gas usage composition.
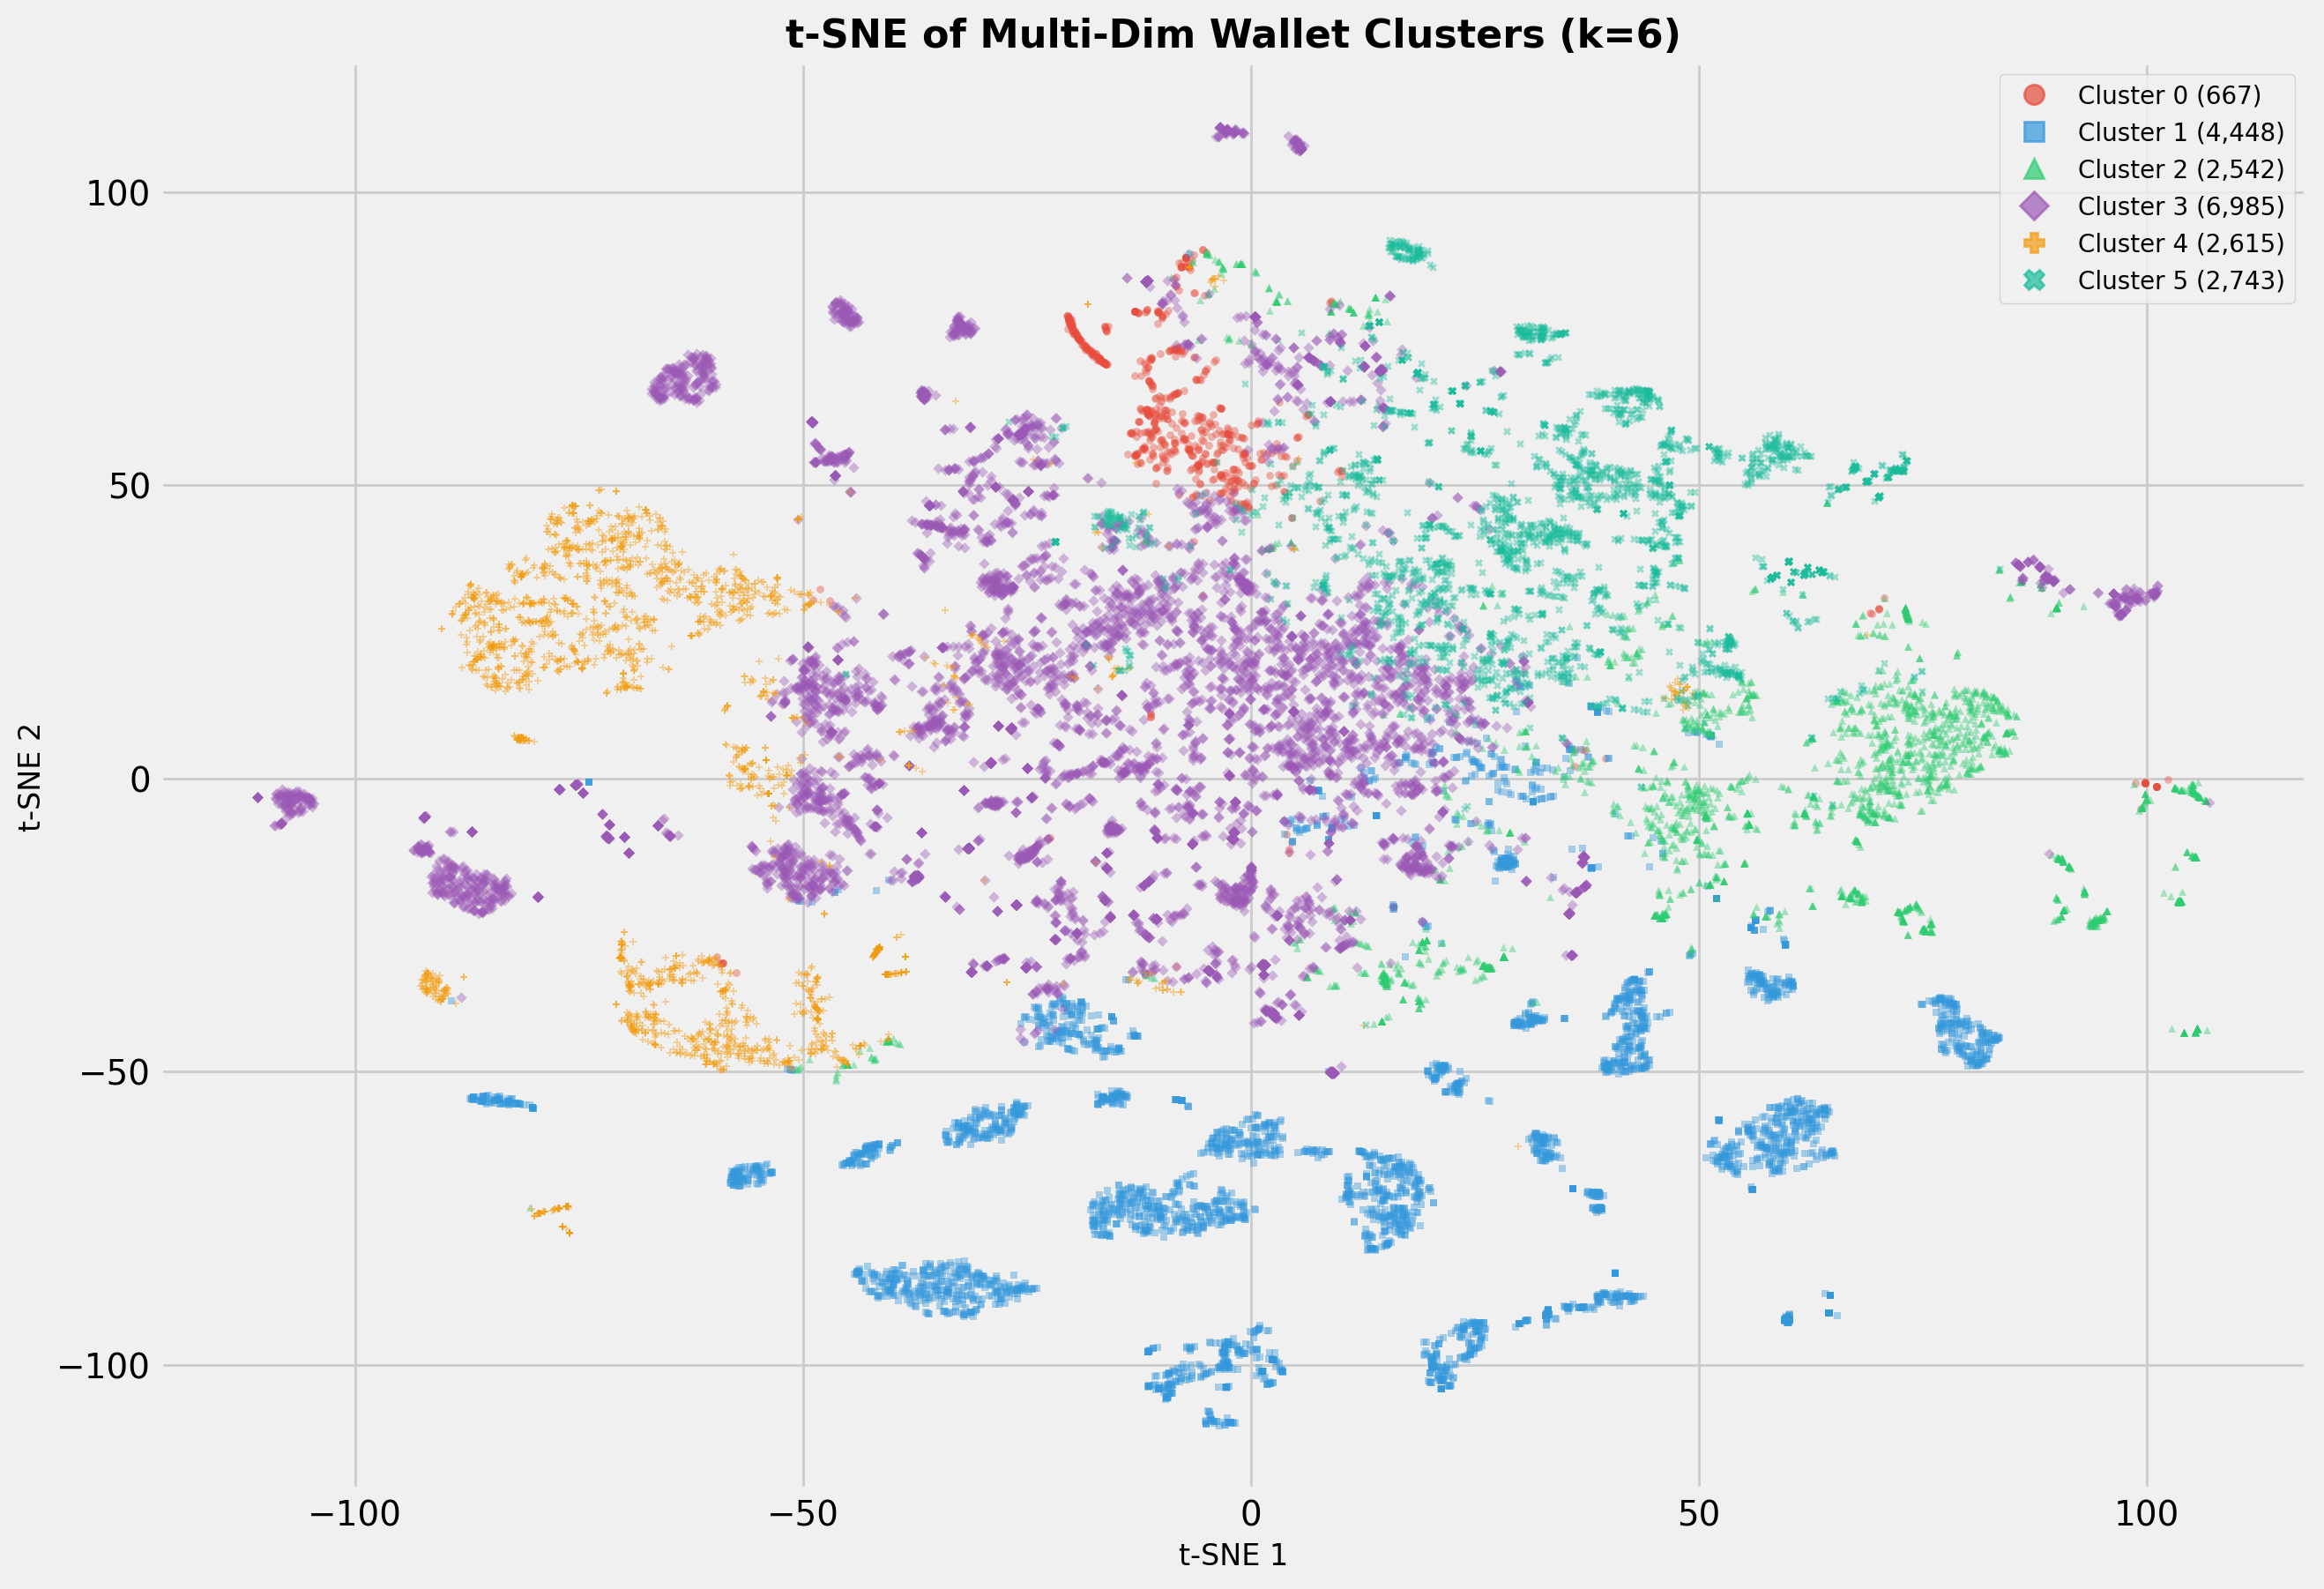
Figure 4: Resource-composition separation in L2 per-resource feature space exposes clusters invisible to behavioral-only approaches.
Aggregate Elasticity Results
For Ethereum L1, pooled IV elasticity is −0.006∗∗∗ (SE $0.0005$): a 10% base fee hike induces only a 0.06% reduction in gas demand—unequivocally inelastic. On Arbitrum L2, pooled IV elasticity is −0.036∗∗ (SE $0.014$); L2 demand remains inelastic, but is measurably more fee-responsive (6x L1).
High-frequency and behaviorally defined clusters display stark elasticity contrasts. High-volume, fee-avoiding L1 subpopulations exhibit up to −0.024, while always-on protocol and low-intensity users are consistently near-zero.
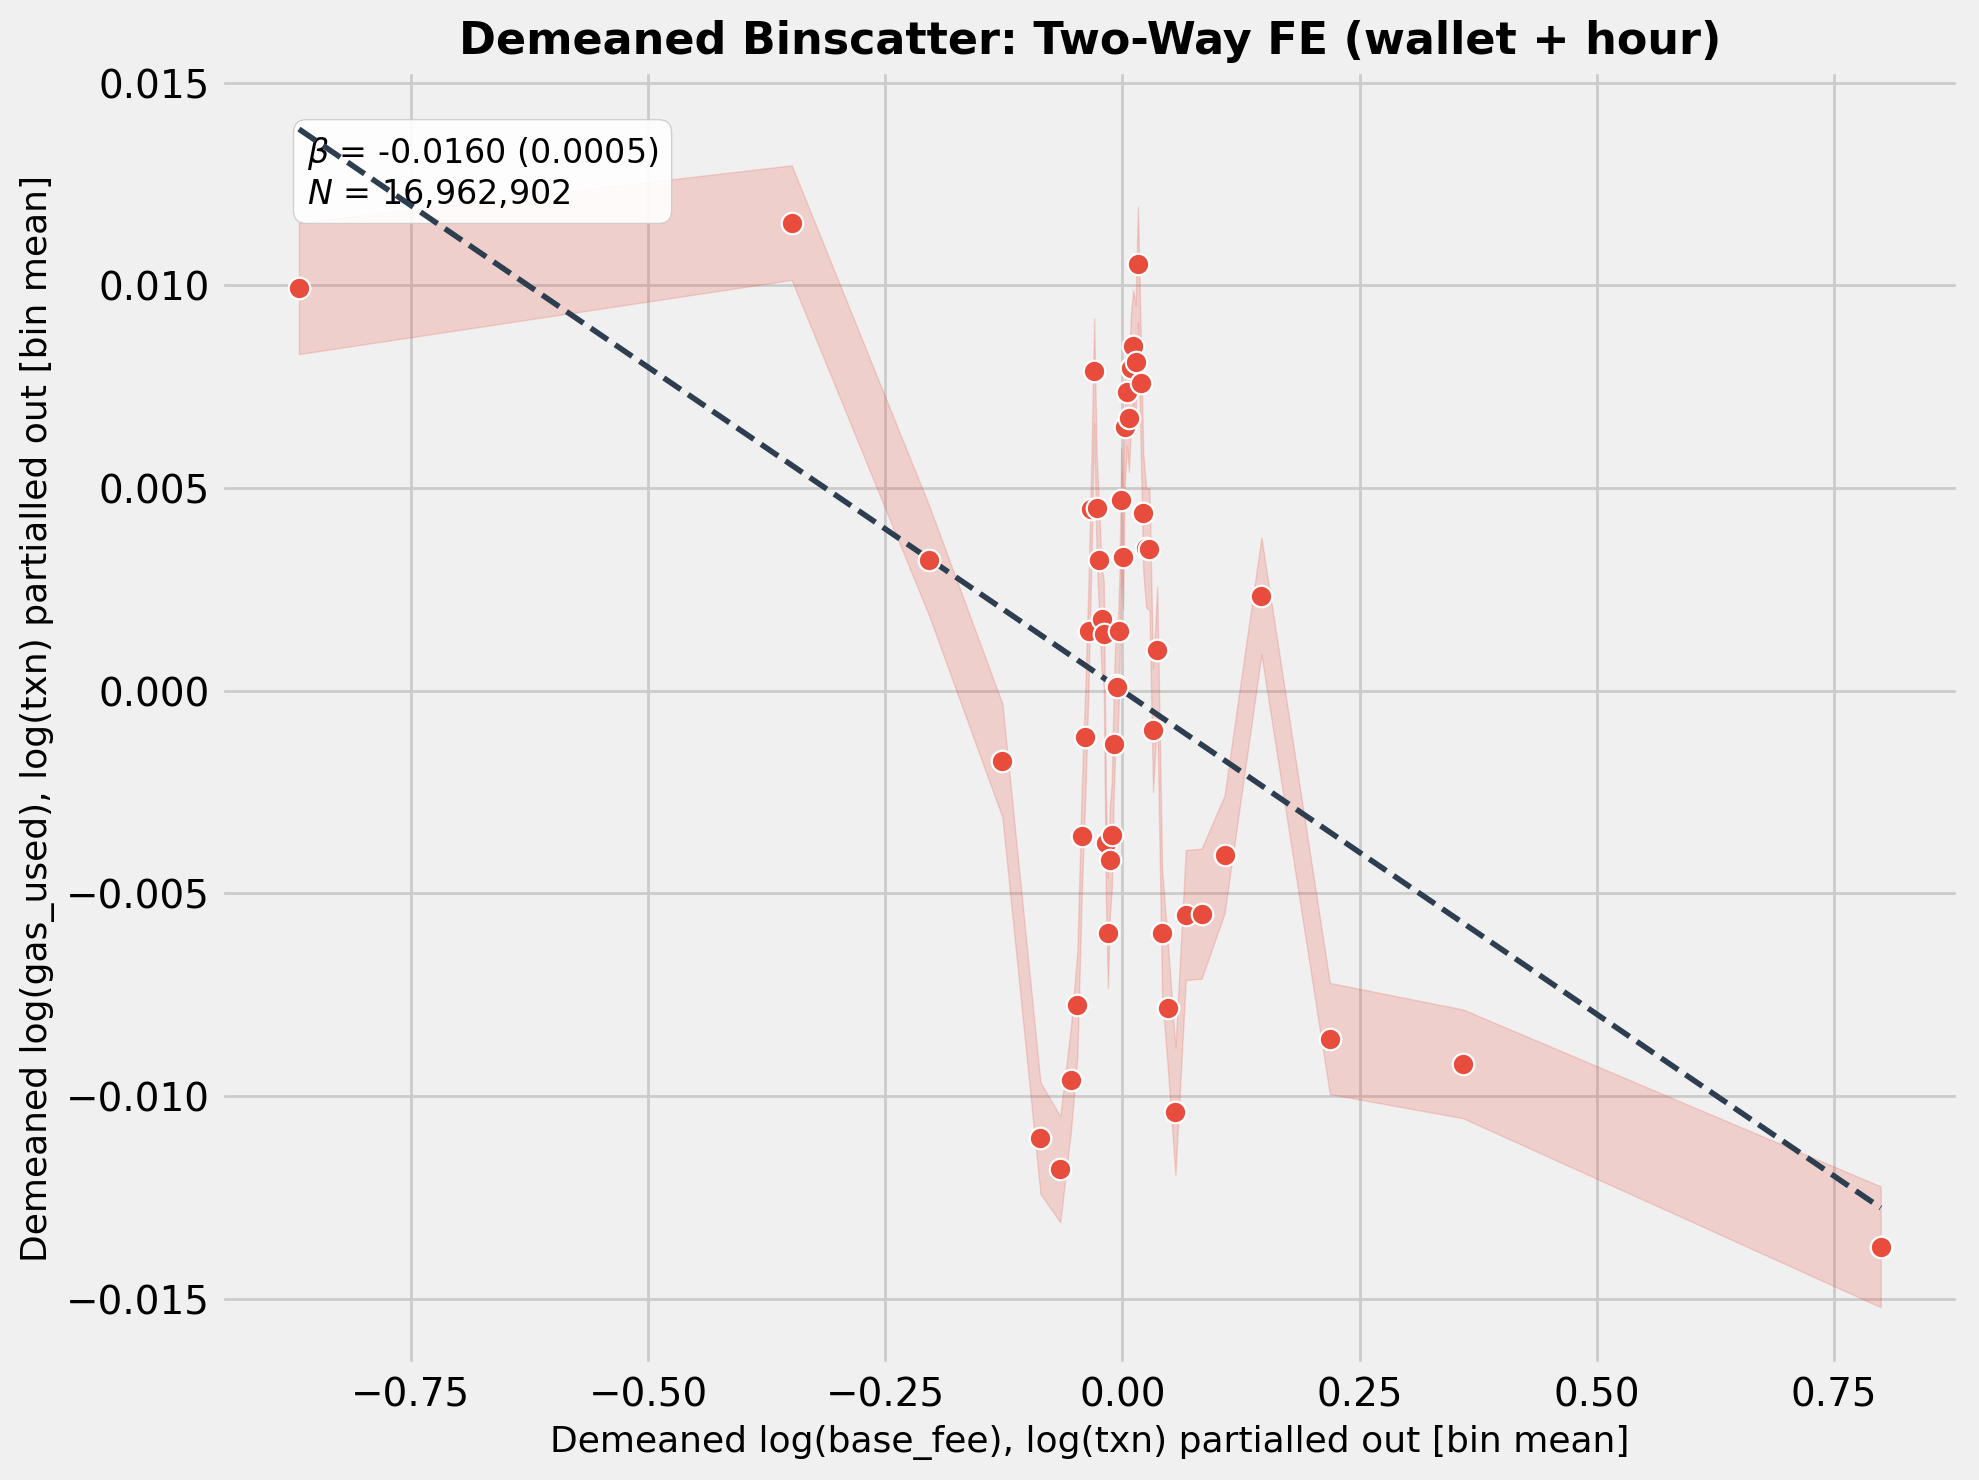
Figure 5: Two-way demeaned binscatter for L1 reveals downward-sloping demand after adjusting for wallet and day effects.
Cluster identification on L2 is especially consequential: a large group (C5) transacts primarily in congestion epochs, violating exclusion and excluded from causal effect interpretation. Long-lived, high-frequency clusters show strongly negative, well-identified elasticities.
Resource-Level Elasticities on L2
Pooled IV estimates for Arbitrum resource dimensions demonstrate critical heterogeneity:
Analysis of selection effects confirms that genuine negative elasticities for storage growth and refunds are not compositional artifacts; these operations are often deferred when price increases, unlike computation, which is more inelastic.
Cluster-level resource elasticities exhibit even more marked effects, with high-volume behavioral types strikingly more responsive on all state-consuming resources.
Simulation and Fee Mechanism Applications
Elasticity parameters underpin simulation of counterfactual fee regimes and resource pricing proposals. The model generates distributional responses to fee sweeps, invaluable for fee mechanism scenario analysis and throughput forecasting.
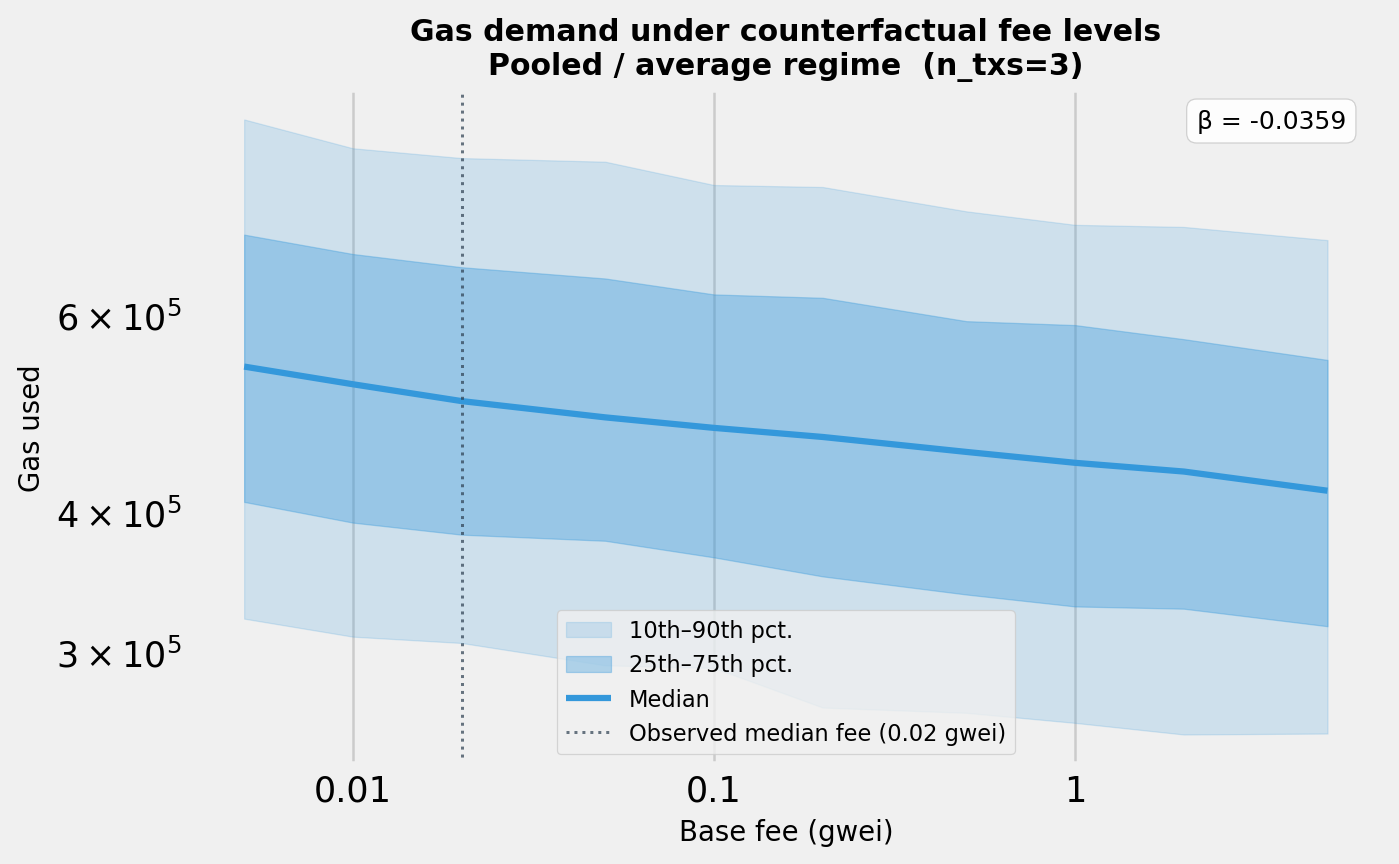
Figure 7: Gas demand simulation under counterfactual fee regimes shows aggregate downward response; modeled quantiles stay roughly parallel across fee levels.
Empirically established resource-level elasticities provide direct policy guidance: repricing storage growth/refund operations yields substantial usage effects; conversely, marginal increases in computation price primarily raise revenue without curbing demand.
Implications and Limitations
Empirical confirmation of aggregate inelasticity—especially on L1—has profound mechanism-design implications. Classical congestion pricing can raise fee revenue with minimal throughput loss; welfare-improving mechanisms must differentiate among resource types, matching fee sensitivity. On L2, greater elasticity likely reflects user selection and protocol incentive effects.
The study identifies limitations in exclusion (market-timing clusters must be excluded), coverage (analysis excludes wallets with ∼3500 txs), and generalizability to other chains lacking rich resource-level attribution.
Optimal cluster count (∼4) is robustly established via elbow-criterion inertia curves.
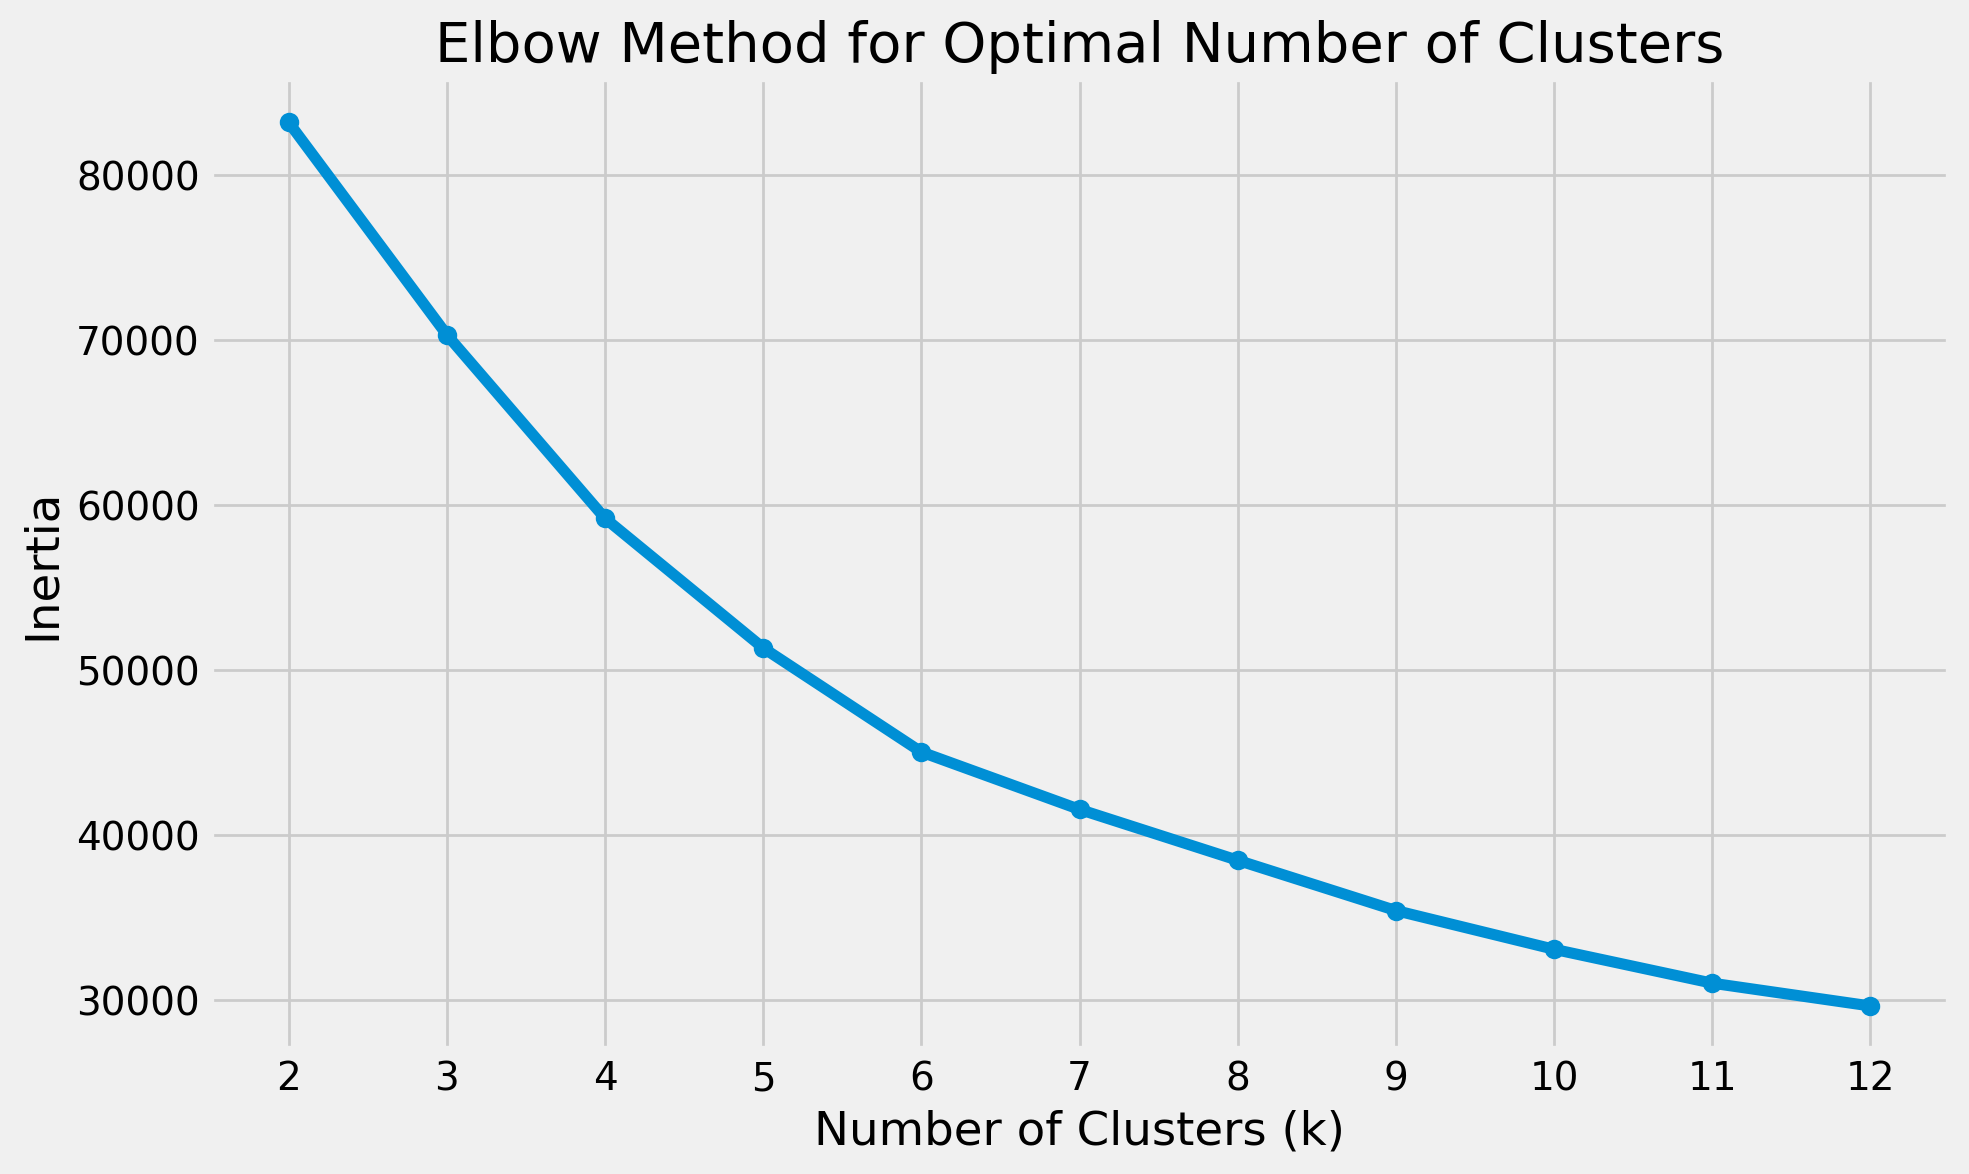
Figure 8: Elbow plots for L1 and L2 clustering consistently support ∼5.
Conclusion
The paper provides rigorous, causally identified estimates of on-chain gas price elasticity for Ethereum L1 and Arbitrum L2, decisively establishing aggregate inelasticity and precise resource-level heterogeneity. The findings have substantial mechanism design implications, demonstrating that only storage and state-clearing operations exhibit high responsiveness to fee signals. Clustering exposes sharp heterogeneity in user behavior, invalidating pooled averages for strategic/timing segments and highlighting the necessity for differentiated mechanism evaluation in both empirical and theoretical work. This empirical foundation will support subsequent investigation and optimization of multi-dimensional resource pricing and fee adjustment protocols.
Reference: "Price Elasticity of Gas Demand on L1 and L2: Evidence from Ethereum and Arbitrum" (2606.13555)