Multimodal OCR: Parse Anything from Documents
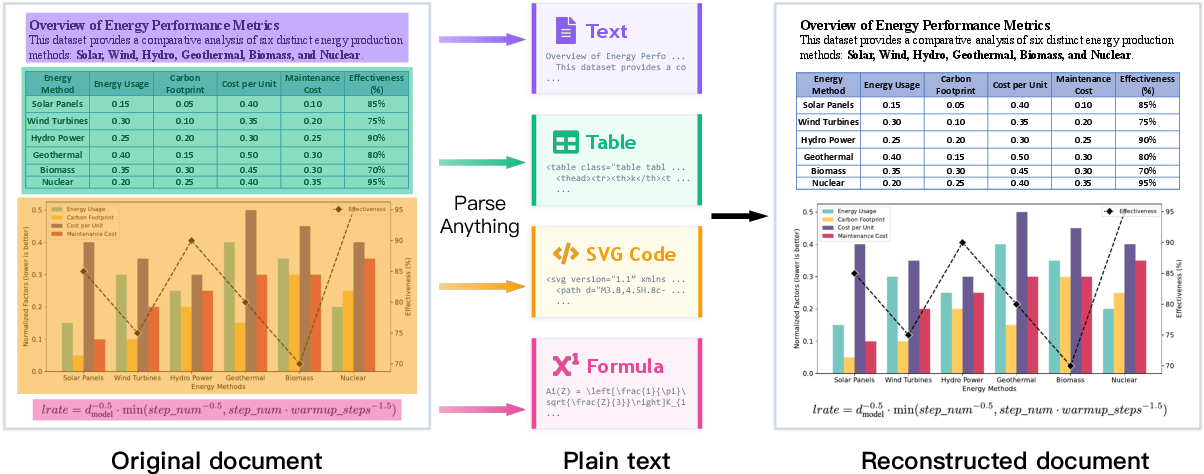
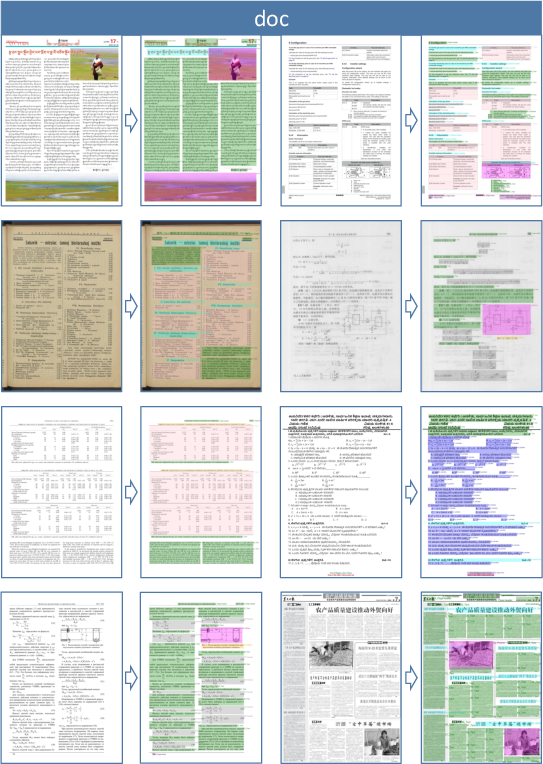
Abstract: We present Multimodal OCR (MOCR), a document parsing paradigm that jointly parses text and graphics into unified textual representations. Unlike conventional OCR systems that focus on text recognition and leave graphical regions as cropped pixels, our method, termed dots.mocr, treats visual elements such as charts, diagrams, tables, and icons as first-class parsing targets, enabling systems to parse documents while preserving semantic relationships across elements. It offers several advantages: (1) it reconstructs both text and graphics as structured outputs, enabling more faithful document reconstruction; (2) it supports end-to-end training over heterogeneous document elements, allowing models to exploit semantic relations between textual and visual components; and (3) it converts previously discarded graphics into reusable code-level supervision, unlocking multimodal supervision embedded in existing documents. To make this paradigm practical at scale, we build a comprehensive data engine from PDFs, rendered webpages, and native SVG assets, and train a compact 3B-parameter model through staged pretraining and supervised fine-tuning. We evaluate dots.mocr from two perspectives: document parsing and structured graphics parsing. On document parsing benchmarks, it ranks second only to Gemini 3 Pro on our OCR Arena Elo leaderboard, surpasses existing open-source document parsing systems, and sets a new state of the art of 83.9 on olmOCR Bench. On structured graphics parsing, dots.mocr achieves higher reconstruction quality than Gemini 3 Pro across image-to-SVG benchmarks, demonstrating strong performance on charts, UI layouts, scientific figures, and chemical diagrams. These results show a scalable path toward building large-scale image-to-code corpora for multimodal pretraining. Code and models are publicly available at https://github.com/rednote-hilab/dots.mocr.
First 10 authors:
Paper Prompts
Sign up for free to create and run prompts on this paper using GPT-5.
Top Community Prompts
Explain it Like I'm 14
What is this paper about?
This paper introduces a new way to read and understand documents called Multimodal OCR (MOCR). Instead of only reading the words on a page, it also “reads” the pictures, charts, tables, diagrams, and icons by turning them into text-like instructions. Think of it as a super-smart scanner that not only copies text but also writes down a recipe for how to redraw the graphics in the document.
The team’s system is called dots.mocr. It can look at pages from PDFs, websites, and screenshots, then output both:
- the text (in the right order and structure), and
- code-like instructions (especially SVG) that can recreate the graphics.
What questions were they trying to answer?
In simple terms, the paper asks:
- Can we build a document reader that understands everything on a page—not just words, but also charts, tables, and diagrams?
- Can we turn graphics into reusable “code” instead of just saving them as images?
- Will this make document understanding more accurate and useful for future AI models?
How did they do it?
The big idea: turn graphics into “drawing instructions”
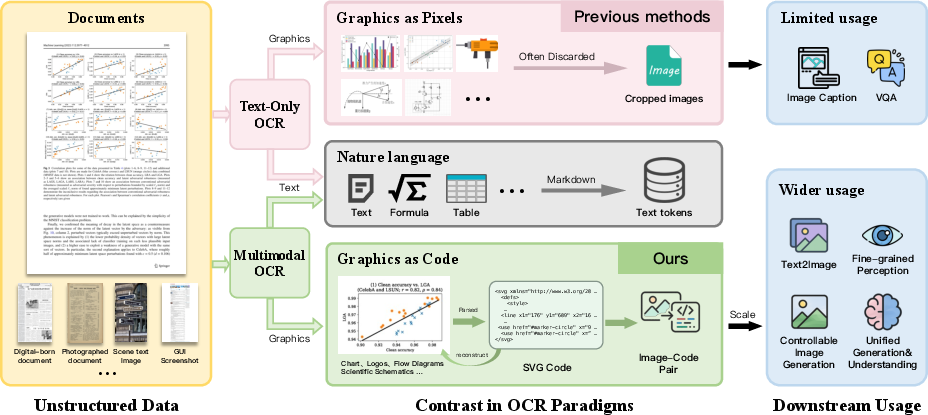
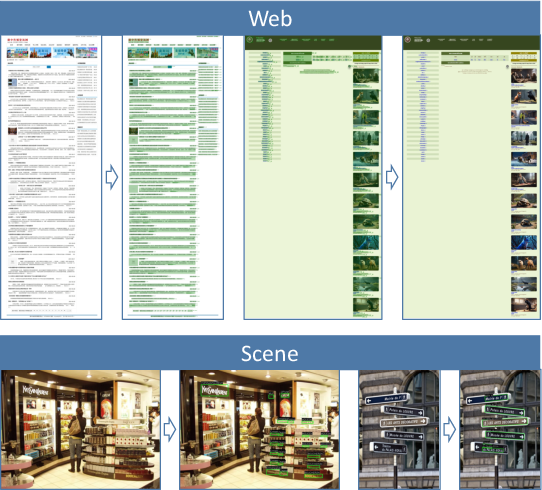
Most OCR tools stop at text. If there’s a chart or icon, they just crop it as a picture. This loses important structure (like axis values, shapes, colors, or geometry). MOCR goes further: it converts those visuals into SVG, which is like a set of step-by-step drawing instructions (lines, circles, colors, sizes). That means the graphic can be edited, searched, and reused—just like text.
- Raster image: like a photo—lots of colored dots.
- SVG (vector code): like a recipe—“draw a line here, a circle there,” which you can re-render perfectly at any size.
The model: a high-res viewer plus a text generator
The system has:
- A high-resolution “vision” part that can see tiny details on full pages (small fonts, thin lines in charts).
- A “language” part that writes out structured outputs: text blocks, tables, formulas, and SVG code for graphics. Together, it produces an ordered list of what’s on the page, where it is, and how to recreate it.
Note: Today, they run it in two passes to get a full result—one pass for the page’s text structure and another pass to convert selected images (like charts or icons) into SVG.
The data engine: where it learned from
To teach the model, they built a large training set from:
- PDFs: to learn page text, layout, tables, and reading order.
- Webpages: screenshots with known structure (plus many native SVG icons and charts).
- SVG graphics: collected and cleaned from the web to pair images with their SVG “recipes.”
- General vision data: to keep the model broadly capable.
They also “normalized” SVGs (cleaned and standardized them), because there are many different ways to write code that draws the exact same picture. This helps the model learn consistent outputs.
How they judged success: OCR Arena (an LLM judge + Elo scores)
Traditional scoring (like edit distance) can be unfair if two answers look the same but are written slightly differently. So they also used an “AI referee”: they show a strong vision-LLM two different outputs and ask which one matches the original page better. They repeat many “matchups” and assign an Elo score (like in chess) to rank systems fairly.
What did they find?
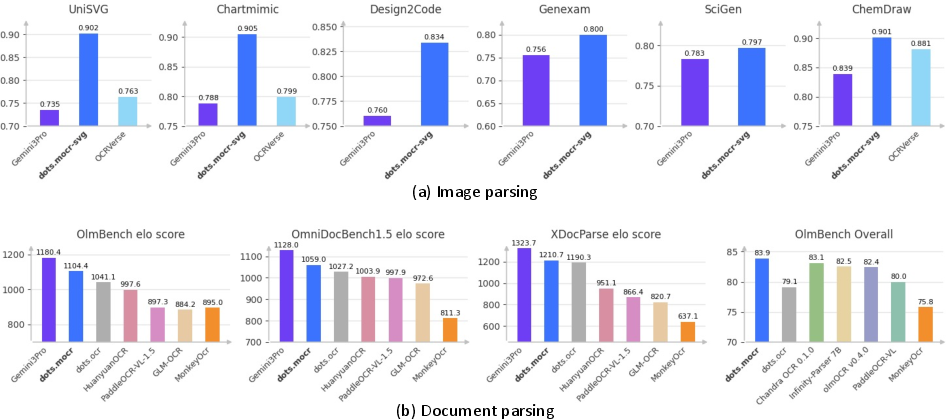
- Document parsing: dots.mocr ranked second only to a very strong commercial model (Gemini 3 Pro) on their OCR Arena leaderboard and set a new state of the art on a strict benchmark called olmOCR-Bench. It also beat other open-source systems on multiple tests.
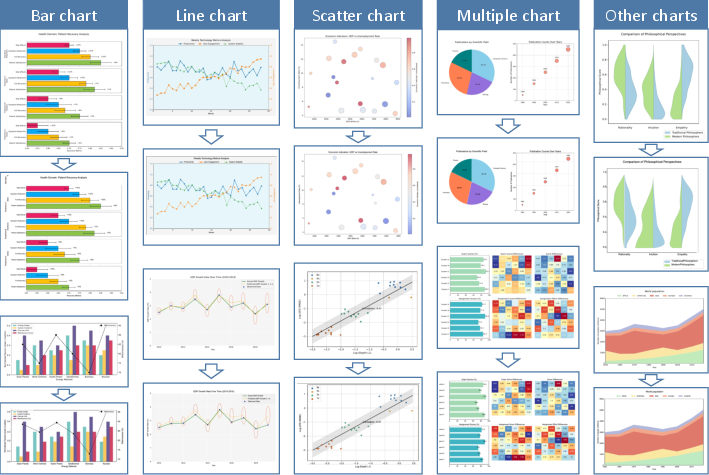
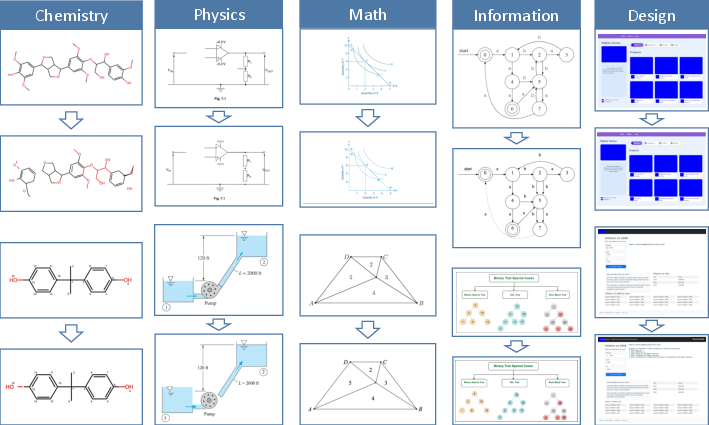
- Graphics-to-code: On tasks where you must convert images into SVG (icons, charts, UI layouts, scientific figures, chemical diagrams), their SVG-focused variant (dots.mocr-svg) reconstructed graphics more faithfully than Gemini 3 Pro and other open models.
- Small but strong: Their model is relatively compact (about 3 billion parameters) yet balances both document parsing and graphics reconstruction well.
Why this matters:
- It preserves the true structure of documents—words, layout, and visuals—so you can rebuild the page accurately.
- It turns graphics from throwaway pixels into reusable, searchable, and editable code.
- It unlocks a new source of “image-to-code” training data for future multimodal AI.
What’s the impact?
If you can parse everything—not just text—documents become much more useful for learning and search. Here’s what that enables:
- More faithful copies of documents: Better archiving, accessibility, and editing.
- Smarter search: You could search for “bar chart with three blue bars” or “diagram with two arrows pointing to a circle.”
- Better training data for AI: Every chart or diagram can become an image + code + text trio, which is great for teaching AI to understand visuals deeply.
- Cross-domain potential: The idea could extend beyond SVG to other “programs” for drawings—like LaTeX/TikZ for scientific figures, D3.js for data visuals, or CAD formats for engineering.
Key takeaways
- Most OCR tools ignore the structure inside graphics. MOCR treats graphics as first-class citizens and writes them down as code.
- The dots.mocr model reads pages and outputs both clean text and reusable drawing instructions (SVG).
- It performs strongly on both standard document tasks and graphics reconstruction—often rivaling or beating much larger or commercial systems.
- This approach can power better document understanding, richer search, and stronger multimodal AI in the future.
Knowledge Gaps
Knowledge gaps, limitations, and open questions
Below is a single, focused list of what remains missing, uncertain, or unexplored in the paper, framed to guide concrete follow-up research:
- One-pass multimodal parsing: The current system requires separate passes for page-level text parsing and region-level image-to-SVG decoding; feasibility, accuracy, and efficiency of a single-pass, unified output (with joint decoding and cross-element constraints) remain untested.
- Visual–text linking: Explicit modeling and evaluation of relationships between elements (e.g., figure–caption links, reference resolution “Fig. 2 → bounding box”, table references, footnote anchors) are not addressed.
- Hierarchical structure representation: The sequence-based output encodes order but not explicit hierarchical layout (nesting, grouping, reading-order trees); it is unclear how well implicit ordering captures complex page hierarchies and how to evaluate it.
- Localization quality: No quantitative evaluation is provided for bounding-box accuracy (e.g., IoU/mAP for layout elements), despite outputs including spatial regions.
- Chart semantics vs geometry: The work focuses on SVG reconstruction fidelity; extraction of chart data tables, axes scales, units, legends, and mappings (beyond geometric similarity) is not evaluated.
- UI/web semantics and interactivity: Reconstructing interactive semantics (DOM roles, accessibility attributes, hyperlinks, animations) from webpages/UI screenshots is not considered; outputs are SVG-only, limiting downstream utility for web engineering.
- Program-space generality: SVG is the sole structured target; support for other executable formats (TikZ, LaTeX diagrams, D3.js/Vega, CAD, circuit- and chemistry-specific markup) is proposed as future work but not explored or benchmarked.
- Non-uniqueness in code targets: Canonicalization/normalization is mentioned, but there is no systematic analysis of equivalence classes in program space, robustness of training/evaluation to syntactically-different-yet-render-equivalent code, or error modes introduced by canonicalizers.
- Renderer dependence: Reconstruction metrics rely on a single render-and-compare pipeline; cross-renderer consistency (e.g., browser engines vs. librsvg/Inkscape) and metric sensitivity to rendering differences remain unexamined.
- Judge-based OCR evaluation: Elo relies on a closed-source VLM (Gemini 3 Flash) as the judge; correlation with expert human judgments, sensitivity to prompt phrasing, style biases, and cross-judge robustness are not reported.
- Benchmark weighting and coverage: Elo inherently underweights rarer page types (e.g., formula/table-heavy pages); there is no analysis of reweighting strategies or whether Elo rankings align with strict-match metrics at the category level.
- Multilingual/generalization coverage: The paper claims multilingual capability but provides no per-language or per-script breakdown (e.g., CJK, Arabic/RTL, complex shaping), nor ablations on low-resource scripts or mixed-script pages.
- Formula parsing fidelity: Although formulas are mentioned, there is no targeted evaluation with LaTeX-level metrics (e.g., CDM) or error taxonomy for math-intensive documents.
- Robustness to degradation: Effects of real-world noise (low DPI, blur, compression, skew/rotation, handwriting variability, bleed-through) are not systematically studied; only aggregate category results are shown.
- Multi-page document context: Cross-page parsing (e.g., TOC to page anchors, references spanning pages) and document-level linking are out of scope; evaluation is page-centric.
- Region selection for SVG decoding: The policy for selecting which regions are “SVG-eligible” (thresholds, detectors, false positives/negatives) and its effect on coverage/precision is not specified or ablated.
- Data engine transparency: Precise dataset compositions (counts per source/domain/language), licensing status, and filtering criteria are not fully disclosed; reproducibility and legal compliance of web/SVG scraping need clarification.
- Benchmark contamination: There is no deduplication analysis against evaluation sets (PDFs/webpages/SVGs), leaving the risk of training–test leakage unquantified.
- Label noise quantification: Large portions of supervision are auto-labeled (e.g., dots.ocr for PDFs); the paper lacks error-rate estimates of pseudo-labels, their impact on final performance, and noise-robust training strategies.
- Ablations on training recipe: No controlled studies on mixture ratios, curriculum schedule, resolution ramps, or normalization steps (e.g., viewBox handling) to attribute gains and guide practitioners.
- Architecture scaling: The 3B setup is fixed; scaling laws across encoder/decoder sizes, connector variants, and image resolution vs. accuracy/latency trade-offs are not investigated.
- Efficiency and deployment: Inference latency, memory footprint for ~11M-pixel inputs, decoding time for long SVG sequences, batching strategies, and hardware requirements are not reported.
- Output length control: Techniques to manage very long structured generations (e.g., SVG length caps, chunked decoding, planning+decoding) and their effects on fidelity and failures are not examined.
- Safety of executable outputs: Security and sanitization of generated SVG (e.g., external references, scripts, harmful constructs) and safe rendering practices are not discussed.
- Metric sufficiency for graphics: ISVGEN is used as the sole reconstruction metric; complementary structure-aware metrics (e.g., path/shape edit distances, style/attribute accuracy, grouping fidelity) and human studies are absent.
- Generalization beyond SVG-amenable regions: Strategy for complex photographic figures or mixed raster–vector graphics (partial vectorization, hybrid representations) is not detailed.
- Trade-offs between dots.mocr and dots.mocr-svg: The paper notes different SFT mixtures but lacks a clear analysis of catastrophic forgetting, cross-task trade-offs, or methods (e.g., adapters, multi-head decoders) to isolate capabilities.
- Connector and tokenization choices: The impact of different tokenizer schemes for structured code (e.g., subtokenization of paths, attribute dictionaries) and connector designs on long-sequence stability is not explored.
- Cross-domain scientific graphics: While ChemDraw/SciGen are reported, broader scientific domains (e.g., circuits, flowcharts, UML, maps) and domain-specific constraints/grammars are not benchmarked.
- Downstream utility for pretraining: The claim that MOCR enables large-scale image-to-code corpora for multimodal pretraining is compelling but unvalidated; no experiments show performance gains on third-party tasks from pretraining on MOCR-derived corpora.
- Human-in-the-loop data curation: Render-based verification is used, but scalable human auditing strategies, reward-model filtering, or self-improvement loops and their ROI are not quantified.
- Error analysis: There is no fine-grained error taxonomy (e.g., text OCR vs. layout order vs. region localization vs. SVG geometry vs. style attributes), hindering targeted improvements.
Practical Applications
Practical Applications of Multimodal OCR (MOCR) and dots.mocr
Below are actionable, real-world applications that follow from the paper’s findings and innovations. Each item is scoped as an Immediate Application (deployable now with the released code/models) or a Long-Term Application (requiring further research, scaling, or ecosystem development). For each, we link sectors and note tools/workflows and key assumptions/dependencies.
Immediate Applications
The following can be implemented today with the released 3B-parameter dots.mocr/dots.mocr-svg models and the described data/evaluation pipelines.
- High-fidelity PDF/webpage-to-structured document conversion (text + graphics)
- Sectors: publishing, legal, finance, scientific/technical publishing, government/open data, enterprise content management (ECM)
- Tools/workflows: PDF/webpage to Markdown/HTML plus inline SVG; reading-order–aware exports; table markup and LaTeX capture; faithful chart/diagram reconstruction as renderable SVG
- Assumptions/dependencies: adequate GPU for high-res inputs (~11M pixels); two-pass parsing (page text + region-level SVG); rendering fidelity depends on SVG canonicalization; IP/licensing for downstream redistribution
- Chart-to-data reconstruction for BI and analytics
- Sectors: finance, market research, journalism, public policy, scientific analytics
- Tools/workflows: batch extraction of chart geometry and styling from reports into SVG; optional downstream conversion from SVG primitives to tabular series for ingestion into BI tools
- Assumptions/dependencies: post-processing to map SVG paths to data series; some chart types or dense overlays may need human QA
- Digitization and cleanup of legacy/scanned documents with structural preservation
- Sectors: archives/libraries, government records, legal discovery, compliance
- Tools/workflows: scan-to-structured pipeline producing readable text, tables, formulas, and vectorized figures; improved archival searchability and editability
- Assumptions/dependencies: OCR accuracy on degraded scans varies; human validation recommended for high-stakes archives
- Automated document ingestion for Retrieval-Augmented Generation (RAG) and search
- Sectors: enterprise knowledge management, customer support, research repositories
- Tools/workflows: convert PDFs/webpages/screenshots into structured chunks (text + SVG) with reading order; index code-level graphics for semantic retrieval (e.g., chart type, axes, geometry)
- Assumptions/dependencies: chunking strategy for long outputs; RAG frameworks must handle mixed text/SVG payloads
- Accessibility upgrades: accessible charts and diagrams in documents
- Sectors: education, public sector, publishing
- Tools/workflows: generate SVG for figures to enable screen-reader-friendly structure; auto-generate descriptive tags and textual summaries using VLMs
- Assumptions/dependencies: accessibility standards (e.g., WCAG) compliance requires schema-aware tagging; quality review needed for descriptions
- Scientific workflows: figure/diagram reconstruction for editing and reuse
- Sectors: academia, STM publishing, corporate R&D
- Tools/workflows: convert scientific figures (e.g., plots, schematics) to editable SVG for correction, translation, or restyling; integrate into authoring tools
- Assumptions/dependencies: some domain figures (e.g., complex microscopy composites) may remain raster; license to modify figures must be ensured
- Structured UI and web layout parsing for engineering productivity
- Sectors: software, product design, QA
- Tools/workflows: parse UI screenshots/webpages into DOM-like structures or SVG; accelerate reverse-engineering, design audits, and visual diff testing
- Assumptions/dependencies: mapping from SVG/structural layout to specific framework code (React/Vue) requires additional post-processing
- Automated label generation for multimodal pretraining datasets
- Sectors: AI/ML tooling, data providers, open-source community
- Tools/workflows: use MOCR to convert pixels to code/text triples (image, SVG, text) at scale; create controllable, render-verified supervision for VLM pretraining
- Assumptions/dependencies: robust canonicalization and dedup; dataset licensing and PII scrubbing policies
- Document QA and compliance checks with structure-aware context
- Sectors: finance (regulatory filings), healthcare (policy docs), legal (contracts), insurance
- Tools/workflows: parse and align tables, footnotes, and charts; surface section-anchored facts to QA agents; verify consistency between text and visuals
- Assumptions/dependencies: organizational policies on automated document analysis; human-in-the-loop signoff for decisions
- Government/open-data publication with editable figures
- Sectors: public sector, NGOs, civic tech
- Tools/workflows: publish reports where figures are vectorized and reusable; enable downstream remixing and transparency
- Assumptions/dependencies: procurement/IT approvals; open-data licenses; training non-technical staff in new workflows
- Legal e-discovery and redaction at vector-level precision
- Sectors: legal, compliance, public records
- Tools/workflows: detect and redact sensitive graphical annotations (e.g., in diagrams) by editing SVG components rather than blurring bitmaps
- Assumptions/dependencies: robust detection of sensitive content; audit trails for redaction processes
- Personal document management and study aids
- Sectors: daily life, education
- Tools/workflows: scan bills, syllabi, lecture slides; export clean notes with vectorized diagrams for annotation and search; lightweight local deployments with 3B model
- Assumptions/dependencies: consumer hardware/GPU capabilities; privacy-preserving local inference
- Vendor benchmarking and QA using OCR Arena Elo protocol
- Sectors: procurement, platform teams, ML quality assurance
- Tools/workflows: adopt the paper’s judge-based, symmetry-controlled Elo evaluation to compare document parsing vendors/models under realistic quality criteria
- Assumptions/dependencies: acceptance of LLM-as-a-judge; stability depends on judge model versioning and bias controls
Long-Term Applications
These require further research, scaling, domain adapters, or ecosystem standards beyond the current model release.
- End-to-end, one-pass “parse-everything” document reconstruction
- Sectors: cross-industry document pipelines
- Tools/workflows: a unified pass that outputs text, tables, formulas, and graphics code in a single ordered sequence; simplifies orchestration and latency
- Assumptions/dependencies: model scaling and decoding strategies for very long, heterogeneous outputs; reliability on edge cases
- Domain-specific code targets beyond SVG (TikZ, D3.js, CAD, circuit/chemical markups)
- Sectors: scientific publishing, engineering, EDA, pharma/chemistry, data journalism
- Tools/workflows: image-to-TikZ for LaTeX pipelines; image-to-D3 for interactive web charts; image-to-CAD netlists or PCB diagrams; image-to-SMILES/InChI from chem diagrams
- Assumptions/dependencies: high-quality, aligned supervision; canonical forms for equivalent programs; rigorous render/round-trip verification
- “Chart provenance” and fraud detection
- Sectors: finance, auditing, journalism, public policy
- Tools/workflows: reconstruct chart code and compare to stated data; detect inconsistent scales, truncated axes, or doctored visualizations
- Assumptions/dependencies: reliable mapping from SVG geometry to data series; standards for chart auditing and evidence chains
- Interactive knowledge bases that include executable figures
- Sectors: enterprise knowledge management, education, research repositories
- Tools/workflows: store figures as code-first assets linked to text; enable parametric updates (e.g., swap data, regenerate figure) and “explain-then-edit” UIs
- Assumptions/dependencies: content management systems capable of versioning code-level graphics; permissions and authorship tracking
- Multimodal pretraining at web scale using image–code–text triples
- Sectors: AI/ML research, foundation model vendors
- Tools/workflows: large corpora built via MOCR for training VLMs that can reason over and synthesize structured visuals; curriculum strategies using render-verified supervision
- Assumptions/dependencies: compute and storage; data governance (copyright, privacy); automatic quality control and normalization at scale
- Advanced accessibility: semantic navigation and auto-summaries of complex figures
- Sectors: education, public sector, publishing
- Tools/workflows: convert figures to semantic graph representations; generate step-by-step verbal walkthroughs and tactile-printable surrogates
- Assumptions/dependencies: community standards for accessible graphics semantics; evaluation protocols with users
- Real-time mobile and on-device MOCR for field operations
- Sectors: logistics, manufacturing, healthcare, utilities
- Tools/workflows: on-device parsing of forms, labels, and schematics; offline workflows for remote sites
- Assumptions/dependencies: model compression/distillation for edge; high-res capture constraints; energy/performance trade-offs
- Human-in-the-loop document engineering IDEs
- Sectors: publishing, technical communications, software documentation
- Tools/workflows: editors where MOCR proposes structured parses; human accepts/edits with visual–code round-trip rendering; audit trails and diffing
- Assumptions/dependencies: UX for mixed text/SVG editing; robust undo/merge operations and conflict resolution
- Cross-domain diagram understanding (circuits, process flows, piping/instrumentation)
- Sectors: electronics, oil & gas, manufacturing, pharma
- Tools/workflows: parse diagrams into graph/netlist representations; enable simulation hookups, rule checks, and automated documentation
- Assumptions/dependencies: domain symbol libraries and ontologies; high-precision symbol grounding; safety-critical validation
- Compliance-grade pipelines (PII-safe, rights-aware, auditable)
- Sectors: finance, healthcare, government
- Tools/workflows: secure MOCR deployments with PII detection/redaction, lineage tracking from pixel to code, and legal audit support
- Assumptions/dependencies: robust PII/PHI detection; signed render verifications; policy and legal frameworks
- Robust benchmarking standards for structured parsing using judge ensembles
- Sectors: standards bodies, procurement, ML evaluation
- Tools/workflows: extend OCR Arena with judge ensembles, calibration datasets, and reproducible protocols for structured code outputs
- Assumptions/dependencies: community adoption; governance of judge updates and bias mitigation
- Automatic “design system” extraction and refactoring from product UIs
- Sectors: software/product design
- Tools/workflows: parse app screenshots into canonical component libraries (SVG + constraints); auto-generate style tokens and variants
- Assumptions/dependencies: coupling to design tools (Figma/Sketch); consistent mapping from parsed primitives to components
- Educational content transformation: from static textbook figures to interactive labs
- Sectors: education technology
- Tools/workflows: convert diagrams and charts into editable, interactive elements for exploration and assessment; align with curricula
- Assumptions/dependencies: pedagogy-aligned interaction models; authoring tools for instructors; content rights
Notes on Feasibility and Dependencies
- Current model behavior
- Two-pass operation: page-level text parsing and region-level image-to-SVG decoding are separate; a unified one-pass output is a future goal.
- Some imagery remains raster by design (e.g., natural photos without compact programmatic descriptions).
- The encoder expects high-resolution inputs for fidelity; hardware requirements may influence throughput.
- Data and evaluation
- Non-unique program representations necessitate canonicalization, render-based verification, and quality control.
- LLM-as-a-judge (OCR Arena) improves evaluation realism but depends on judge model stability and bias mitigation.
- Legal and governance
- Large-scale crawling and conversion of web/PDF assets require license review, PII/PHI scrubbing, and compliance with data-use policies.
- Integration
- Downstream tools may need adapters: SVG-to-tabular conversion for charts, SVG-to-framework code for UI, or SVG-to-domain markups.
- Human-in-the-loop validation remains important for high-stakes use cases (legal, healthcare, finance).
These applications leverage MOCR’s core advances—treating visual elements as first-class structured outputs, high-resolution parsing, and scalable image-to-code supervision—to move document processing from text-only OCR to faithful, executable multimodal understanding.
Glossary
- AI2D: A benchmark dataset for diagram understanding and reasoning. Example: "We also observe solid performance on OCRBench~\cite{liu2024ocrbench}, AI2D~\cite{kembhavi2016diagram}, CountBenchQA~\cite{paiss2023countclip}, and RefCOCO~\cite{yu2016modeling}, demonstrating that dots.mocr maintains broad visual grounding and reasoning abilities beyond parsing."
- autoregressive decoder: A model component that generates outputs token-by-token conditioned on previously generated tokens. Example: "For the autoregressive decoder, we use Qwen2.5-1.5B."
- bootstrap resampling: A statistical procedure that repeatedly resamples data to estimate the stability or variance of an estimate. Example: "Given that the final Elo ratings can be influenced by the specific sequence in which battles are processed, we incorporate bootstrap resampling to enhance statistical robustness."
- canonicalization: Converting different but equivalent representations into a standardized form; here, used to normalize SVG code. Example: "For visual-symbol parsing, instruction tuning is especially sensitive to target consistency, so SVG-specific handling (e.g., canonicalization, viewBox normalization, and complexity reduction) is treated as part of the data engine, while the training recipe focuses on integrating these refined signals into a stable multi-task SFT mixture."
- CDM: A structure-aware metric used to evaluate formula recognition quality. Example: "Traditional metrics such as Word Error Rate (WER) or Normalized Edit Distance (NED), as well as structure-aware scores like TEDS~\cite{zhong2020image} for tables and CDM~\cite{wang2025image} for formulas, often fail to reflect the true end-to-end quality of complex Markdown OCR outputs because they rely on rule-based matching to ground truth and are sensitive to non-unique but semantically equivalent serializations~\cite{horn2025benchmarking}."
- ChemDraw: A software/format for drawing chemical structures; used as a benchmark domain for reconstructing chemical diagrams. Example: "chemistry structure diagrams (ChemDraw~\cite{zhao2025vincicoder})."
- ChartMimic: A benchmark for reconstructing charts via programmatic code. Example: "scientific charts (ChartMimic~\cite{yang2024chartmimic});"
- Elo rating system: A probabilistic ranking method that updates scores based on pairwise match outcomes. Example: "To synthesize the outcomes of thousands of pairwise battles into a unified and interpretable leaderboard, we utilize the Elo rating system, a probabilistic ranking method originally developed for competitive games."
- image-to-SVG: The task of converting an image into an equivalent scalable vector graphics program. Example: "On structured graphics parsing, our model achieves higher reconstruction quality than Gemini 3 Pro across image-to-SVG benchmarks, demonstrating strong performance on charts, UI layouts, scientific figures, and chemical diagrams."
- ISVGEN: A reconstruction score from UniSVG that compares a rendered prediction to the original image. Example: "and compute the ISVGEN score (from UniSVG~\cite{li2025unisvg}) between the rendered result and the original image."
- LaTeX: A typesetting system widely used for mathematical and scientific documents. Example: "such as plain text, table markup, or \LaTeX{}."
- LLM-as-a-Judge: An evaluation paradigm where a LLM assesses and compares model outputs. Example: "we adopt an automated evaluation framework based on the LLM-as-a-Judge paradigm, referred to as OCR Arena."
- Multimodal OCR (MOCR): A document parsing paradigm that jointly parses text and graphics into unified structured outputs. Example: "We present Multimodal OCR (MOCR), a document parsing paradigm that jointly parses text and graphics into unified textual representations."
- OCR Arena: An automated, LLM-judged evaluation framework for document parsing quality with Elo aggregation. Example: "we adopt an automated evaluation framework based on the LLM-as-a-Judge paradigm, referred to as OCR Arena."
- OCRBench: A benchmark for evaluating OCR-related visual language understanding and reasoning. Example: "maintaining strong visual grounding and reasoning performance on OCRBench beyond parsing"
- perceptual hashing (pHash): An image hashing technique that produces similar hashes for visually similar images, used for deduplication. Example: "deduplication at both the code and image levels using textual matching and perceptual hashing (pHash) on rendered images."
- positional bias: A systematic preference influenced by the order in which options are presented. Example: "To ensure the integrity of our benchmarking and mitigate the well-documented issue of positional biasâwhere LLMs tend to favor the candidate presented firstâwe employ a rigorous symmetric evaluation protocol."
- raster crops: Pixel-based cutouts of image regions that lack structured semantics. Example: "Unlike traditional OCR pipelines that primarily recover text while leaving graphical regions as raster crops (Fig.~\ref{fig:compare}), MOCR treats both textual and visual elements as first-class parsing targets and converts them into reusable structured outputs."
- render-and-compare protocol: An evaluation approach that renders predicted code and compares it to the target image for similarity. Example: "This render-and-compare protocol provides a unified reconstruction-based metric across all datasets in Tab.~\ref{tab:unisvg_and_downstream}."
- renderable SVG code: Vector-graphics code that can be executed to produce an image, enabling structured reconstruction. Example: "document graphics are represented as renderable SVG code together with textual content, allowing charts, diagrams, and other visual elements to be reconstructed as structured representations that can serve as reusable supervision for downstream reasoning and multimodal pretraining."
- Structured graphics parsing: Recovering layout, geometry, and style from images into executable representations like SVG or HTML. Example: "Structured graphics parsing extends text parsing to the recovery of layout, geometry, and styling cues such as shapes, lines, and spatial relations, aiming to translate images into executable, renderable representations (for example, HTML, LaTeX, SVG, or Python) rather than character-level transcripts."
- svgo: A tool for optimizing and cleaning SVG files. Example: "During cleaning, we use svgo~\footnote{https://github.com/svg/svgo} to remove irrelevant metadata, normalize numeric precision, and standardize code structure,"
- TEDS: A tree-edit-distance-based similarity metric for evaluating table structure recognition. Example: "Traditional metrics such as Word Error Rate (WER) or Normalized Edit Distance (NED), as well as structure-aware scores like TEDS~\cite{zhong2020image} for tables and CDM~\cite{wang2025image} for formulas, often fail to reflect the true end-to-end quality of complex Markdown OCR outputs..."
- viewBox normalization: Standardizing the SVG viewBox attribute to a canonical coordinate frame for consistent rendering. Example: "SVG-specific handling (e.g., canonicalization, viewBox normalization, and complexity reduction) is treated as part of the data engine,"
- vision-LLMs (VLMs): Models that jointly process visual and textual inputs to perform multimodal tasks. Example: "Recent advances in vision-LLMs make it increasingly feasible to recover structured representations from document visuals rather than preserving them as pixels."
- visual grounding: The ability to align and reference generated content to specific visual regions or elements. Example: "maintaining strong visual grounding and reasoning performance on OCRBench beyond parsing"
Collections
Sign up for free to add this paper to one or more collections.