PaperBanana: Automating Academic Illustration for AI Scientists
Abstract: Despite rapid advances in autonomous AI scientists powered by LLMs, generating publication-ready illustrations remains a labor-intensive bottleneck in the research workflow. To lift this burden, we introduce PaperBanana, an agentic framework for automated generation of publication-ready academic illustrations. Powered by state-of-the-art VLMs and image generation models, PaperBanana orchestrates specialized agents to retrieve references, plan content and style, render images, and iteratively refine via self-critique. To rigorously evaluate our framework, we introduce PaperBananaBench, comprising 292 test cases for methodology diagrams curated from NeurIPS 2025 publications, covering diverse research domains and illustration styles. Comprehensive experiments demonstrate that PaperBanana consistently outperforms leading baselines in faithfulness, conciseness, readability, and aesthetics. We further show that our method effectively extends to the generation of high-quality statistical plots. Collectively, PaperBanana paves the way for the automated generation of publication-ready illustrations.

Paper Prompts
Sign up for free to create and run prompts on this paper using GPT-5.
Top Community Prompts
Explain it Like I'm 14
Brief Overview
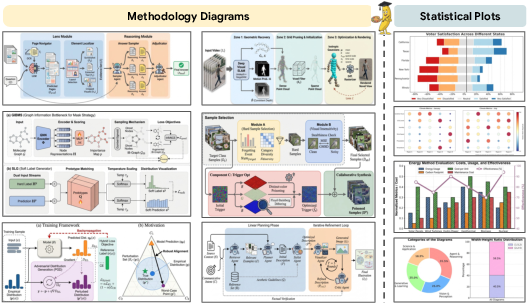
This paper introduces PaperBanana, a smart system that helps scientists automatically create clear, professional pictures for their research papers. These pictures include “methodology diagrams” (step-by-step visuals that show how a method works) and “statistical plots” (charts made from data). The goal is to save researchers time and make their ideas easier to understand.
Key Objectives
The researchers wanted to answer simple but important questions:
- Can an AI system turn a method description and a figure caption into a high-quality, publication-ready diagram?
- Can it follow academic style rules so the visuals look professional?
- Can it also make accurate statistical charts from data?
- How well does this system compare to other methods people use today?
Methods and Approach
Think of PaperBanana like a group project where each teammate has a special role. The system uses powerful AI models that understand both text and images to plan, draw, and polish figures.
The Agent Team
Here’s the “team” inside PaperBanana, explained with everyday roles:
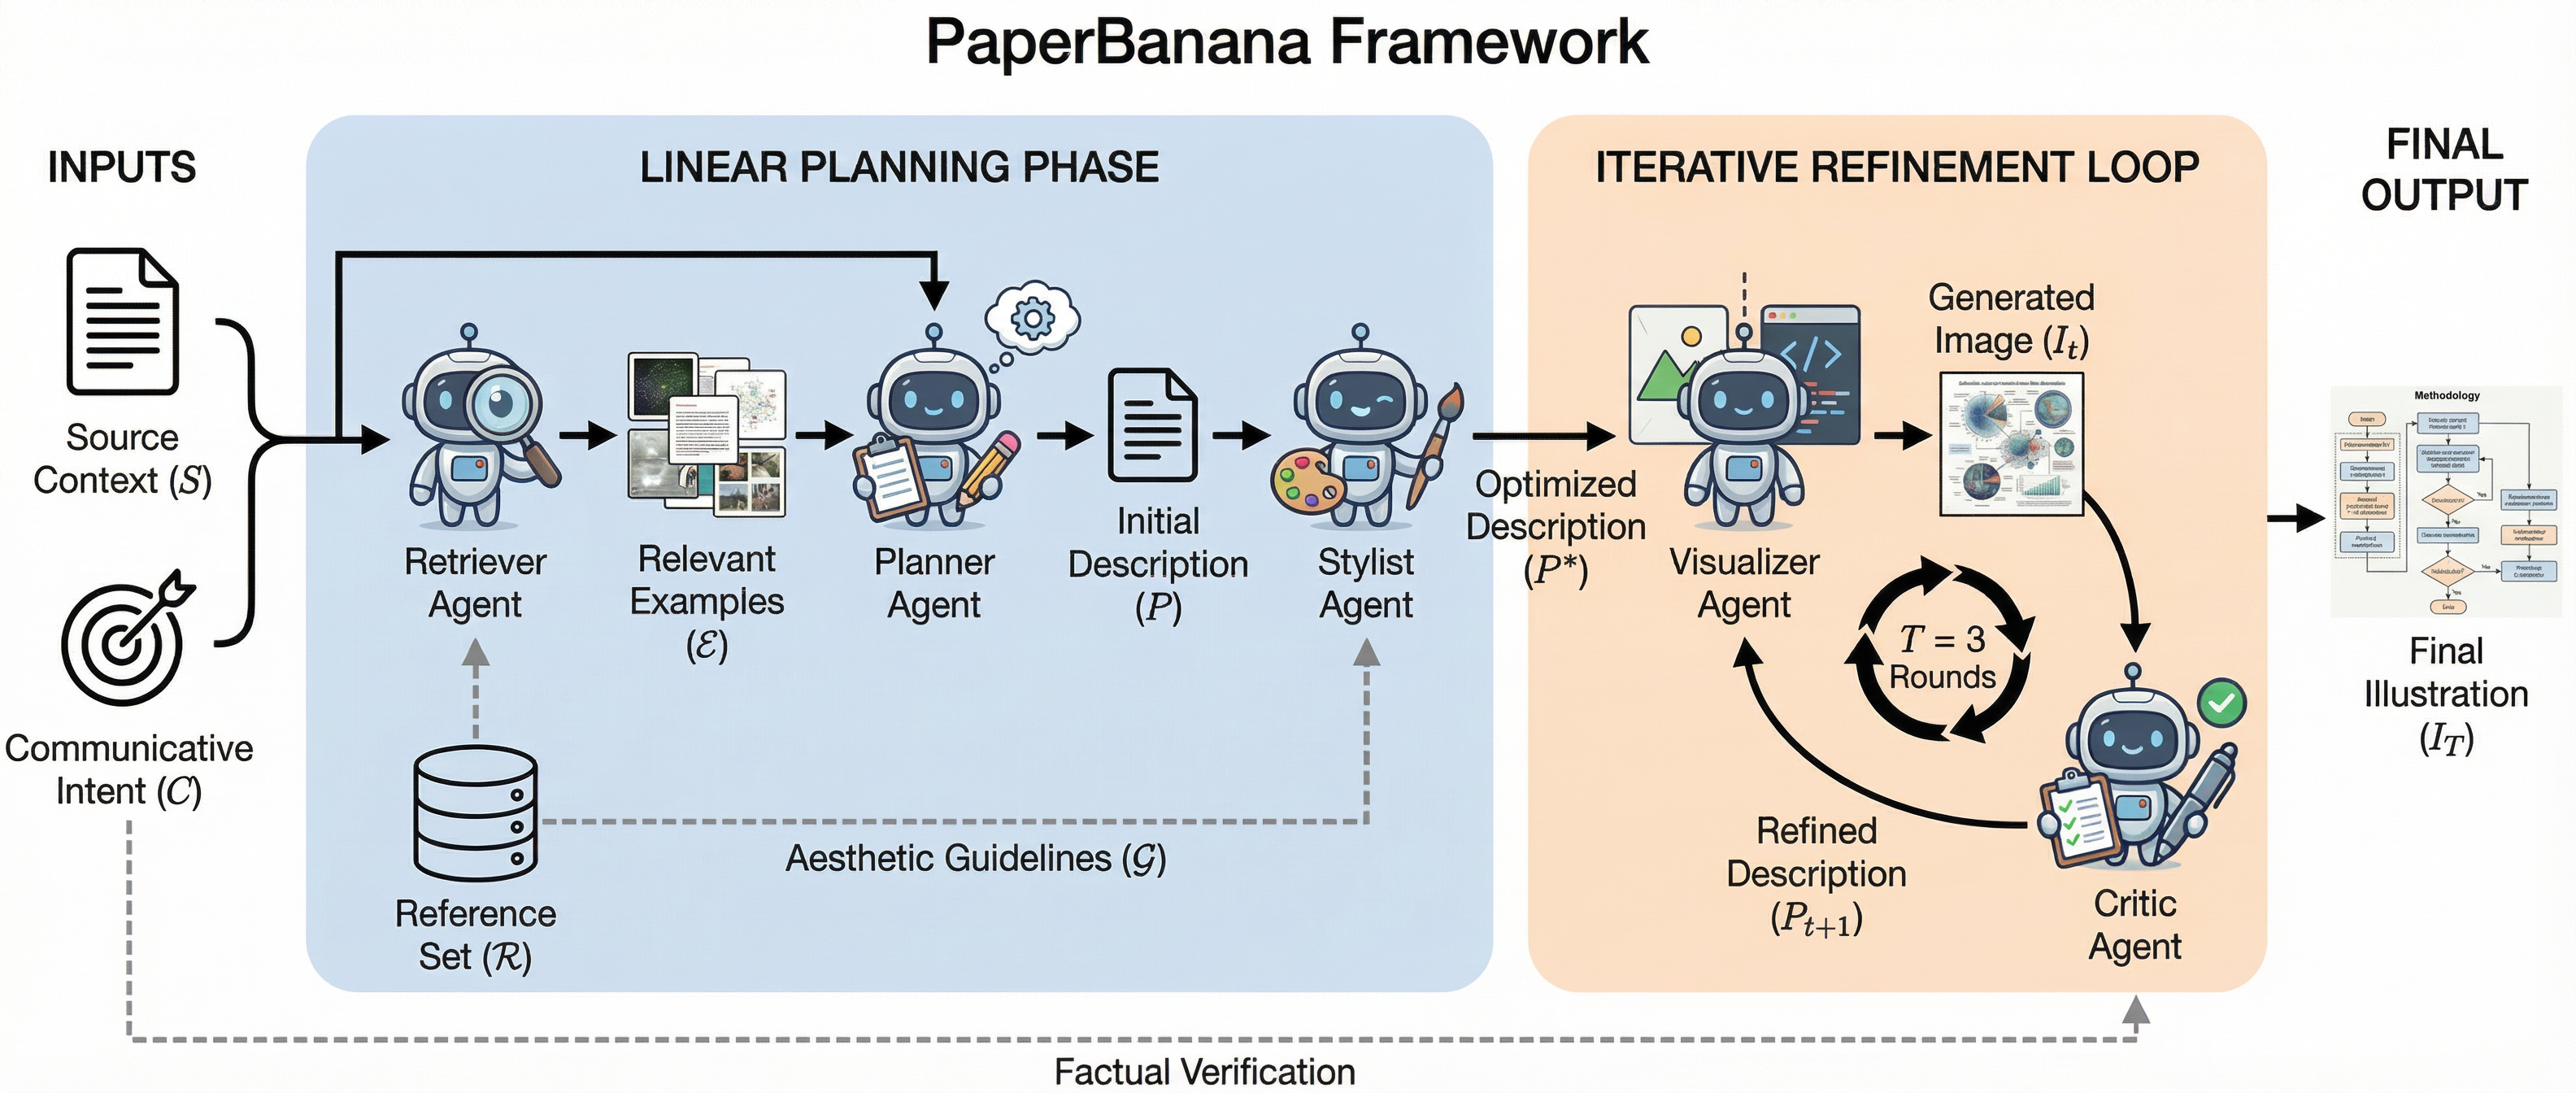
- Retriever (like a librarian): Finds good example figures from real papers to learn from, so the new figure follows common academic styles and layouts.
- Planner (like a project manager): Reads the method description and caption, then writes a detailed plan of what the figure should show and how it should be arranged.
- Stylist (like a graphic designer): Applies a set of style rules (colors, fonts, shapes, spacing) gathered from many academic figures to make the plan look professional.
- Visualizer (like an artist): Turns the styled plan into an actual image (or, for charts, into Python code that draws precise plots).
- Critic (like an editor): Reviews the image, checks it against the original text, points out mistakes or unclear parts, and asks for fixes. This edit-and-redraw loop happens a few times to make the figure better.
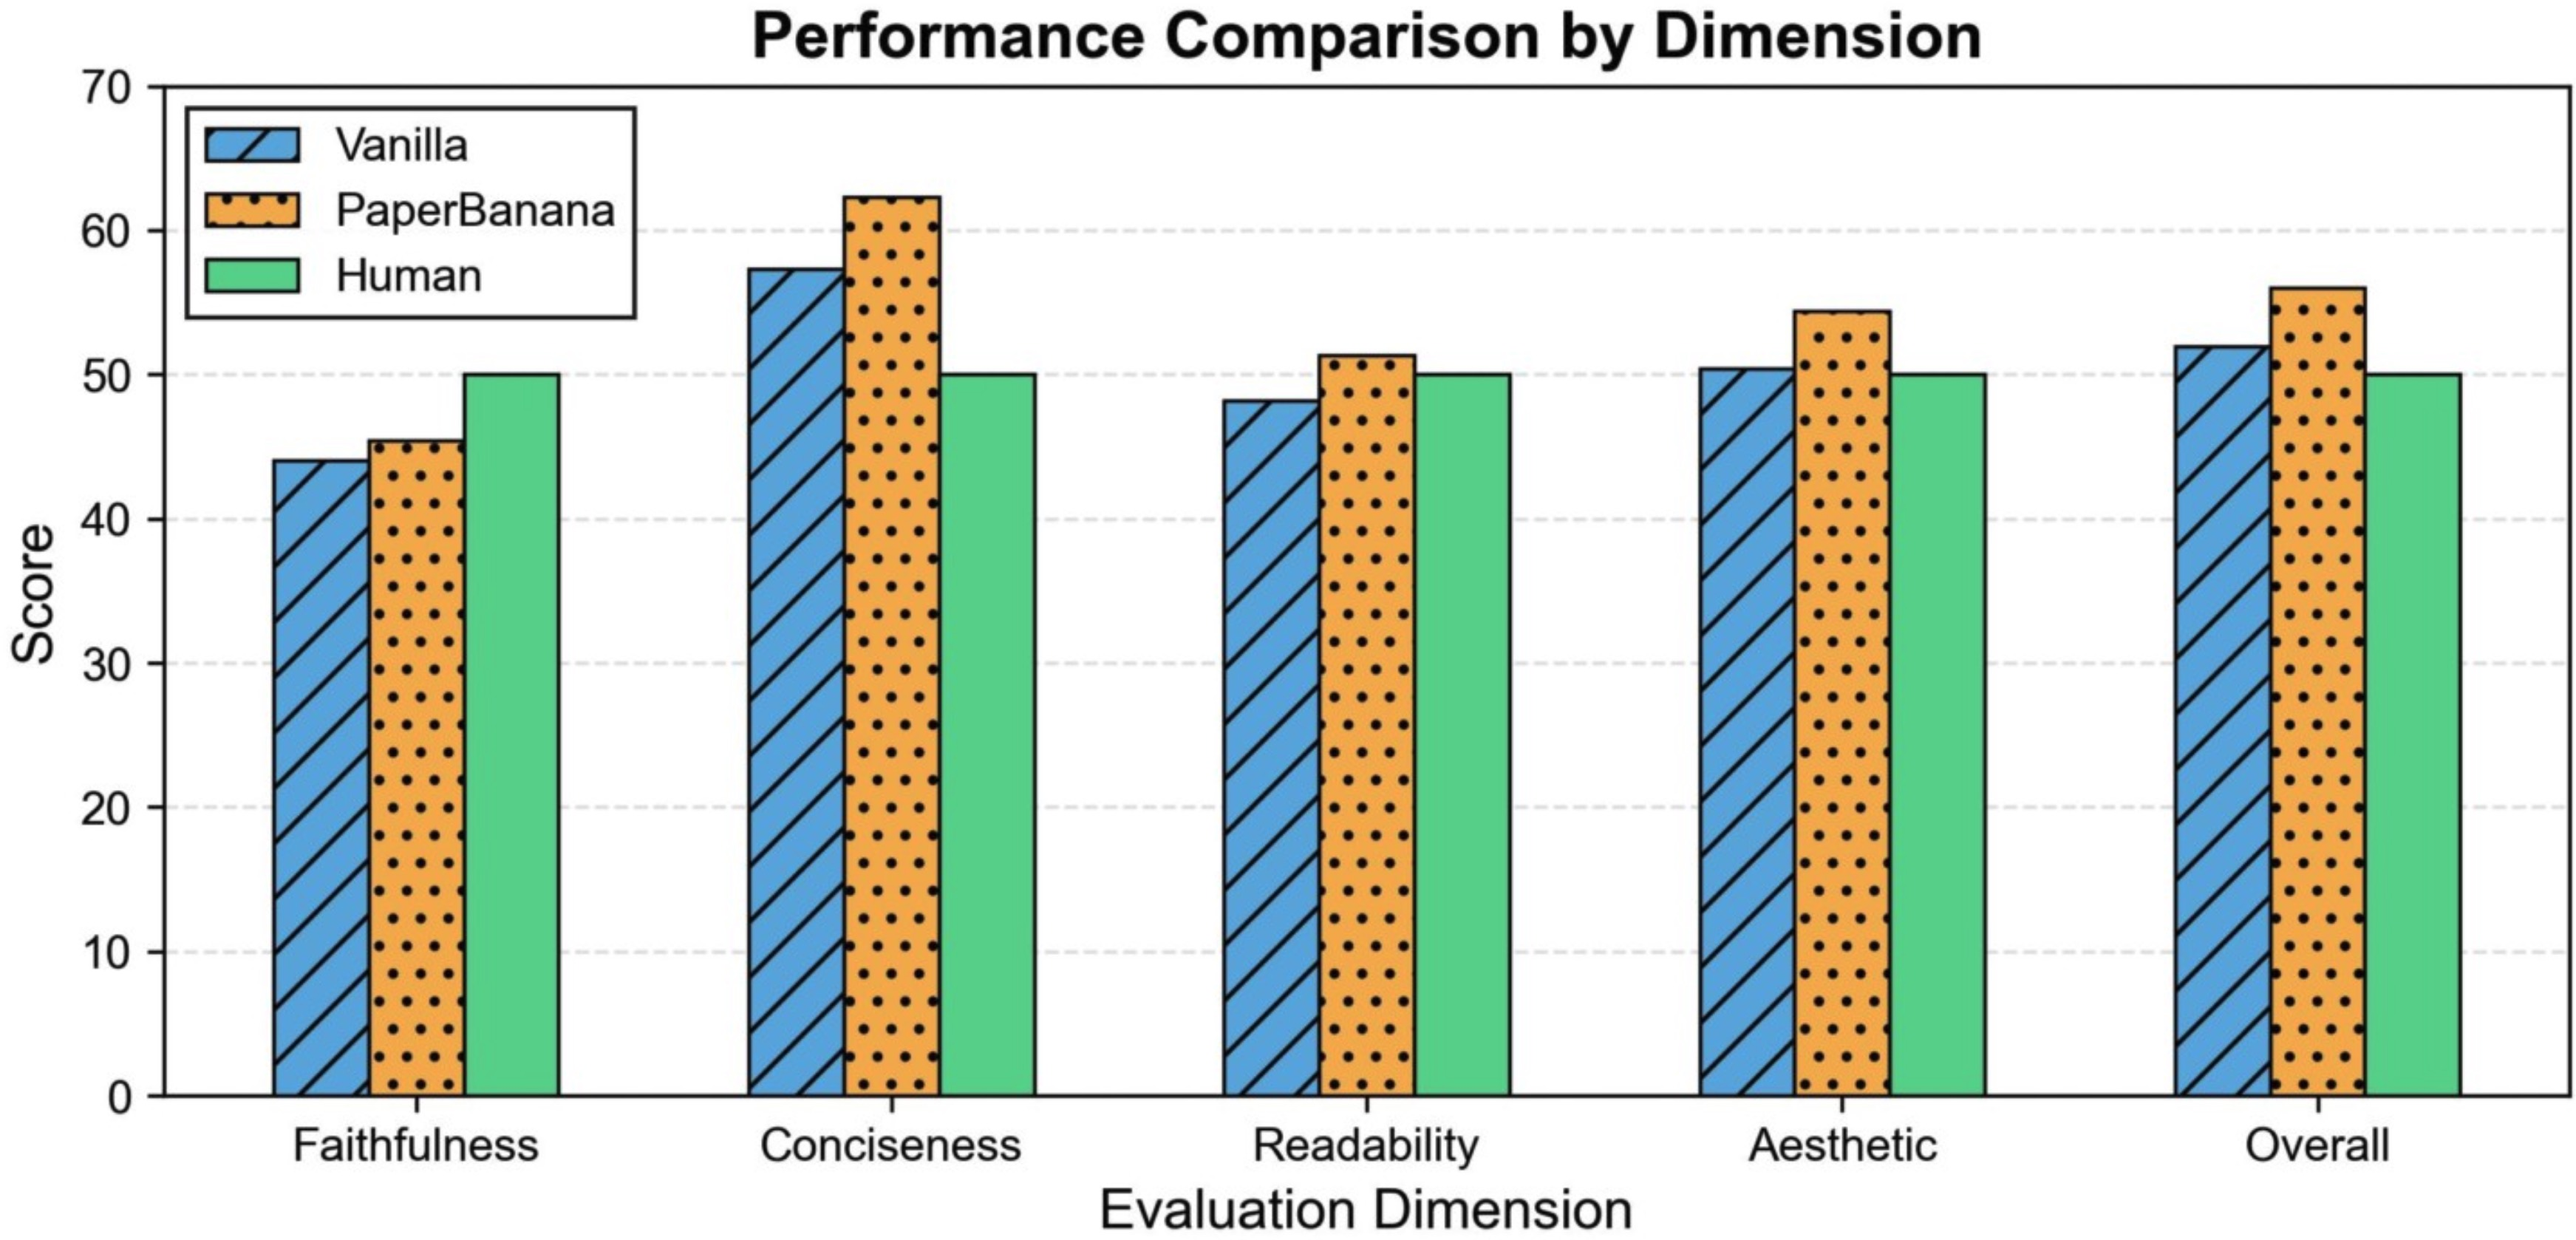
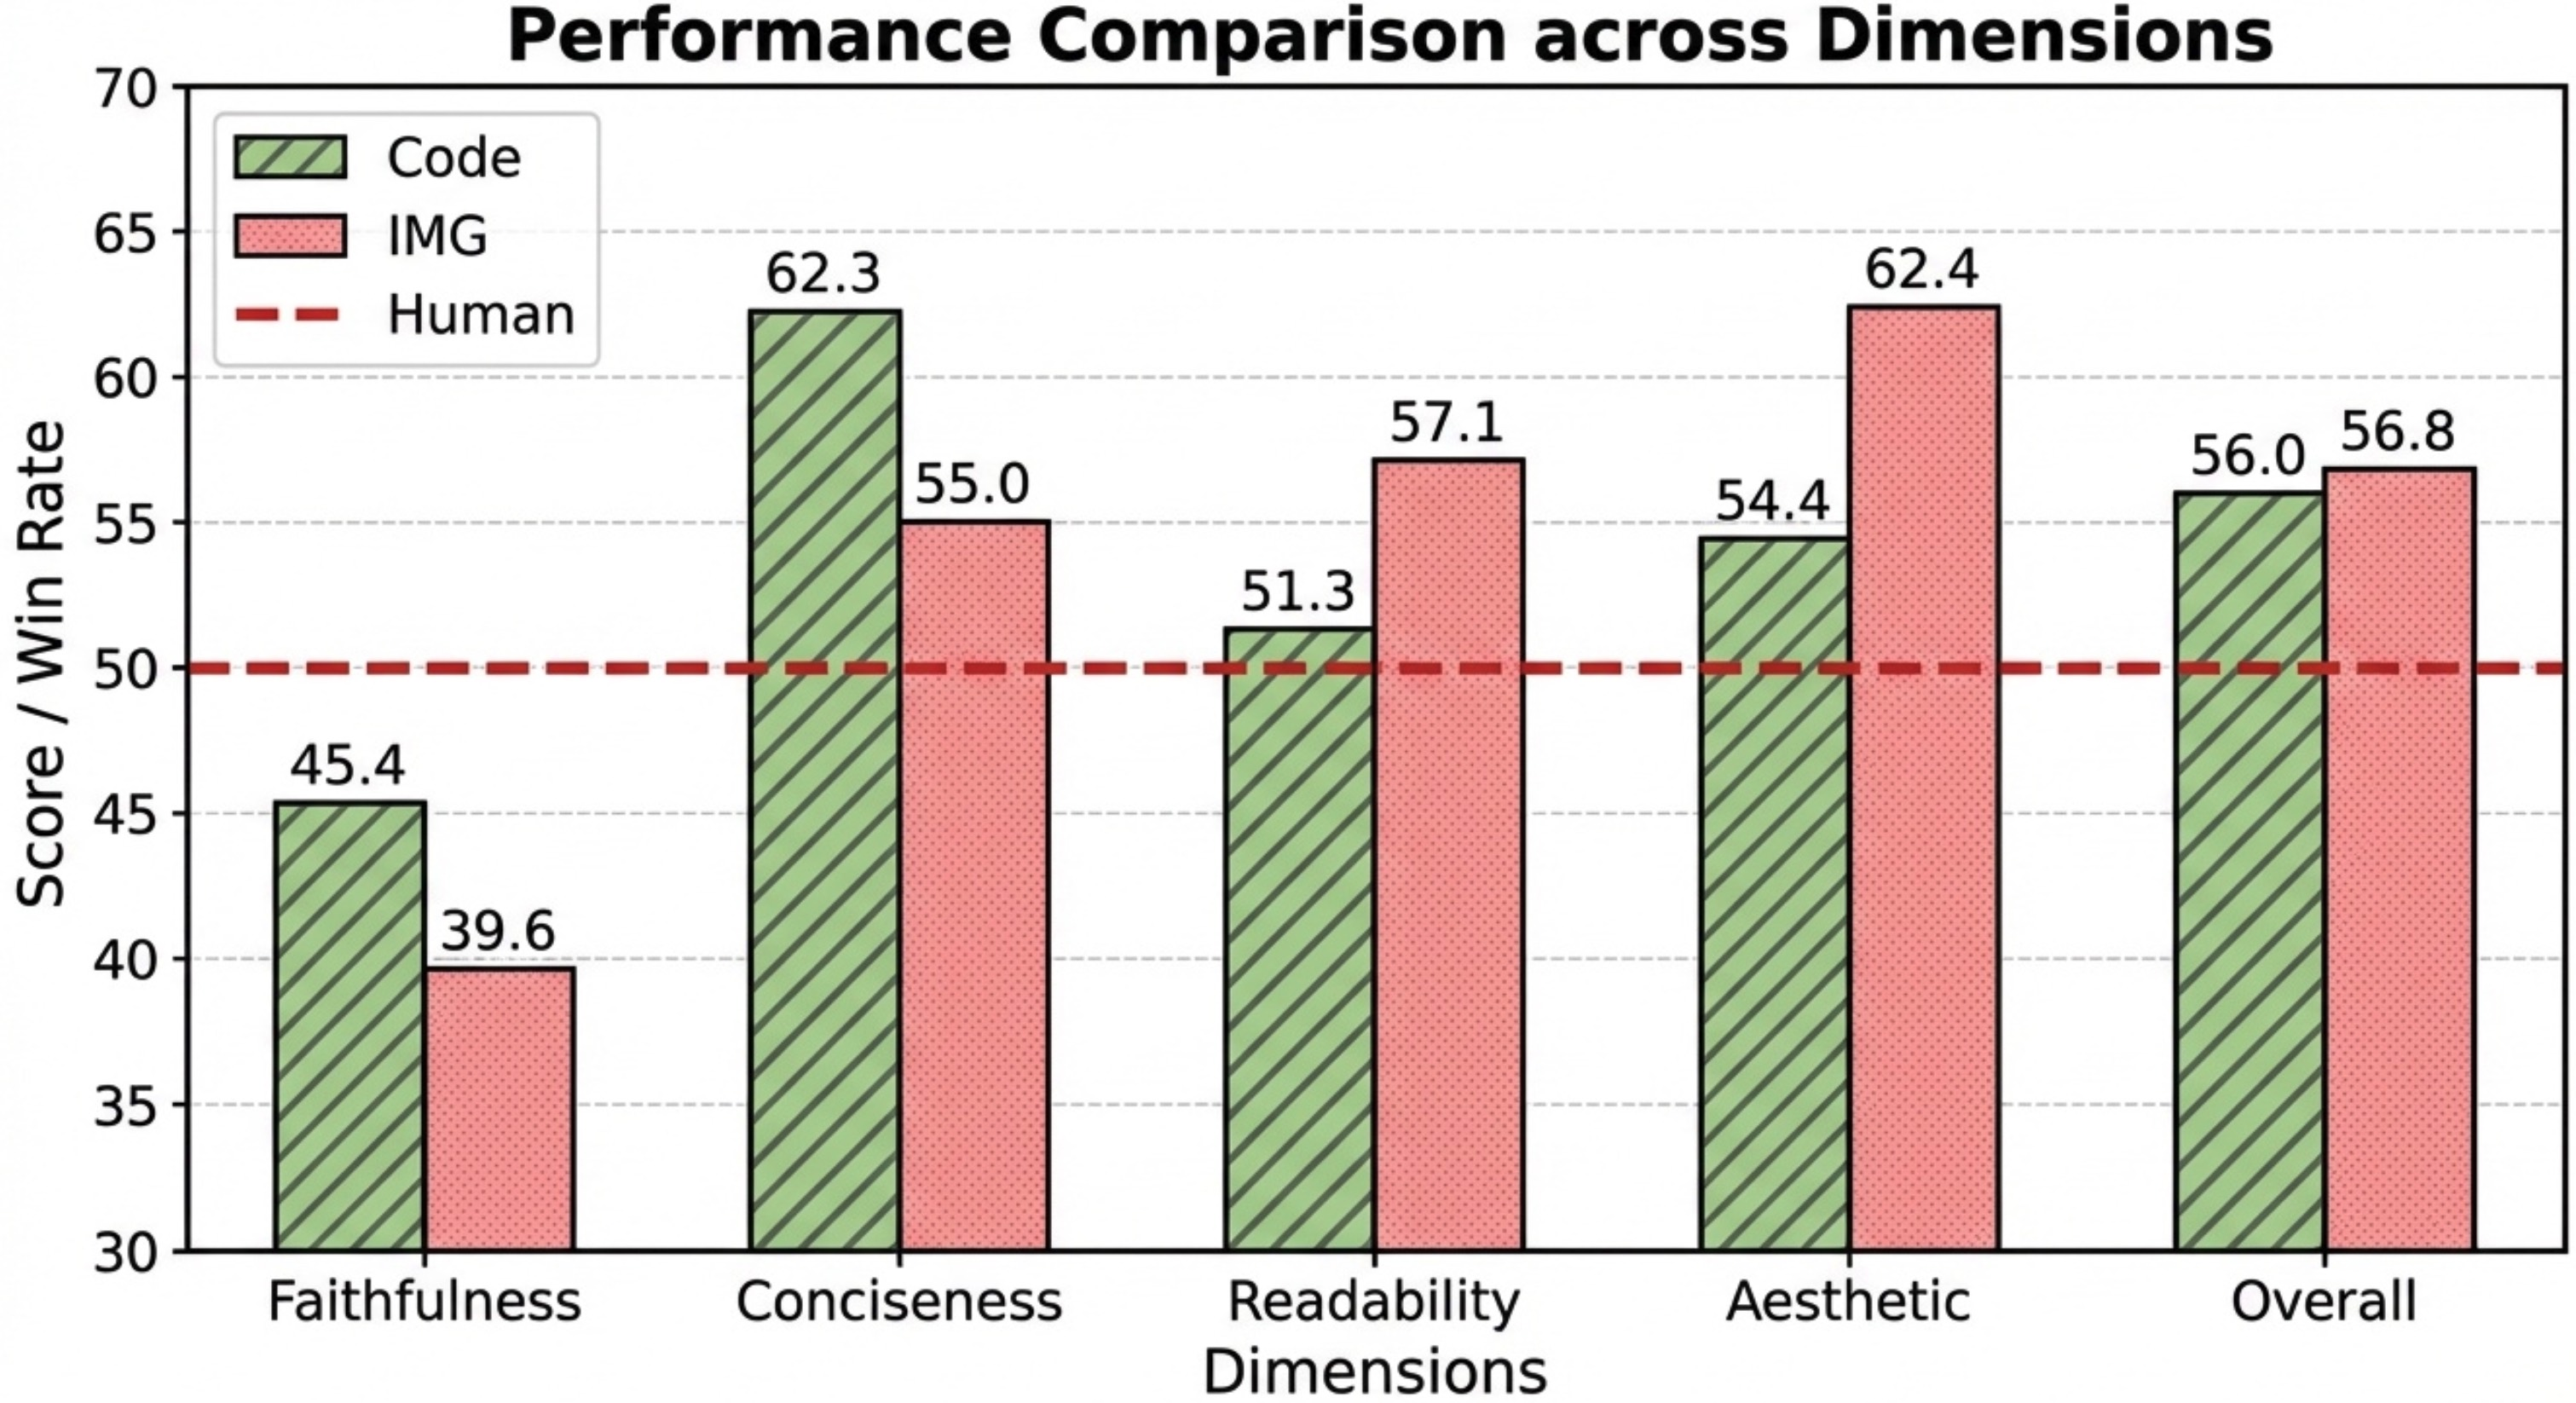
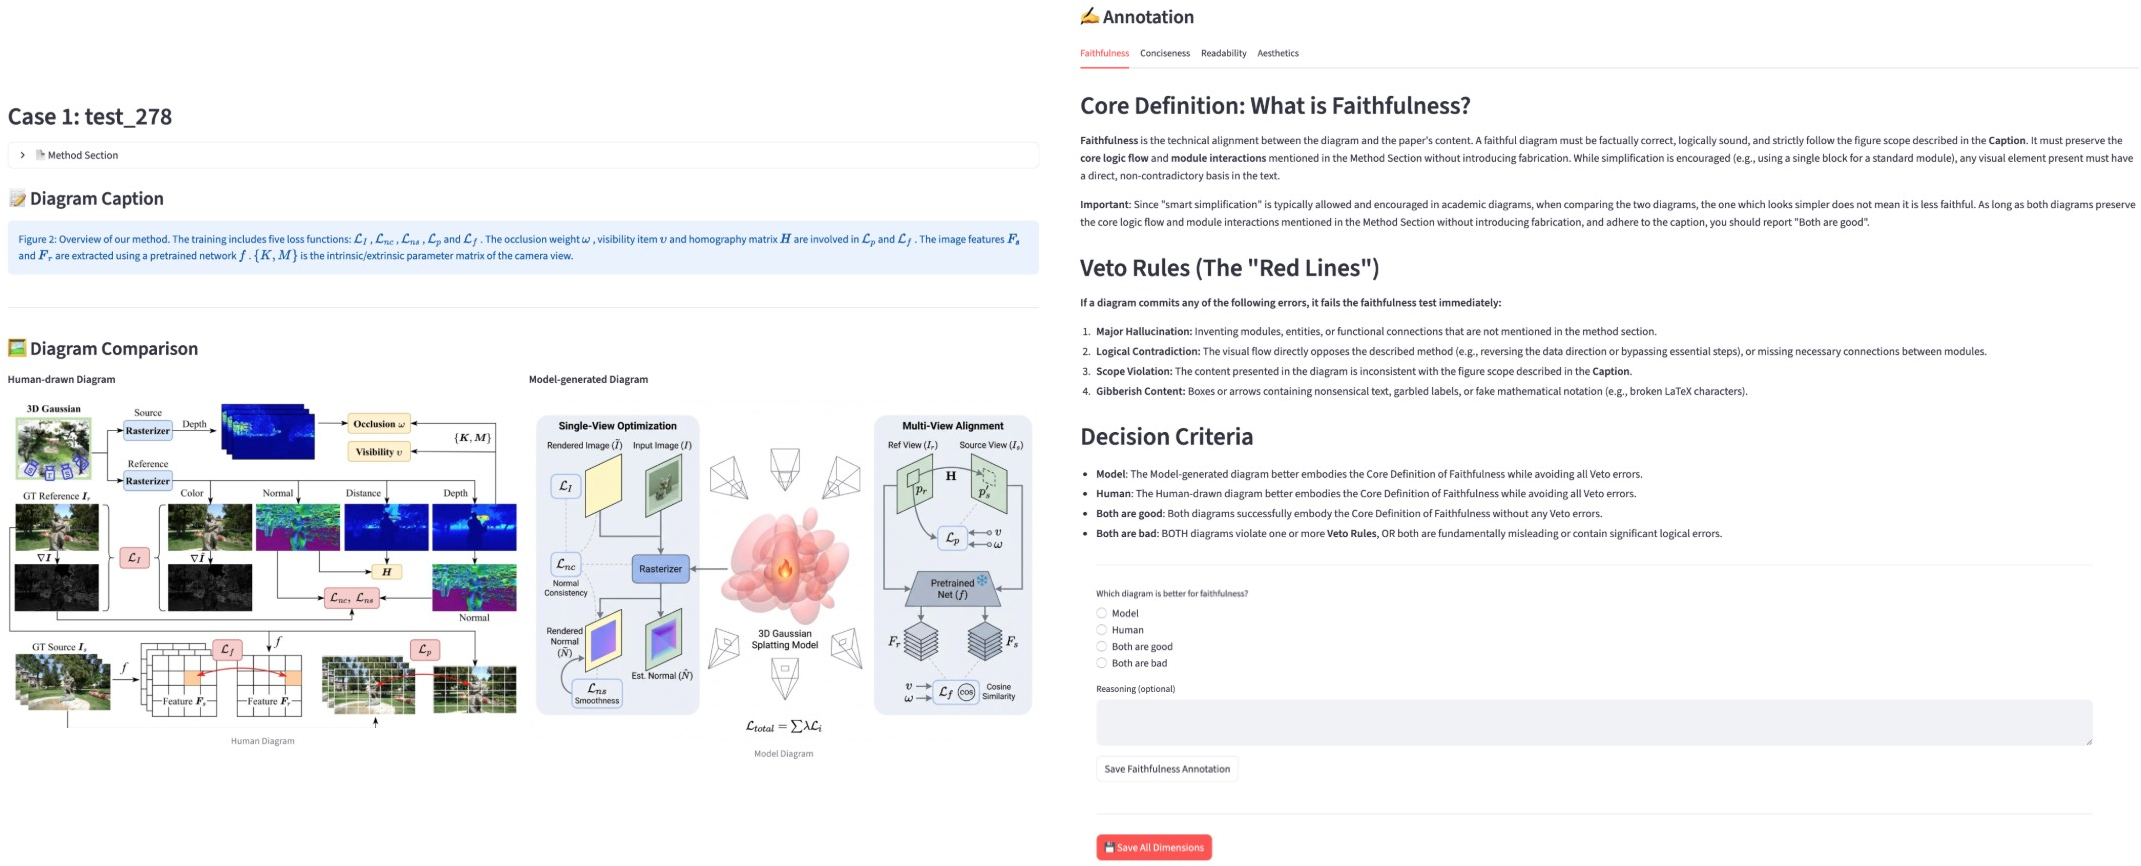
To judge how well PaperBanana works, the authors built a test set called PaperBananaBench. It contains 292 real methodology diagram cases from NeurIPS 2025 papers and another 292 references to guide retrieval. They then used an AI “judge” to compare the figures generated by PaperBanana with the original human-made figures across four important qualities:
- Faithfulness: Does the figure match the method description and caption?
- Conciseness: Does it focus on the essential parts without messy clutter?
- Readability: Is it easy to follow, with clear labels and logical layout?
- Aesthetics: Does it look like a clean, professional academic figure?
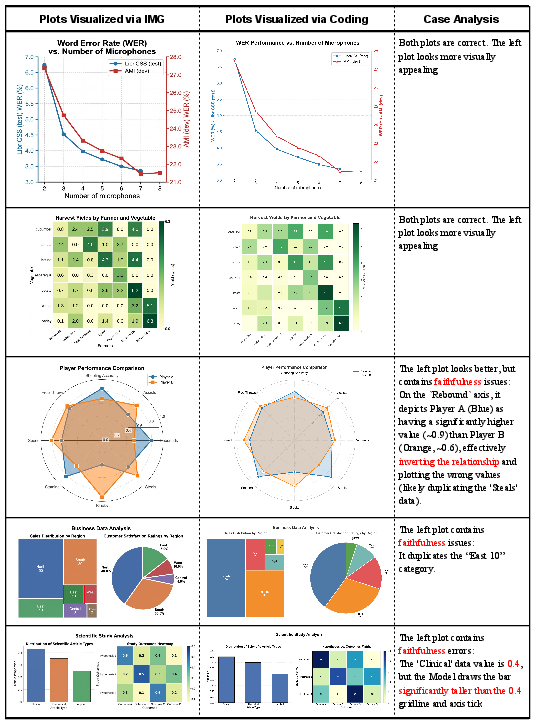
For statistical plots, PaperBanana mainly uses code (like Matplotlib in Python) to make sure numbers and axes are exact. It can also try image generation, but code is preferred for accuracy.
Main Findings
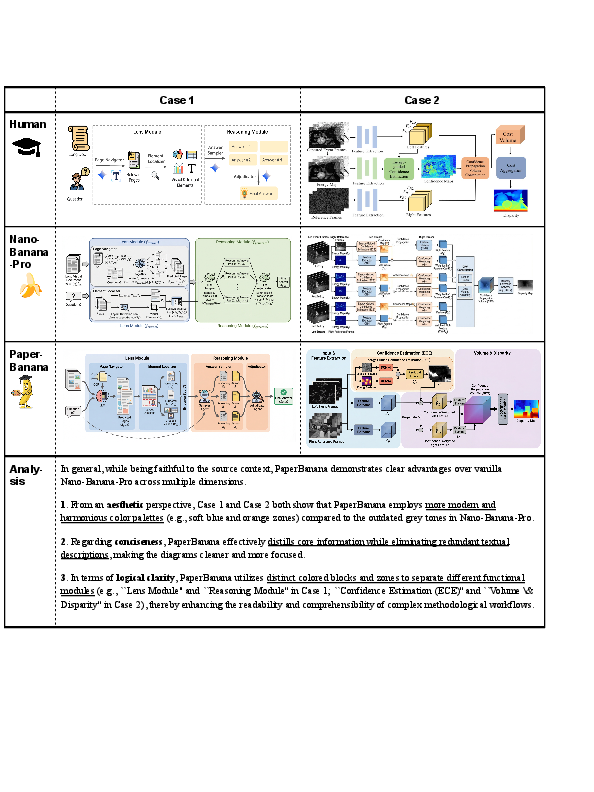
The experiments show that PaperBanana outperforms other approaches:
- It creates figures that are more faithful to the text, cleaner (more concise), easier to read, and more attractive.
- Overall, it improves the combined score by about 17% compared to a strong baseline.
- It also works well for statistical plots: using code helps keep details precise, while image generation looks nice but can sometimes get numbers wrong.
The team did extra tests (ablation studies) to see which parts matter most. They found:
- Having example references to learn from boosts style and clarity.
- The Stylist improves how figures look and reduces clutter, but the Critic is crucial to keep details correct.
- Iterating (editing and redrawing) a few times significantly improves results.
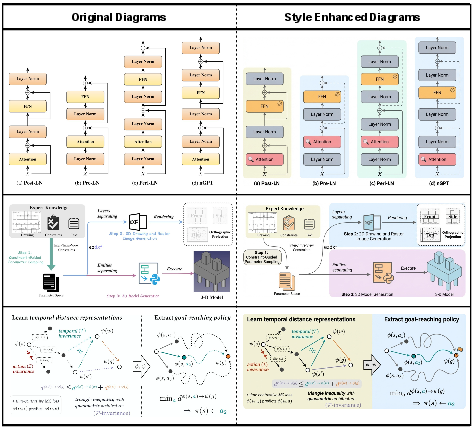
They even showed that their style rules can help polish existing human-made figures, often making them look better without changing the meaning.
Why This Is Important
Scientists don’t just discover things—they need to explain them clearly. Good figures are a huge part of that, but making them is time-consuming and requires design skill. PaperBanana:
- Saves time by automating figure creation.
- Helps researchers communicate complex ideas more clearly.
- Makes academic visuals more consistent and professional.
- Extends to precise data charts, which are essential in science and engineering.
Implications and Future Impact
This research suggests several helpful changes for the future:
- Editing: Today’s outputs are images that can be hard to edit. Future versions may produce fully editable vector graphics (like those made in Adobe Illustrator) so scientists can tweak details more easily.
- Style flexibility: PaperBanana uses a unified academic style. Future systems could adapt to different journal styles or personal preferences while staying professional.
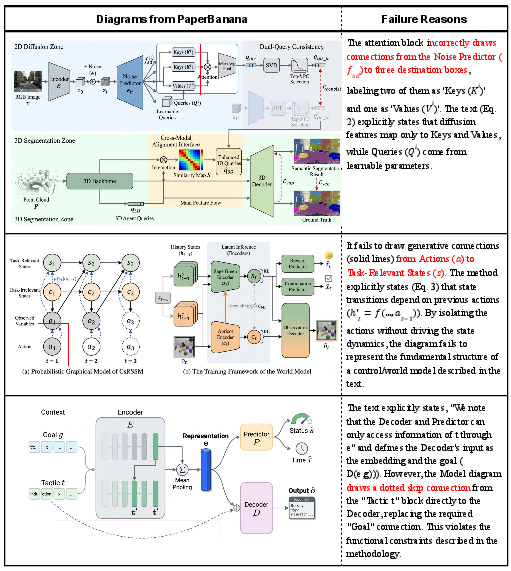
- Even better accuracy: The system is strong but still misses some tiny details (like exact arrow direction) compared to humans. Improving fine-grained visual checking will help.
- Smarter evaluation: AI judges already align well with human opinions, but future metrics could check structure more precisely and better reflect human tastes in aesthetics.
- More choices: Instead of one result, generate several styled options so users can pick the one they like best.
- Beyond academic papers: The same approach—learning from examples and applying style rules—could help in UI/UX design, patent drawings, or industrial diagrams where clarity and standards are crucial.
In short, PaperBanana shows that AI can be a helpful teammate for scientists, turning complex text into clear, polished visuals and making research communication faster and easier.
Knowledge Gaps
Knowledge gaps, limitations, and open questions
The following list synthesizes concrete gaps and open questions that remain unresolved:
- Vector editability: Outputs are raster images; how to generate fully editable vector graphics (e.g., SVG/AI) with preserved semantics (layers, text, symbols) and evaluate editability cost and fidelity.
- Faithfulness at fine granularity: Frequent connectivity/arrow-direction errors persist; need graph-structured parsing/verification (e.g., OCR + edge/arrow detectors, graph extraction, consistency checks) and benchmarks that score structural correctness.
- Critic reliability: VLM-based critics miss subtle visual errors; what hybrid critics (perception models, differentiable renderers, structure checkers) or training strategies best improve error detection and self-correction; optimal iteration budgets and stopping criteria.
- Retrieval value and policy: Random retriever performs similarly to semantic retrieval in ablations; quantify when semantic retrieval matters, effect of N references, diversity vs. specificity, and learned selection/routing policies.
- Style guideline generality: Auto-synthesized aesthetic guide is derived from the same reference pool; verify transfer to different venues/fields (e.g., biology, physics), publisher style guides, and non-ML communities; mechanisms for controllable and personalized styles without collapsing diversity.
- Plagiarism and IP risk: Reference-driven generation may imitate layout/iconography; define and measure similarity thresholds, copyright-safe style transfer, and de-duplication/novelty checks to prevent near-copies.
- Benchmark scope and bias: PaperBananaBench is limited to NeurIPS 2025 and aspect ratios [1.5, 2.5]; assess generalization to other conferences, journals, domains, multi-panel figures, tall/square formats, and cross-lingual content.
- Evaluation validity and reliability: VLM-as-judge shows only moderate correlations on a small (n=50) human validation; need larger, multi-rater human studies (with IAA), confidence intervals, significance tests, and sensitivity analyses.
- Structural metrics: Lack of objective, structure-aware measures (e.g., diagram graph match, label placement error, arrow crossing count); integrate rubric- and graph-based metrics for faithfulness/readability.
- Aggregation bias: Hierarchical aggregation may bias rankings; evaluate alternative weighting schemes, learning-to-rank, and robustness of conclusions to metric choices.
- Statistical plots numerical correctness: Current evaluation relies on VLM judges; add ground-truth data checks (value-level comparisons), pixel-to-data alignment, unit tests, and verification of axis scales/legends/units.
- Plot code execution safety: No discussion of sandboxing, dependency control, and resource limits for generated code; define secure execution policies and failure handling.
- Hybrid plot visualization routing: Formalize when to use code vs. image generation (e.g., density/complexity thresholds) and learn an automatic router; quantify trade-offs across plot types and complexities.
- Computational efficiency: Missing latency, token usage, GPU/CPU cost, and energy metrics; profile cost per agent, scalability with context length/reference set size, and budget-aware generation strategies.
- Reproducibility and openness: Heavy dependence on proprietary models (Gemini-3-Pro, Nano-Banana-Pro, GPT-Image-1.5); assess with open-source backbones, release full prompts/datasets, and analyze model/version drift.
- Robustness to input quality: Performance with noisy/incomplete/ambiguous methodology text, shorter captions, or conflicting sources is untested; conduct stress tests and robustness analyses.
- Multilingual and symbol-heavy content: Support for non-English typography, CJK scripts, math notation, and LaTeX symbols in diagrams remains unexplored; evaluate text rendering quality and OCR integrity across languages.
- Accessibility and readability: No evaluation of color-blind safety, minimum font sizes, contrast ratios, and print-vs-screen legibility; add automatic accessibility checks and user studies.
- Human-in-the-loop workflows: Current single-output automation lacks interactive controls; develop candidate generation (test-time scaling), preference modeling, and UI for iterative human edits/approval.
- Failure taxonomy: Limited qualitative analysis; produce a systematic taxonomy and quantitative breakdown (e.g., mislabels, text overflow, icon misuse, arrow routing, overcrowding) to guide targeted fixes.
- Model breadth: Only two image generators evaluated; test across a wider set (including open-source models) and versions to assess model-agnosticity and robustness.
- Diagram diversity: Beyond methodology diagrams, capability for timelines, complex architectures with equations, agent interactions with math, hardware schematics, and scientific apparatus remains untested.
- Aspect ratio and layout generality: Restricted aspect ratios exclude square/tall and multi-panel figures; investigate layout-aware planning and model performance across varied formats and resolutions.
- Similarity leakage across sets: Retrieval and style guide are built from the same conference distribution as the test set; quantify distribution shift sensitivity and potential leakage in stylistic patterns.
- Plot benchmark curation fidelity: Data extracted from ChartMimic code via VLM may contain errors; audit extraction quality and release validated ground-truth datasets.
- Security and privacy: Pipeline processes PDFs that may contain sensitive content; define privacy-preserving parsing, data governance, and memorization safeguards.
- Downstream impact: No user studies on researchers’ productivity, reviewer comprehension, or acceptance outcomes; design controlled studies measuring real-world benefits and risks.
- Editability roadmap: Proposed vectorization/GUI-agent ideas remain conceptual; compare strategies (direct SVG synthesis vs. reconstruction vs. GUI control) with measurable edit time, fidelity, and robustness.
Practical Applications
Below is a structured synthesis of practical, real-world applications enabled by the paper’s findings, methods, and innovations. Each item includes sectors, potential tools/workflows, and key assumptions or dependencies.
Immediate Applications
- Automated methodology diagram generation for research papers
- Sectors: Academia (CS/AI, natural sciences), R&D across industry
- Tools/workflows: PaperBanana-like agent with Retriever–Planner–Stylist–Visualizer–Critic; integration as an Overleaf/LaTeX plugin or Google Docs/MS Word add-on; figure export in high-resolution raster (e.g., 4K PNG)
- Assumptions/dependencies: Access to capable VLMs and image generators (e.g., Gemini-3-Pro, Nano-Banana-Pro); high-quality method text and captions; journal acceptance of raster figures; human oversight for faithfulness
- Statistical plot generation from data and brief descriptions
- Sectors: Academia, Data science teams (software, finance), Policy analysis, Energy & utilities, Healthcare analytics
- Tools/workflows: Code-based Visualizer (Matplotlib) with Critic loop; JupyterLab/VS Code extension; automated chart creation from CSV/JSON and short plot specs
- Assumptions/dependencies: Executable Python environment; clean/tabular data; sandboxed code execution; basic plotting libraries installed; users verify numerical fidelity
- Aesthetic polishing of existing human-drawn figures
- Sectors: Academia, Scientific publishing, Corporate communications
- Tools/workflows: Apply auto-synthesized Aesthetic Guideline to suggest and enact refinements (colors, typography, layout); before/after review workflow
- Assumptions/dependencies: Legal rights to edit figures; image generator with reliable inpainting/editing; acceptance of stylistic standardization
- Internal documentation and SOP diagrams
- Sectors: Healthcare (clinical workflows), Manufacturing (SOPs), Energy (grid/process flows), Robotics (pipeline overviews), Software (DevOps/ML Ops)
- Tools/workflows: Extract steps from SOPs/runbooks; produce concise flowcharts/pipelines with readability constraints (line crossings, consistent arrows, containers)
- Assumptions/dependencies: Secure, on-prem or VPC deployment for sensitive docs; domain-specific icon packs; policy-compliant handling of PHI/PII
- Engineering and product architecture diagrams
- Sectors: Software & cloud (systems diagrams, API flows), Telecommunications, Fintech infrastructure
- Tools/workflows: Planner maps design specs to canonical architectures (services, queues, databases) with Stylist enforcing house style; integration with wikis and design docs (Confluence, Notion)
- Assumptions/dependencies: Access to up-to-date service/icon libraries; validation of component names; preference for vector outputs may necessitate later reconstruction
- Grant proposals and project pitch visuals
- Sectors: Academia, Non-profits, Startups, Corporate R&D
- Tools/workflows: Generate “overview of our approach” figures aligned to agency/journal style; multi-round refinement for clarity and concision
- Assumptions/dependencies: Clear communicative intents (captions) and narratives; PI review for accuracy; agency-specific style compliance
- Teaching and learning materials
- Sectors: Education (higher-ed, MOOCs, professional training)
- Tools/workflows: Convert lecture notes/labs into pipeline diagrams and plots; batch generation for slide decks; consistent academic style for legibility
- Assumptions/dependencies: Instructor-curated prompts to avoid hallucinations; institutional accessibility policies (e.g., color-blind-safe palettes)
- Enterprise knowledge summarization into diagrams
- Sectors: Consulting, Enterprise IT, Pharma/Biotech, Energy
- Tools/workflows: Retrieval over internal repositories (wikis, design docs) to assemble cross-cutting process maps, RACI charts, and data flows
- Assumptions/dependencies: Robust enterprise retrievers; permissions and security controls; monitoring for leakage or misrepresentation
- Editorial pre-checks with VLM-as-a-Judge
- Sectors: Academic publishing, Conference organizers
- Tools/workflows: Automated triage for figure faithfulness/readability/aesthetics before peer review; flagging issues for revision
- Assumptions/dependencies: Calibrated rubrics; human-in-the-loop for final decisions; guardrails to avoid penalizing novel styles
- Report-ready data visualizations for policy and finance
- Sectors: Government agencies, NGOs, Finance, Market research
- Tools/workflows: Code-based plot generation from datasets; enforce succinct labels, consistent palettes, and annotation standards; batch processing pipelines
- Assumptions/dependencies: Data provenance tracking; reproducibility requirements; governance around automated chart creation in regulated settings
Long-Term Applications
- Vector-native, fully editable figure generation
- Sectors: Academia, Professional publishing, Design teams
- Tools/workflows: GUI Agent operating Illustrator/Figma to produce SVG/AI; structured element extraction and placement; direct vector export pipeline
- Assumptions/dependencies: Advanced perception/interaction agents; robust element detection and grouping; tool APIs and automation stability
- Preference-aware, multi-candidate generation and selection
- Sectors: All visual-communication-heavy domains
- Tools/workflows: Test-time scaling to generate diverse styles/layouts; ranking by learned preference models or human feedback loops
- Assumptions/dependencies: Cost-effective generation at scale; reward models trained on human preferences; UI for side-by-side selection
- Aesthetics reward modeling and improved evaluation metrics
- Sectors: Publishing platforms, Design tooling
- Tools/workflows: Train preference/reward models for aesthetics/readability; structure-aware faithfulness metrics (graph topology checks)
- Assumptions/dependencies: High-quality human-labeled datasets; agreement on standardized rubrics across communities; compute for RLHF-like pipelines
- Fine-grained faithfulness verification and self-correction
- Sectors: Safety-critical industries (Healthcare, Aviation), Scientific publishing
- Tools/workflows: Detect miswired arrows, mislabeled modules, subtle connectivity errors; automatic critique and regenerate with constraints
- Assumptions/dependencies: Stronger VLM perception; structured intermediate representations (e.g., scene graphs) for verifiable constraints
- Automatic hybridization of code- and image-based plotting
- Sectors: Data science, BI, Journalism
- Tools/workflows: Policy that routes sparse/simple plots to image models and dense/complex plots to code; automated decision logic and provenance records
- Assumptions/dependencies: Reliable complexity estimators; consistent aesthetic alignment between two renderers; reproducibility tracking
- Expansion to UI/UX wireframes and design system diagrams
- Sectors: Software, Product design
- Tools/workflows: Generate wireframes from requirements; align to design systems; retrieval for component examples and style tokens
- Assumptions/dependencies: Access to design system specs; integration with design tools; acceptance of AI-assisted prototyping
- Patent drawings and industrial schematics
- Sectors: Legal/Intellectual property, Manufacturing, Aerospace
- Tools/workflows: Transform technical descriptions into standardized patent figures; produce P&ID-style schematics with conventional symbols
- Assumptions/dependencies: Domain-specific symbol libraries; strict adherence to patent office formatting; legal review for accuracy
- Integration into autonomous AI scientist pipelines
- Sectors: Scientific research, Pharma/Biotech discovery
- Tools/workflows: End-to-end automated paper drafting modules producing publication-ready figures and plots with provenance logs
- Assumptions/dependencies: Mature end-to-end agent stacks; governance and authorship policies for AI-generated content; human validation checkpoints
- Automated figure compliance tools in journal submission systems
- Sectors: Academic publishing
- Tools/workflows: On-upload checks for font sizes, color palettes, legibility; suggestions or auto-fixes; metadata extraction for alt text and captions
- Assumptions/dependencies: Publisher buy-in; standardized style guides; API integrations with submission platforms
- Privacy-preserving, on-premises deployments
- Sectors: Finance, Healthcare, Government
- Tools/workflows: Containerized PaperBanana-like services using local VLMs/vision models; secure retrieval over air-gapped docs
- Assumptions/dependencies: High-quality on-prem models; MLOps for updates; compliance audits
- Interactive and accessible diagrams (responsive/AR/VR)
- Sectors: Education, Training simulations, Public outreach
- Tools/workflows: Multi-layer interactive diagrams with drill-down; automatic generation of alt text and semantic annotations
- Assumptions/dependencies: Standards for accessible graphics (ARIA, WCAG); tooling for interactive exports (HTML/SVG/Canvas/WebGL)
- Robust reconstruction pipelines for editability
- Sectors: Academia, Enterprise documentation
- Tools/workflows: OCR + segmentation + slide reconstruction (e.g., Python-PPTX) for converting raster outputs into editable slides or vector art
- Assumptions/dependencies: Improved element extraction models; tolerance for reconstruction artifacts; editorial QA
Notes on cross-cutting assumptions and dependencies:
- Model access and capability: Effectiveness depends on VLMs’ reasoning/perception and image models’ instruction-following and text rendering. Performance may vary across providers and updates.
- Legal and ethical use: Use of reference figures and automated generation must respect copyright, licensing, and fair-use policies; human oversight is essential to mitigate “visual hallucinations.”
- Format constraints: Current outputs are raster by default; vector workflows require reconstruction or future vector-native agents.
- Evaluation reliability: VLM-as-a-Judge correlates with human assessments but remains imperfect; critical use cases require human review.
- Compute and cost: Iterative refinement loops (e.g., T=3) add latency and cost; batching and caching strategies may be necessary for scale.
- Domain adaptation: Specialty areas (e.g., clinical diagrams, P&IDs, patent formats) need domain-specific icons, symbols, and style guides to ensure compliance.
Glossary
- Aesthetic Guideline: An automatically synthesized set of design rules that standardize academic visual style across color, layout, and typography. "the Stylist traverses the entire reference collection R to automatically synthesize an Aesthetic Guideline G covering key dimensions such as color palette, shapes and containers, lines and arrows, layout and composition, and typography and icons"
- Agentic framework: A system composed of collaborating AI agents orchestrated to perform complex tasks autonomously. "we introduce PaperBanana, an agentic framework for automated generation of publication-ready academic illustrations."
- Closed-loop refinement mechanism: A feedback cycle where outputs are repeatedly critiqued and improved based on evaluation against goals. "The Critic Agent forms a closed-loop refinement mechanism with the Visualizer by closely examining the generated image It and providing refined description Pt+1"
- Code-based paradigm: An approach that programmatically generates diagrams or plots using code rather than direct image synthesis. "Prior endeavors for diagram generation have predominantly adopted the code-based paradigm, leveraging TikZ, Python-PPTX, or SVG to programmatically synthesize diagrams."
- Communicative intent: The explicit goal and focus a figure should convey, used to guide visual generation. "let C denote the communicative intent that specifies the scope and focus of the desired illustration."
- Conciseness: The property of presenting only essential information without clutter. "Conciseness requires focusing on core information without visual clutter."
- Critic Agent: An agent that evaluates generated visuals against the source and intent, then produces targeted refinements. "The Critic Agent forms a closed-loop refinement mechanism with the Visualizer"
- Faithfulness: The degree to which a generated figure accurately reflects the source content and intended message. "Faithfulness ensures alignment with the source context (methodology description) and communicative intent (caption)"
- Few-shot: A prompting setup that provides a small number of examples to guide a model’s behavior. "Few-shot, building upon the vanilla baseline by augmenting the prompt with 10 few-shot examples"
- Generate-and-select workflow: A paradigm that produces multiple candidates and then chooses the best according to preferences or criteria. "This paradigm shifts the focus from single-shot generation to a generate-and-select workflow"
- Generative retrieval: A selection method where a generative model reasons over candidate metadata to pick references. "we adopt a generative retrieval approach where the VLM performs selection over candidate metadata"
- GUI Agent: An autonomous agent that operates graphical user interface software to create or edit visuals. "a GUI Agent capable of autonomously operating professional vector design software"
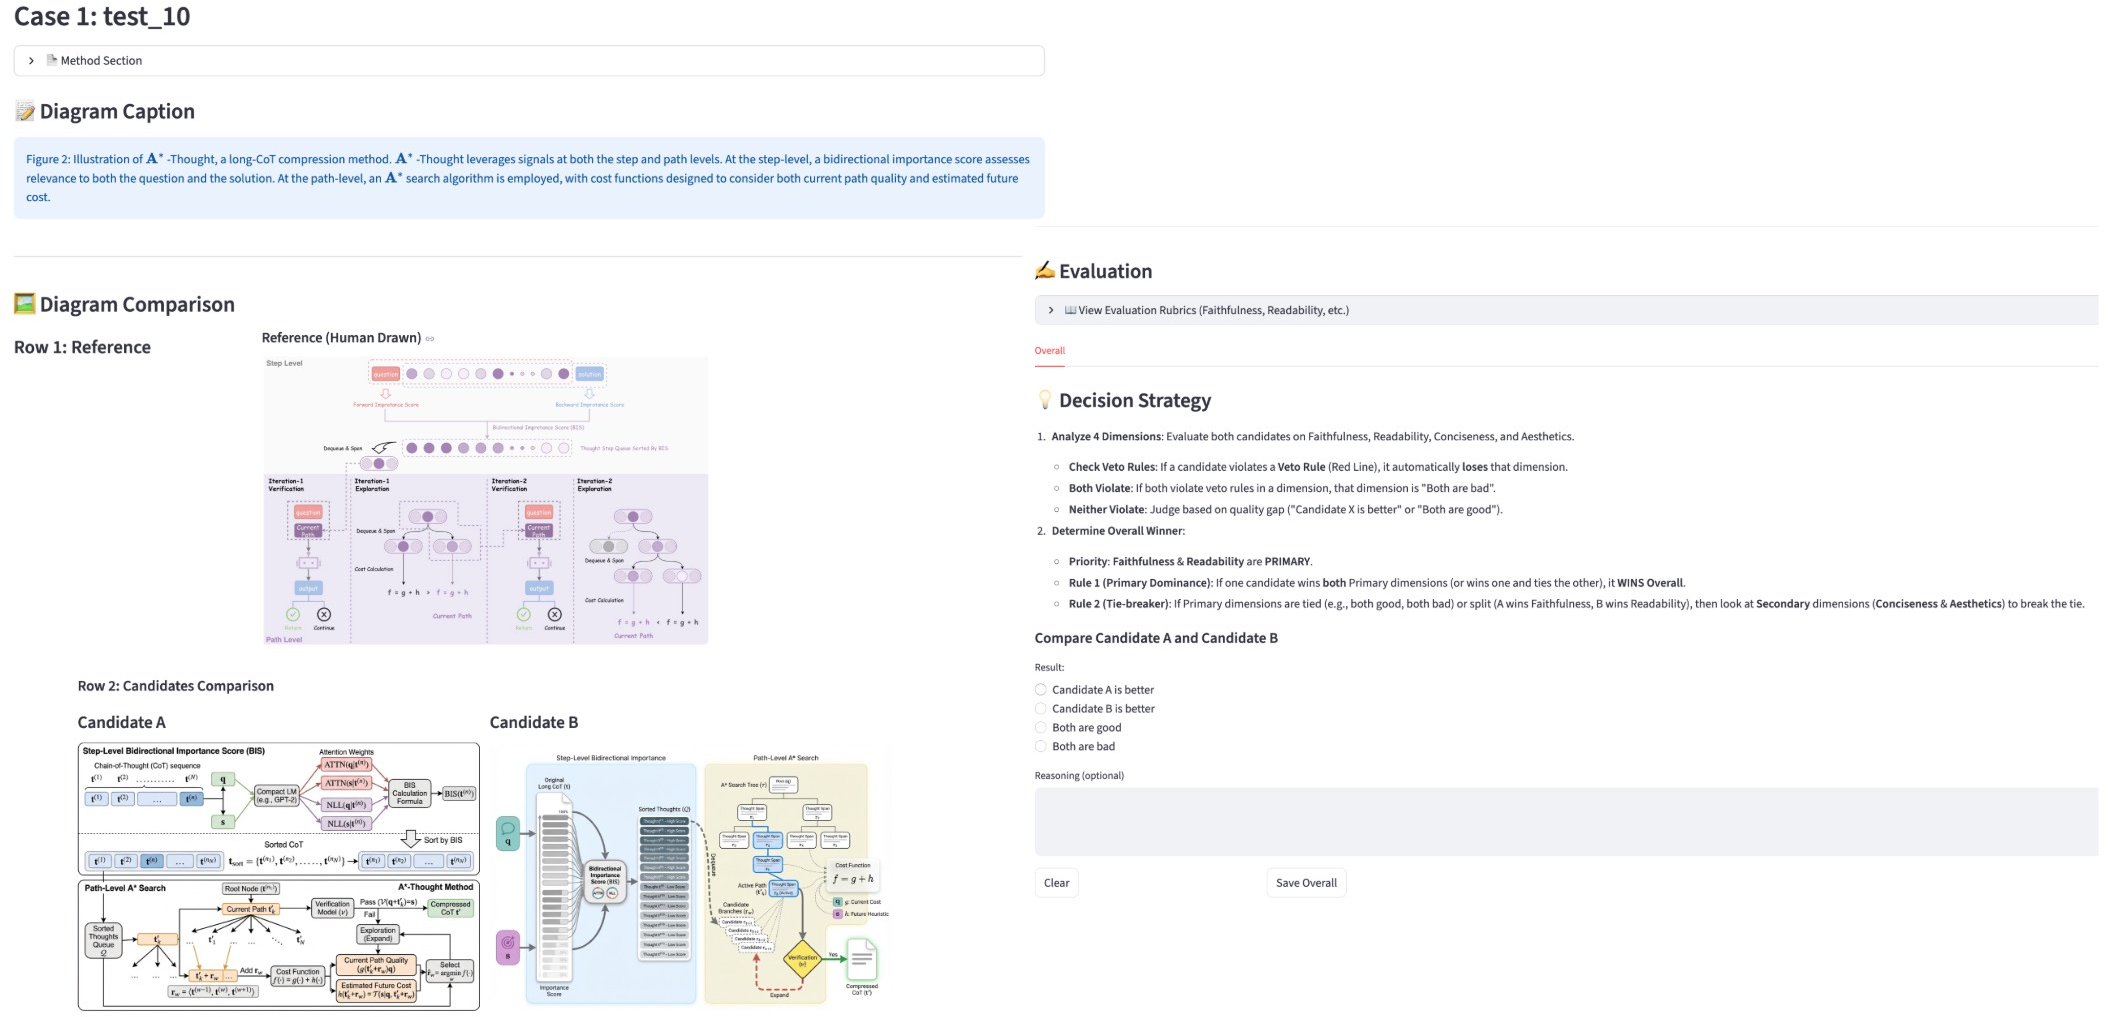
- Hierarchical aggregation strategy: An evaluation scheme that prioritizes primary criteria and uses secondary ones to break ties. "We employ a hierarchical aggregation strategy, designating faithfulness and readability as primary dimensions, and conciseness and aesthetics as secondary."
- In-context learning: A model’s ability to learn task behavior from examples provided within the prompt. "By performing in-context learning from the demonstrations in E"
- Iterative Refinement Loop: A multi-round process where visuals are generated and improved through repeated critique. "Iterative Refinement Loop (consisting of Visualizer and Critic Agents) to transform the description into visual output and conduct multi-round refinements"
- Kendall's tau correlation: A nonparametric statistic measuring rank correlation between two judgments. "Kendall's tau correlations with Gemini-3-Flash across the four dimensions (Faithfulness, Conciseness, Readability, Aesthetic) and their aggregation are 0.51, 0.60, 0.45, 0.56, and 0.55"
- Matplotlib: A Python plotting library used to produce programmatic, precise statistical visualizations. "the Visualizer converts the description Pt into executable Python Matplotlib code"
- Methodology diagrams: Figures that visually summarize a method’s components and logical flow in a paper. "generating methodology diagrams represents a significant challenge"
- Numerical hallucinations: Incorrect or fabricated numeric elements produced by generative models in dense plots. "exhibiting numerical hallucinations or element repetition"
- OCR: Optical Character Recognition, used to extract text from images for reconstruction or editing. "employing OCR for text extraction and SAM3 for pattern segmentation"
- Python-PPTX: A Python library to programmatically create and modify PowerPoint slides and figures. "leveraging TikZ, Python-PPTX, or SVG to programmatically synthesize diagrams."
- Raster images: Pixel-based images that are hard to edit and scale compared to vectors. "raster images are inherently difficult to edit."
- Readability: The clarity and legibility of a figure’s layout, text, and connections. "Readability demands intelligible layouts, legible text, no excessive crossing lines, etc."
- Reference-based scoring: An evaluation method that compares a generated figure against a human reference. "perform reference-based scoring on the same 50 samples using the same rubrics"
- Reference-driven collaborative workflow: A pipeline that uses retrieved examples to guide planning, styling, and rendering. "This reference-driven collaborative workflow allows the system to effectively master the logical composition and stylistic norms"
- Retrieval-augmented in-context learning: Using retrieved examples to enrich prompts and improve model performance via contextual demonstrations. "a reference set (N=292) to facilitate retrieval-augmented in-context learning."
- Reward models: Learned preference models that score outputs to better align generation with human aesthetics or goals. "training customized reward models to bridge this alignment gap represents a crucial direction"
- SAM3: A segmentation model used to isolate visual elements during reconstruction of diagrams. "SAM3 for pattern segmentation"
- Semantic retriever: A component that selects reference examples based on meaning rather than random choice. "We compare the semantic retriever with random and no-retriever baselines"
- Self-critique: A process where a system evaluates its own outputs and refines them. "iteratively refine via self-critique."
- Self-reflection: An agentic mechanism where models analyze their own reasoning or outputs to improve performance. "leveraging fundamental mechanisms such as test-time scaling and self-reflection."
- Stylistically optimized version: A refined textual description tailored to conform to academic aesthetic guidelines. "refines each initial description P into a stylistically optimized version P*"
- SVG: Scalable Vector Graphics, a vector image format often used for programmatic diagram generation. "leveraging TikZ, Python-PPTX, or SVG to programmatically synthesize diagrams."
- Test-time scaling: Improving performance by increasing compute or iterative steps during generation and evaluation. "leveraging fundamental mechanisms such as test-time scaling and self-reflection."
- TikZ: A LaTeX drawing package for precise, programmatic diagram creation. "leveraging TikZ, Python-PPTX, or SVG to programmatically synthesize diagrams."
- Vega-Lite: A high-level grammar for declarative chart specifications. "convert JSON data into Vega-Lite visualizations"
- Vector graphics: Resolution-independent graphics that preserve detail and are preferred for academic figures. "Unlike vector graphics---which are preferred in academic contexts for their infinite scalability and precise detail preservation---raster images are inherently difficult to edit."
- Vision-LLM (VLM): A model that jointly processes images and text for multimodal reasoning and generation. "To leverage the reasoning capabilities of VLMs, we adopt a generative retrieval approach"
- VLM-as-a-Judge: Using a vision-LLM to evaluate generated visuals against criteria or references. "We utilize VLM-as-a-Judge to assess the quality of methodology diagrams and statistical plots."
- Visualizer-Critic loop: The iterative cycle between a generator and a critic to refine visual outputs. "The Visualizer-Critic loop iterates for T=3 rounds, with the final output being I = IT."
- Zero-shot generation: Producing outputs without any example demonstrations provided in the prompt. "E defaults to ∅ when no examples are used (i.e., zero-shot generation)."
Collections
Sign up for free to add this paper to one or more collections.