Memory Scarcity, Open Models, and the Restructuring of the AI Industry, 2026-2030 -- A quantitative scenario analysis of inference economics, training-cost divergence, and infrastructure solvency
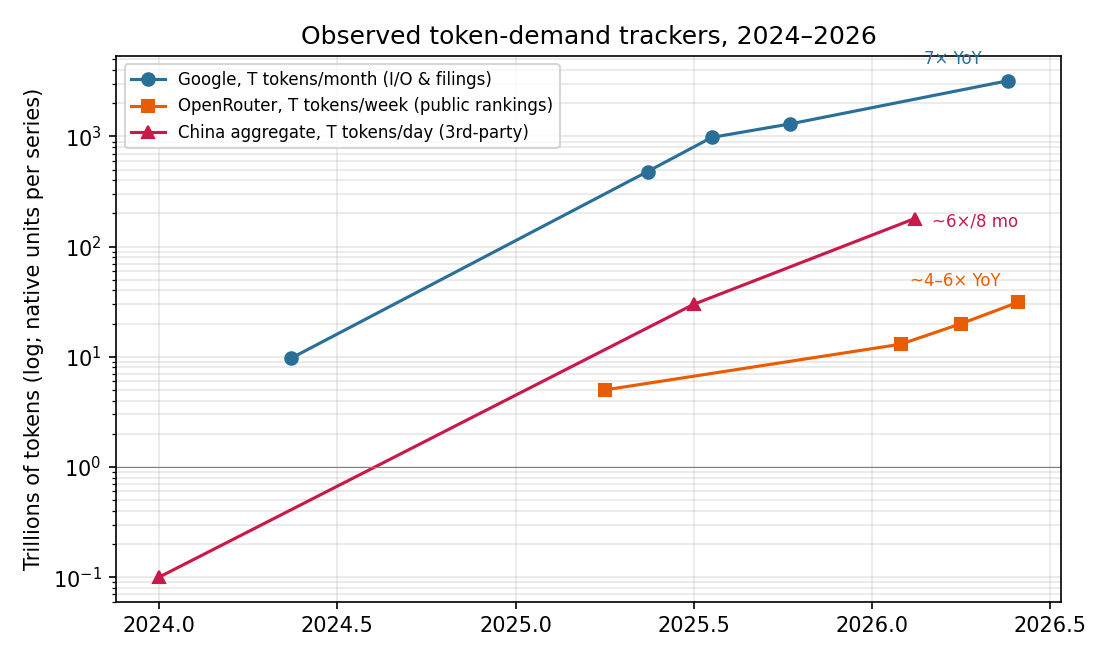
Abstract: We analyze how four forces restructure the AI industry over 2026-2030: the DRAM/HBM price surge, frontier-capable open-weight models (GLM-5.2), rapid inference-efficiency gains (near-Shannon-limit KV-cache compression, lightweight local runtimes), and the entry of Meta and xAI into compute resale on fleets bought before the memory repricing. Formulating inference economics in dollars per petabyte of bandwidth delivered (\$/PB) -- model-agnostic for bandwidth-bound decode -- we show the entrant-incumbent cost gap never closes: a depreciation conveyor delivers newly amortized fleets to incumbents faster than hardware prices normalize (3.2x in 2026, 1.9x in 2027, re-widening to 3-4x by 2029-30). Training bifurcates into a luxury tier (\$18-38B per frontier run by 2030) and a mass tier (previous-frontier parity via RL/distillation falling toward \$5M). Solvency of the announced buildout is confined to a corridor requiring roughly 2x annual token-demand growth for four years with sticky premium pricing; a measurement critique shows public token trackers overstate monetizable demand, and all pre-Q2-2026 projections predate the industry's shift from token maximization to token minimization. A vintage-breakeven analysis finds 2026 and 2028-29 capacity each fatally exposed to one pricing regime, with only the 2027 vintage robust. A greenfield custom-silicon entrant removes the merchant margin but not the memory premium (central outcome: 25% success/34% mediocre/41% loss, improvable via staged go/no-go gates). China's LineShine LX2 -- domestic HBM on a standard ISA -- decouples its cost curve from the memory crisis. Scenario probabilities: Rotating Landlord Oligopoly 25%, Commoditization Crash 25%, Jevons Absorption 20%, System-Layer Re-differentiation 18%, Geopolitical Bifurcation 12%. Solvency now depends on monetized bandwidth demand, premium stickiness, and vintage ownership.
Paper Prompts
Sign up for free to create and run prompts on this paper using GPT-5.
Top Community Prompts
Explain it Like I'm 14
What this paper is about
This paper looks at how the AI industry might change from 2026 to 2030. It says four big forces are pushing the change all at once:
- Memory chips (like DRAM and HBM) got much more expensive.
- Powerful open-source AI models (like GLM-5.2) have caught up for many everyday uses.
- Running AI is getting much more efficient thanks to smarter software tricks.
- Big companies that bought lots of AI hardware early (like Meta and xAI) are now renting out that hardware to others.
The paper asks: who will win or lose money, which hardware will be worth it, and what demand is needed so all this new AI infrastructure doesn’t go broke?
The big questions
In simple terms, the paper tries to answer:
- How do we correctly measure the real cost of running AI models?
- Why do companies that already own AI hardware have a built‑in cost advantage over newcomers?
- How fast does AI usage (demand) need to grow so that new data centers can pay for themselves?
- Will super‑expensive “frontier” AI models stay worth the price, or will cheaper open models be good enough for most jobs?
- What are the most likely futures for the AI market between 2026 and 2030?
How the study works (in everyday language)
Think of running AI like moving water through pipes:
- The “water” is data flowing from memory to the AI chips as models generate tokens (tokens are like words or pieces of words).
- The “pipe size” is memory bandwidth (how fast memory can be read).
- The paper measures cost as dollars per petabyte moved, written as /PB? Because when AI models “talk” (generate tokens), the limiting factor is usually how fast they can stream data from memory. So comparing hardware by/PB and fleet utilization. Then it tests how different growth and efficiency rates change which companies survive.
Main findings and why they matter
Here are the core results, kept short and clear:
- Incumbents have a lasting cost edge
- Newcomers buying new hardware in 2026 pay about 3.2× more per unit of bandwidth than incumbents using paid‑off fleets; the gap narrows in 2027 (≈1.9×) then widens again to ~3–4× by 2029–2030.
- Translation: if you already own older gear, you can sell AI services cheaper and still profit. Newcomers struggle to catch up.
- Training splits into “luxury” vs “mass market”
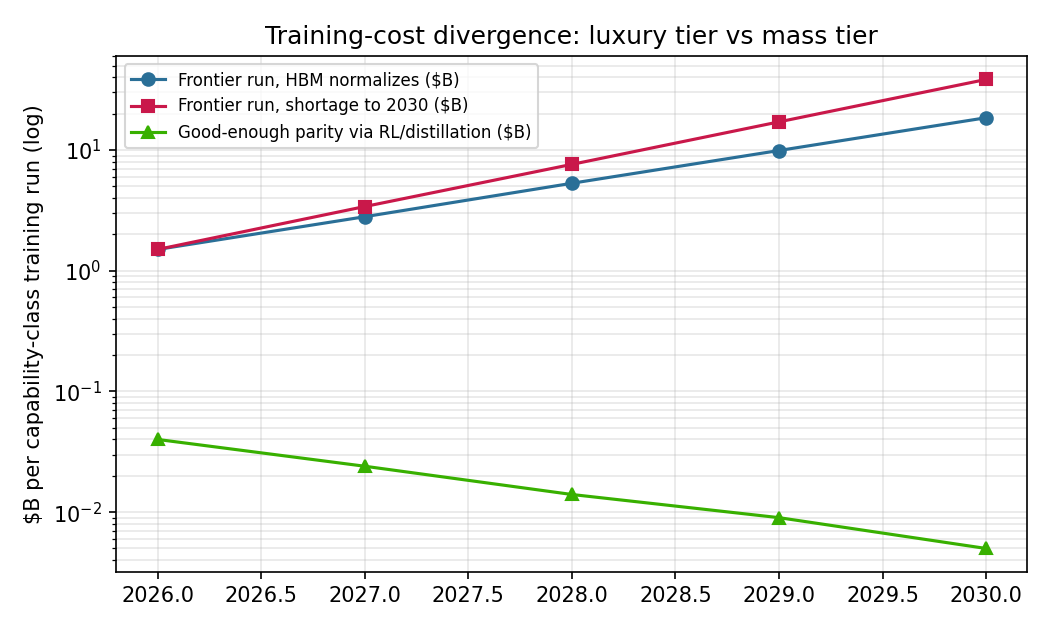
- Training the very best frontier model could cost $18–38 billion by 2030.
- Reaching “good enough” performance using open models plus clever training can drop toward ~$5 million.
- That’s a gap of thousands of times. So frontier models become like luxury cars—worth it for tough, high‑stakes jobs—while most everyday work goes to cheap, open models.
- Only certain purchase years make financial sense
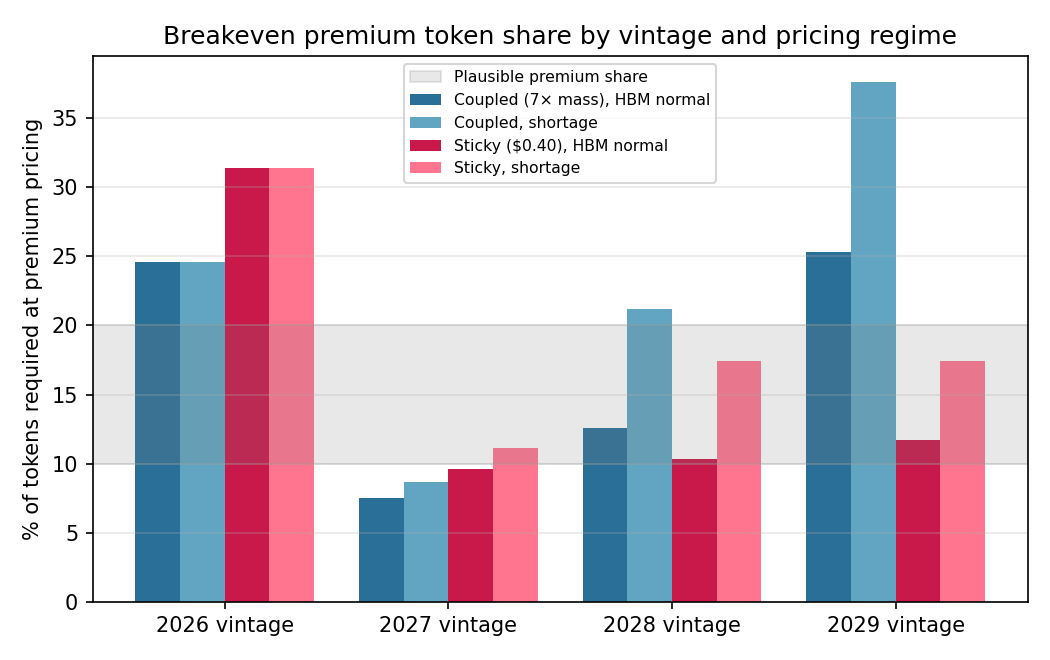
- The “best” year to buy turns out to be 2027. Peak‑price gear bought in 2026 or 2028–2029 is risky, depending on pricing:
- If premium prices stay sticky, 2026 buyers are most exposed.
- If prices get dragged down (coupled), 2028–2029 buyers are most exposed.
- The solvency corridor needs strong demand
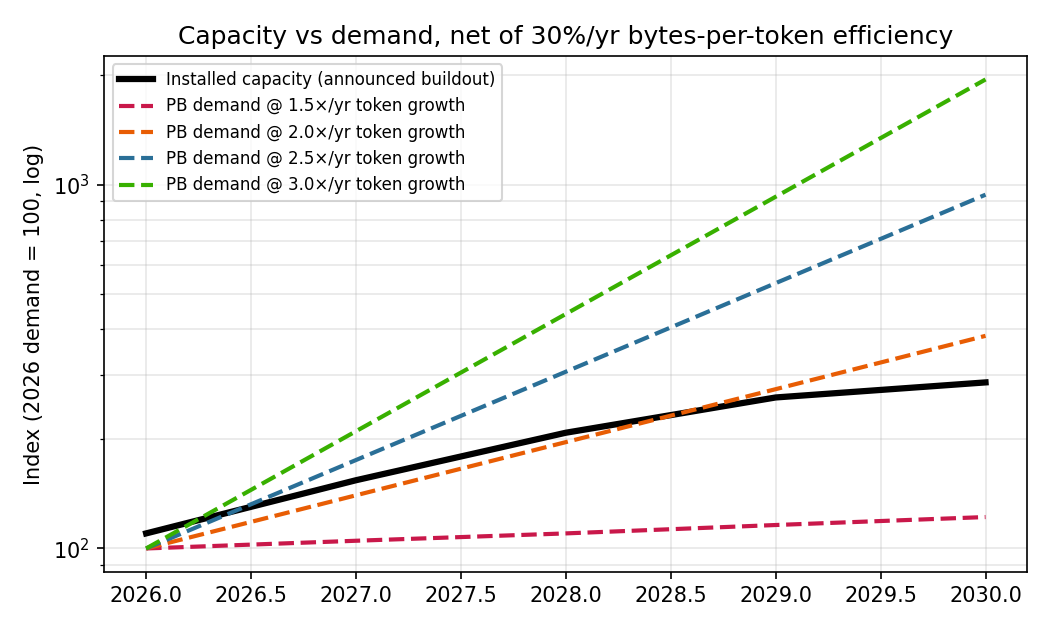
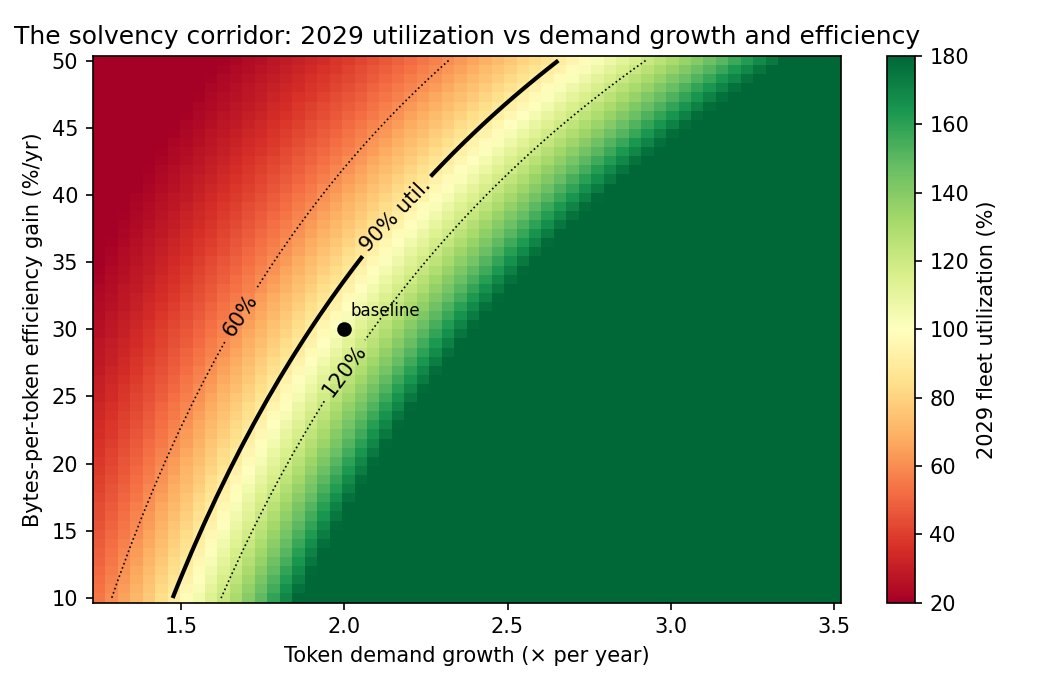
- For all the new data centers to pay off, token demand likely needs to about double every year for four years (≈2×/yr), after subtracting the gains from efficiency.
- If efficiency gains slow (say from 30%/yr to 15%/yr), the demand needed falls (to ~1.6×/yr), making survival easier.
- If efficiency speeds up, survival gets harder.
- Open models and local/private use shift demand
- Cheaper open models plus “routers” that send requests to the cheapest good model move lots of traffic away from expensive closed models.
- Many companies will run AI on their own hardware for privacy and cost, which doesn’t help cloud providers pay for their big builds.
- Science and industrial R&D provide a floor
- AI for science and industrial innovation (AI4SIS)—like drug discovery or materials design—has mission funding. It is less likely to be cut and can keep hardware busy when enterprise budgets tighten.
- Custom chips help but don’t erase memory costs
- A brand‑new player with its own chip in a new data center still faces the same pricey memory. The paper’s central estimate of outcomes for such an entrant: 25% success, 34% so‑so, 41% loss—improvable with staged decisions.
- What to watch
- The single most important live metric: token‑demand growth after subtracting efficiency gains, measured in dollars as well as tokens. In short: how many paid bytes are actually flowing, and at what price?
The possible futures (with simple labels)
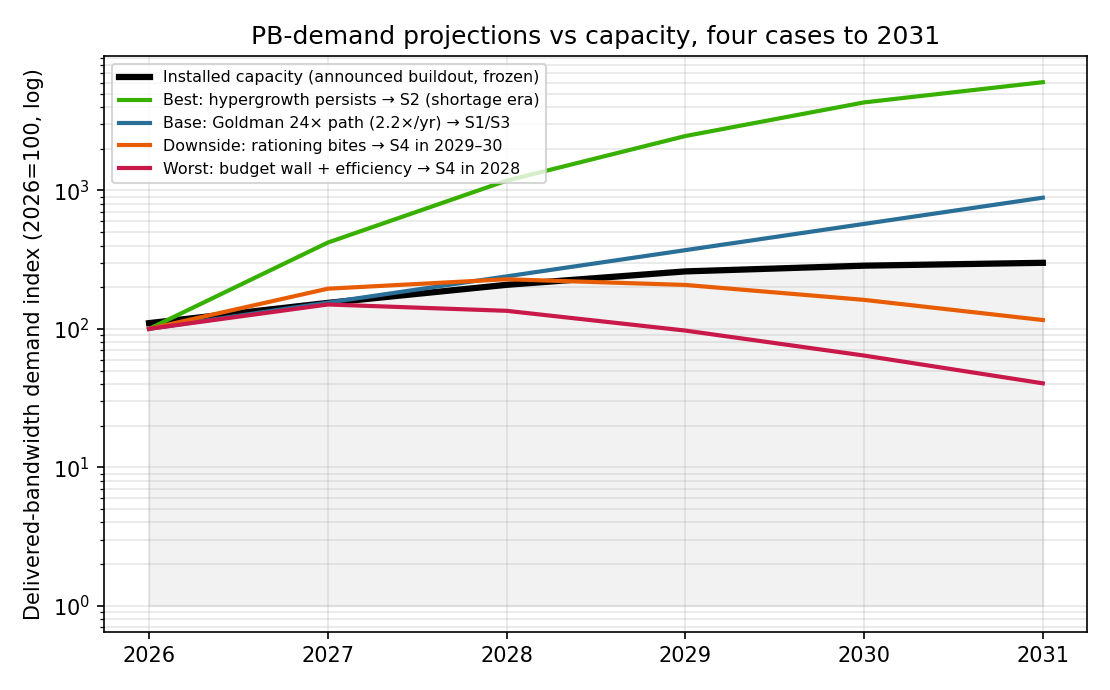
Below is a short, plain‑English list of the five scenarios the paper analyzes, with the author’s probability estimates:
- Rotating Landlord Oligopoly (25%)
- Big incumbents who own paid‑off fleets set floor prices. Newcomers can’t match them. Renting compute grows. Power rotates among incumbents as hardware ages into cheap mode.
- Jevons Absorption (20%)
- Demand explodes fast enough that everyone stays busy and solvent. Scarcity continues. Premium remains premium. Science/industry workloads help keep growth high.
- System‑Layer Re‑differentiation (18%)
- Model weights become commodities. Value shifts to orchestration (smart routing), special training environments, user data, and trust. Closed labs remain the “escalation tier” for the hardest cases.
- Commoditization Crash (25%)
- Demand growth slows and/or premium prices get pulled down. Cheap open models plus local use hollow out cloud revenue. Peak‑price fleets get impaired. A major player needs a bailout or merges. Classic boom‑bust.
- Geopolitical Bifurcation (12%)
- Tight export controls split the world. The West leans on closed labs; the rest standardizes on open models with domestic hardware. Sovereign (government‑owned) capacity becomes strategically valuable.
A few tricky terms, made simple
- Memory bandwidth: Like the width of a highway for data. Wider = more data per second.
- Bandwidth‑bound decode: When a model writes tokens, the slow part is often reading from memory, not doing math. So memory speed matters most.
- KV‑cache compression near the Shannon limit: A fancy way of saying we’re almost as efficient as physics allows at shrinking certain data needed during generation.
- Sticky vs coupled pricing: Sticky means premium prices stay high; coupled means premium prices get dragged down as cheap options improve.
- Incumbent floor: The lowest price incumbents can profitably offer using their paid‑off gear—hard for new entrants to beat for years.
- Tokens: Pieces of text or content used by AI, similar to words.
Why this matters
- For companies building AI: Owning memory‑heavy hardware early gives you a durable cost edge. If you buy at the wrong time, you can be stuck with gear that’s too expensive to pay off unless demand stays very strong.
- For developers and users: Open models are getting good enough for most work, and smart routing makes your requests cheaper by default. Frontier models still matter for long, complex, high‑stakes tasks.
- For investors: The industry has moved from “growth will fix everything” to a narrow corridor where both demand growth and pricing must line up. Crash risk is not a tail—it's co‑equal with the steady‑state outcome.
- For governments: Sovereign and mission‑funded compute can keep national science and industry moving even if commercial demand stumbles, and it can shape the global balance if markets split.
Final takeaway
The AI boom is now constrained by memory and economics, not just by model breakthroughs. The winners are those who:
- Own the right vintage of memory‑rich hardware,
- Keep premium prices from collapsing (or avoid depending on them),
- And ride real, paid demand that grows faster than efficiency shrinks the bytes per task.
If you want one dashboard metric, watch realized token‑demand growth net of efficiency—measured in dollars per petabyte moved. That number will tell you whether the industry is safely in the solvency corridor, perched on its edge, or slipping toward a shakeout.
- Incumbents have a lasting cost edge
Knowledge Gaps
Knowledge gaps, limitations, and open questions
Below is a single, concrete list of what remains uncertain or underexplored in the paper, framed so future researchers can operationalize them.
- Data/measurement: Lack of a post–Q2 2026, multi-quarter time series to establish the “token minimization” regime slope; need standardized, weekly-to-monthly measures of tokens-per-task, dollars-per-task, and realized dollars per petabyte moved across major providers and segments.
- Data/measurement: No public, reproducible procedure for quality-adjusting token growth (e.g., subtracting operator-injected tokens, subsidized volume, and redundant agentic context); requires an auditable decomposition of reported tokens into willingness-to-pay and zero-/negative-margin components.
- Data/measurement: Absent conversion baselines from petabytes moved to tokens served by workload class; requires empirical bytes-per-token distributions by model size, precision, context length, KV policy, and prefill/decode mix.
- Model calibration: Memory-bandwidth utilization (MBU) parameters () are assumed (0.50–0.62) without fleet-trace validation; need per-workload MBU estimates with confidence intervals and how MBU degrades with MoE expert count and interconnect topology.
- Model calibration: Electricity price ( = $0.08$/kWh), PUE (1.3), and ops cost ($\$0.25/\text{GPU-hr}\$0.030.20/PB framework isolates decode-phase bandwidth but does not integrate prefill/computation-bound phases; need a hybrid model that endogenizes prefill/decode ratios and latency constraints for long-context and multimodal use. - Model structure: The slot-replacement condition uses an exogenous token price ; the feedback loop where fleet composition, routing, and entrant/incumbent pricing co-determine is not modeled (risk of circularity). - Model structure: Four-year straight-line depreciation and a fixed 1.5× system multiplier ignore WACC heterogeneity and financing conditions; need a capital-cost–explicit breakeven model with interest-rate sensitivity and lease vs own differences. - Mapping/MT: No canonical mapping from petabytes to dollars-per-million-tokens across contexts; requires standardized bytes-per-token and model-/context-specific conversion factors to relate Figure 1–6 economics to observed price menus. - Training-cost divergence: Frontier training cost trajectories ($\$1838\sim\$5\$0.40/\text{PB}$ and the “coupled” case at a 7× multiple without microfoundations; need an elasticity- and switching-cost–based model estimating when routing succeeds in coupling prices. - Premium share: The assumed 10–20% premium token share is not empirically grounded by vertical or use case; requires measurement of premium-share distributions across industries, compliance tiers, and geography, and how they evolve under token minimization. - Incumbent floor: Heterogeneity among “legacy” fleets (e.g., H100 context limits, interconnect topologies, memory capacity) may preclude some workloads; need workload-level market share projections that quantify how much demand remains serveable by capacity-poor fleets after compression. - Capacity–bandwidth trade-off: The paper posits a cutoff (~100–200 GB residency) but does not quantify how compression advances shift this frontier; requires longitudinal benchmarks of compression stacks (weights/KV/offload) and their effect on residency and MBU on legacy vs new silicon. - Efficiency frontier: Claim that KV compression is near the Shannon limit (TurboQuant) is qualitative; need headroom estimates for new levers (speculative decoding, radical sparsity, structured state, on-device offload) and their impact on the 15–45%/yr efficiency range. - Local inference adoption: The rate and S-curve timing by which on-prem/private inference cannibalizes metered demand is asserted but not modeled; requires empirical studies of enterprise deployments (by firm size/sector/region), router logs, and on-prem procurement to parameterize reallocation. - Router/platform economics: How infrastructure take rates and routing policies evolve (e.g., preferentially steering to in-house or contracted capacity) is not quantified; need measurements of platform margin capture over time and scenarios where model-provider margins can rebound. - Sovereign/institutional demand: AI4SIS is identified as an inelastic floor but not sized; requires bottom-up estimates (DOE, national labs, defense, industrial R&D) and expected utilization profiles to integrate into the solvency corridor. - HBM supply trajectory: Scenario split (normalize 2028 vs persist to 2030) lacks probabilistic priors tied to foundry ramps, yields, and vendor capex; need a supply-side model of DRAM/HBM capacity, vendor allocation strategies, learning curves, and policy interventions. - Alternative memory/arch: Cost models exclude CXL pooling, high-capacity HBM4e, NDP/CIM, wafer-scale, or matrix-enhanced CPUs at scale; need quantitative comparisons of these pathways on\beta%%%%10%%%%\beta/PB by segment and rerunning corridor thresholds under revenue-weighted prices.
- Replacement economics: The crossover price ($\sim\$0.11/\text{PB}p$ declines faster than expected, testing whether incumbents still refresh “on schedule.”
- Entry strategies: The greenfield entrant outcome distribution (25/34/41) is presented without data-generating process; requires transparent inputs (silicon cost curve, yield risk, ramp delays, sales pipeline) and historical analogs for validation.
- Legal/IP risk: The feasibility of relying on open-weight + distillation for “previous frontier” capability ignores potential licensing/IP limits; requires legal risk analysis and how it could constrain open-model availability or corporate adoption.
- Safety/compliance: Whether “agentic reliability” maintains premium price stickiness is hypothesized; need longitudinal evidence on failure rates, audit/compliance costs, and the price premium enterprises actually pay for reliability over time.
- Utilization realism: The corridor uses a 90% utilization solvency cut; need validation against observed, SLO-constrained utilization and burstiness, including multi-tenant isolation and redundancy overheads that lower effective utilization.
- Demand elasticity: No explicit modeling of token-price elasticity by segment (developer, enterprise, consumer, agentic); need estimates to predict revenue outcomes under aggressive routing and local inference substitution.
- Router switching costs: The speed and friction of supplier switching (closed→open, US→CN weights) are asserted low; need empirical measures (migration times, engineering costs, quality penalties) to parameterize coupling risk.
- Environmental/externalities: Carbon pricing or energy policy-induced costs are excluded; need scenarios where carbon costs or data-center moratoria alter the slot economics and solvency corridor.
- Security/sovereignty: The degree to which privacy/sovereignty pushes non-US enterprises directly to on-prem open-weight deployments is anecdotal; need survey-based adoption studies and procurement data to quantify this bypass of metered demand.
- Metrics standardization: Divergent token accounting across vendors (input vs output, multimodal units, compression effects) compromises comparability; need an open standard for “effective tokens” and “effective PB moved” to normalize datasets used in corridor tracking.
Practical Applications
Immediate Applications
The following items translate the paper’s findings into concrete, deployable actions across sectors. Each item names sectors, suggests tools/products/workflows, and notes assumptions or dependencies that affect feasibility.
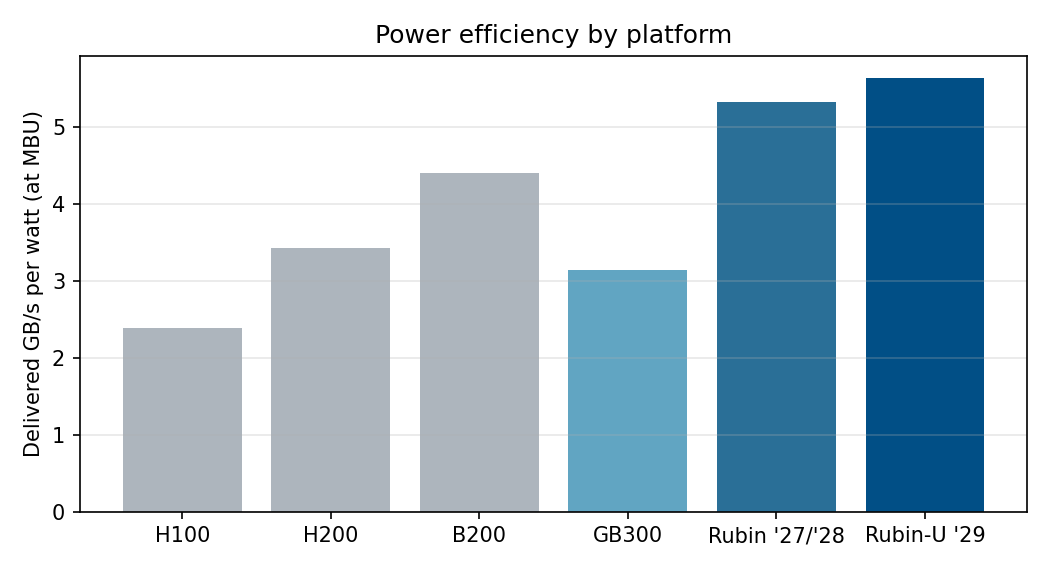
- Industry—Cloud/Neocloud/Infra: Adopt dollars-per-petabyte (/PB delivered (using Eq. (1) in the paper) for decode-bound workloads; publish/PB-denominated reserved instances; utilization-aware$/PB reporting.</li> <li>Assumptions/dependencies: Workloads are bandwidth-bound in decode; utilization must be measured and optimized (prefill/decode mix, batchability, KV residency).</li> </ul></li> <li>Industry—Datacenters/Cloud: Power-slot-aware refresh policy using the margin-per-watt condition <ul> <li>What to do: Use the replacement inequality βnew·(p − cnew<sup>full)</sup> > βleg·(p − cleg<sup>marg)</sup> to schedule retirements of H100-class gear for Rubin-class gear where market price p ≳ $0.11/PB.
- Tools/products/workflows: Per-cluster “margin per watt” dashboards; automated refresh triggers tied to market prices and utilization.
- Assumptions/dependencies: Sites are power-constrained; market prices for bandwidth remain above the new-build full-cost floor.
- What to do: Avoid peak-price 2026 vintages where possible; bias new purchases/leasing toward 2027; structure options to defer 2028–2029 deliveries unless premium-price stickiness is contractually secured.
- Tools/products/workflows: Vintage breakeven calculators; optioned purchase agreements; lease-versus-build models.
- Assumptions/dependencies: Pricing regime uncertainty (sticky vs coupled); HBM branch (shortage vs normalization).
- What to do: Keep frontier closed models priced on sticky absolute dollars for regulated/high-reliability use; serve mass demand with open-weight models and aggressive routing.
- Tools/products/workflows: Router-plus-escalation architectures (e.g., Bedrock Intelligent Prompt Routing, Vertex, Foundry) that default to open models and escalate to premium only when needed.
- Assumptions/dependencies: Premium-price stickiness holds via contracts, compliance, and reliability; routing gains continue cutting mass-tier cost.
- What to do: Institutionalize budget metering, context pruning, retrieval-first patterns, and right-sizing via routers to reduce tokens-per-task.
- Tools/products/workflows: Cost dashboards in /PB; prompt/context linting; per-service token budgets with automated throttles; cache/KV reuse.
- Assumptions/dependencies: Organizational willingness to govern usage; availability of routing and caching in serving stack.
- What to do: Stand up private inference using open models (e.g., GLM-5.2) with quantization and KV compression on workstation or rack-scale hardware.
- Tools/products/workflows: DGX Spark-class nodes; Mac mini clusters; runtimes such as DwarfStar 4; near-Shannon KV compression (TurboQuant); MLOps for model/adapter lifecycle.
- Assumptions/dependencies: Adequate in-house utilization to beat cloud floor; data-governance and compliance needs outweigh managed-service convenience.
- What to do: Systematically deploy low-bit weight quantization, near-optimal KV compression, expert offload, and routing to shrink residency and fit on depreciated capacity.
- Tools/products/workflows: Quantization-aware calibration; TurboQuant-like KV compression; expert paging; MoE-aware schedulers.
- Assumptions/dependencies: Quality floors acceptable after compression; workloads tolerate slightly higher latencies on legacy fleets.
- What to do: Track token-demand growth net of efficiency monthly; stress deals against 1.6–2.4× annual growth thresholds; add covenants that reprice risk if growth falls below corridor.
- Tools/products/workflows: Corridor trackers in both tokens and dollars/PB; utilization/price sensitivity models; quarterly re-underwriting.
- Assumptions/dependencies: Post-Q2 2026 regime break persists; efficiency trend within 15–45%/yr range.
- What to do: Use the paper’s 25/34/41% success/mediocre/loss baseline to gate capital deployment; prioritize bandwidth-per-watt and memory I/O; avoid assuming merchant-margin removal solves the memory premium.
- Tools/products/workflows: Gate reviews synchronized to external corridor tracker; pilot deployments on small pods before fab commits; focus on HBM availability contracts.
- Assumptions/dependencies: HBM supply risk; ability to secure early customers without undercutting to entrant-loss levels.
- What to do: Fund and operate sovereign fleets to serve AI4SIS and sensitive enterprise workloads, insulating national demand from CLOUD Act exposure and market rationing.
- Tools/products/workflows: National-lab operated inference utilities; open-weight compliance frameworks; inter-agency compute allocation.
- Assumptions/dependencies: Budget availability; domestic operations and data residency; open-weight model access.
- What to do: Advance autonomous science pipelines (hypothesis → simulation → robotic experiment) and industrial R&D to stabilize fleet utilization through demand air pockets.
- Tools/products/workflows: DOE-style programs; lab-to-fab simulation loops; validated agentic reliability protocols.
- Assumptions/dependencies: Programmatic funding; long-horizon project governance; sustained need for simulation-heavy workloads.
- What to do: Monetize routing, data privacy, compliance, and trust layers while sourcing mass tokens from open-weight models at the incumbent floor.
- Tools/products/workflows: Multi-vendor routers; quality-of-service guarantees; compliance attestations; enterprise connectors.
- Assumptions/dependencies: Continued spread between premium and mass model realizations; enterprise willingness to use neutral routers.
- What to do: Treat tokens as a metered utility; forecast, allocate, and reconcile usage in financial systems; renegotiate SaaS-style AI contracts with /PB; availability of incumbent surplus capacity.
Long-Term Applications
These opportunities require further research, scaling, or policy development before becoming mainstream.
- Academia/Industry—Architectures: Memory-centric, matrix-enhanced CPU designs with on-package HBM
- What to do: Pursue GPU-alternative paths (A64FX lineage; SME/SVE with HBM) for inference and HPC, reducing exposure to GPU/HBM pricing power.
- Tools/products/workflows: Prototype nodes; compiler/runtime co-design for bandwidth efficiency; mixed DDR/HBM hierarchies.
- Assumptions/dependencies: Domestic HBM availability; software ecosystem maturation; competitive perf/W vs GPUs.
- Finance/Cloud—Bandwidth futures and hedging instruments
- What to do: Create tradeable contracts indexed to delivered bandwidth (/PB futures; HBM price indices; utilization-linked revenue bonds.
- Assumptions/dependencies: Reliable benchmarks; counterparty participation; regulatory approval.
- Standards/Policy/Industry: $/PB-denominated SLAs and routing standards
- What to do: Standardize APIs for bandwidth-based SLAs and for router interoperability, enabling multi-provider orchestration and transparent cost/performance.
- Tools/products/workflows: Open benchmarks for decode-bound workloads; SLA conformance testing suites; router metadata schemas.
- Assumptions/dependencies: Industry consortium support; clear workload scope (decode-bound).
- Hardware/Systems: Disaggregated memory and CXL-based pools to relax the HBM premium
- What to do: Develop memory pooling and near-memory compute to reduce per-replica HBM requirements, especially for MoE serving.
- Tools/products/workflows: CXL memory fabrics; KV/weights tiering across HBM/DDR/NVMe; scheduler support.
- Assumptions/dependencies: Acceptable latency/MBU impacts; vendor interoperability.
- Policy—National Strategy: AI4SIS compute cooperatives and sovereign open-weight ecosystems
- What to do: Establish national compute co-ops serving SMEs, universities, and agencies with open weights and privacy guarantees.
- Tools/products/workflows: Shared governance models; cost-recovery pricing; public orchestration platforms.
- Assumptions/dependencies: Sustained funding; legal frameworks for data control and access.
- Telecom/Enterprise/Edge: Private inference fabrics and micro-datacenters
- What to do: Build campus/city-scale edge inference for low-latency, private workloads, leveraging open weights and local routing.
- Tools/products/workflows: On-prem inference gateways; QoS-aware routers; peering between enterprise sites.
- Assumptions/dependencies: Sufficient local workloads; operational expertise; security posture.
- Software/Platforms: System-layer re-differentiation—trust, orchestration, and data network effects
- What to do: Shift value capture from weights to orchestration, proprietary RL environments, interaction data, and compliance attestations.
- Tools/products/workflows: Enterprise-grade routers; verified data pipelines; auditability/reporting for regulated sectors.
- Assumptions/dependencies: Weight commoditization persists; enterprises value trust/compliance over raw capability.
- Policy/Geopolitics: Dual-stack readiness for export-control bifurcation
- What to do: Plan for Western closed stacks and Chinese open stacks to diverge; maintain interoperability at the data and orchestration layers within jurisdictions.
- Tools/products/workflows: Compliance filters; model provenance registries; cross-border data-transfer controls.
- Assumptions/dependencies: Policy trajectory (export controls on weights/bundles); corporate risk tolerance.
- Energy/Infra/Markets: Power-slot valuation and co-optimization markets
- What to do: Create markets that price datacenter power slots by their potential 5M, enabling rapid vertical-specific fine-tunes.
- Tools/products/workflows: Teacher–student frameworks; curriculum RL; quality/robustness auditing for safety-critical use.
- Assumptions/dependencies: Access to high-quality interaction data; open base model availability.
- Policy/Industrial Base: Memory supply-chain industrial policy
- What to do: Support domestic HBM/DRAM capacity (grants, tax credits, procurement) to reduce exposure to price spikes.
- Tools/products/workflows: Long-term offtake agreements; diversified vendor programs; strategic stockpiles.
- Assumptions/dependencies: Capital intensity; environmental and permitting timelines.
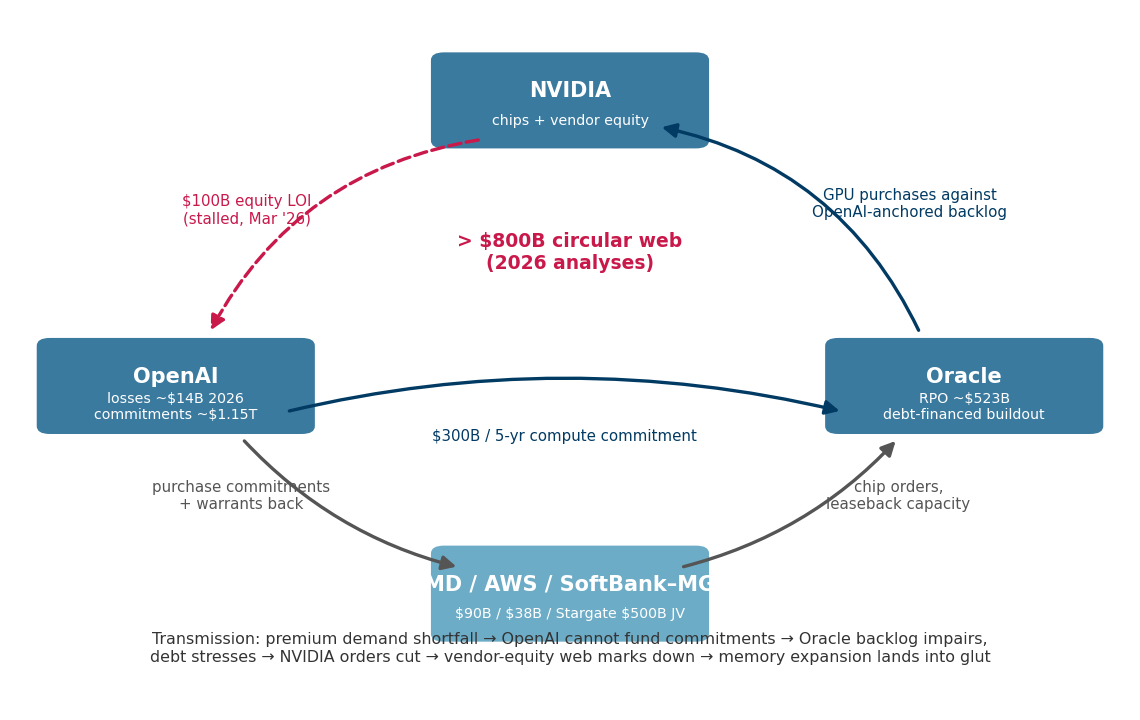
- Regulation/Disclosure: Compute-market transparency to reduce circular-finance fragility
- What to do: Require periodic disclosures of tokens, dollars/PB, utilization, and pricing regimes for public market participants financing AI capacity.
- Tools/products/workflows: Standardized reporting templates; third-party audits; scenario stress-testing disclosures.
- Assumptions/dependencies: Regulatory mandate; harmonized definitions across firms.
- Consumer Hardware/CE: Local inference appliances
- What to do: Develop consumer/professional desktops with unified memory and optimized runtimes for local assistants, coding, and media generation.
- Tools/products/workflows: Workstation SKUs with large RAM and fast NVMe; runtimes like DwarfStar-class; app-store ecosystems for local models.
- Assumptions/dependencies: Continued inference-efficiency gains; user acceptance of local model management; content safety features.
Cross-cutting assumptions and dependencies to monitor
- Efficiency trend: 30%/yr baseline in bytes-per-token; corridor widens if it decelerates to ~15%/yr and tightens if it accelerates to ~45%/yr.
- Pricing regime: Premium-price stickiness vs coupled pricing determines which vintages are impaired and the viability of luxury-tier strategies.
- HBM/DRAM branch: Memory-price normalization from 2028 vs shortage persisting through 2030 materially changes entrant economics and refresh pacing.
- Post-Q2 2026 regime break: Enterprise token minimization and on-prem reallocation may lower metered demand growth despite total inference growth.
- Policy shocks: Export controls on weights, CLOUD Act jurisdiction, and sovereignty requirements can shift demand between public cloud and sovereign/on-prem capacity.
Glossary
- AI for Science and Industrial Innovations (AI4SIS): Mission-funded scientific and industrial AI workloads that are comparatively inelastic and budget-insulated, often keeping fleets utilized during enterprise downturns; "AI for Science and Industrial Innovations (AI4SIS) demand --- mission-funded and rationing-proof --- is identified as the corridor's inelastic floor."
- base branch: The scenario where memory prices normalize, used to parameterize cost projections; "Purchase prices follow two HBM branches: a base branch in which memory prices normalize from 2028, and a shortage branch in which elevated pricing persists through 2030."
- bandwidth-bound decode: A serving regime where token throughput is limited by memory bandwidth rather than compute; "Decode-phase inference is bandwidth-bound: throughput is proportional to delivered HBM bandwidth regardless of model identity, because every generated token requires streaming the resident working set (active weights plus KV cache) from memory."
- bytes-per-token efficiency: A measure of how many bytes must be moved per output token, improved by compression, sparsity, and routing; "given the announced buildout and 30\%/yr bytes-per-token efficiency gains."
- circular-financing web: Interlinked investment and procurement relationships that can amplify systemic risk; "the Western circular-financing web as a coupled transmission mechanism for the crash scenario."
- CLOUD Act: U.S. law extending jurisdiction over data held by service providers, relevant to sovereignty considerations; "the CLOUD Act's jurisdictional reach as the reason sovereignty requires domestically owned and operated infrastructure rather than open weights alone."
- coupled pricing: A regime where premium-model prices decline in tandem with mass-tier prices due to routing competition; "under coupled pricing, routing arbitrage drags premium prices down in roughly fixed ratio to collapsing mass prices."
- delivered bandwidth per watt: Efficiency metric of usable memory bandwidth per unit power, central to replacement decisions in power-limited sites; "with delivered bandwidth per watt β = B·η/W."
- depreciation conveyor: The ongoing advantage incumbents obtain as older fleets finish amortization and run at marginal cost; "it establishes the depreciation-conveyor result: the cost gap between entrants and incumbents never closes within the horizon, because amortization continuously delivers newly cheap fleets to whoever bought last cycle's hardware."
- **dollars per petabyte (\$/PB)**: A model-agnostic unit for inference cost on bandwidth-bound decode; "The natural unit of inference cost is therefore dollars per petabyte moved (\$/PB), which is model-agnostic and cleanly separates hardware economics from model choice."
- go/no-go procedure: A staged decision framework to de-risk large capital deployments by gating further investment; "with the loss probability on deployed capital reducible to roughly 24\% through a staged go/no-go procedure."
- HBM (High Bandwidth Memory): High-throughput stacked memory that dominates accelerator cost and constrains economics; "the three suppliers reallocating the large majority of wafer capacity toward HBM and server products."
- incumbent floor: The lowest defensible marginal cost set by depreciated fleets, below which entrants cannot price sustainably; "The incumbent floor is the lowest marginal cost among fielded legacy fleets --- the price level incumbents can profitably defend indefinitely and entrants cannot reach for the life of their hardware."
- Jevons Absorption: Scenario where demand growth outpaces efficiency, absorbing capacity and keeping all vintages solvent; "Jevons Absorption 20\%."
- KV cache: Key–value attention memory stored during decoding to avoid recomputation; "Unoptimized MoE serving keeps all expert weights and the KV cache resident in HBM."
- KV-cache compression: Techniques to reduce KV memory footprint with minimal quality loss; "KV-cache compression approaching the information-theoretic bound."
- legacy fleet: Hardware that has substantially completed depreciation and operates at marginal cost; "A legacy fleet is a vintage that has completed, or substantially completed, depreciation and therefore operates at marginal cost."
- memory-bandwidth utilization (MBU): The fraction of theoretical memory bandwidth actually delivered by a system; "Memory-bandwidth utilization (MBU) is taken as 0.50 for Hopper, 0.55 for Blackwell, and 0.60--0.62 for Rubin-generation parts."
- metered inference: Inference billed by infrastructure/API providers, the only demand that services capex; "Metered inference is inference billed by an infrastructure or API provider and is the only demand that services capex."
- Mixture-of-Experts (MoE): Sparse model architecture where only a subset of experts is active per token; "MoE sparsity decoupling capability from per-token compute."
- near-Shannon limit: Operating close to the theoretical lower bound on compression error or rate; "TurboQuant's error is close to the Shannon limit."
- open-weight models: Models with publicly available parameters that can be self-hosted and adapted; "the open-weight frontier has effectively caught up for the capability band that serves the large majority of workloads."
- power-usage effectiveness (PUE): Data center efficiency metric of total facility power over IT equipment power; "power at \$0.08/kWh and PUE 1.3."
- premium tier: Token workloads that command higher prices due to capability, reliability, or compliance; "the premium tier comprises tokens commanding frontier-model pricing on grounds of capability, reliability, or compliance."
- regime break: A structural shift in operating practice or market behavior used to segment projections; "the regime break denotes the Q2 2026 doctrinal inversion from token maximization to token minimization that separates projection vintages."
- router-plus-escalation: System design where most traffic is handled by cheap models and escalated to premium ones only as needed; "router-plus-escalation is the margin pool and closed labs are the escalation tier."
- routing arbitrage: Price competition enabled by routing demand to cheaper adequate models; "routing arbitrage drags premium prices down in roughly fixed ratio to collapsing mass prices."
- solvency corridor: The range of demand growth and efficiency trends where capacity earns its cost of capital; "The solvency corridor is the region of (demand growth, efficiency trend) space in which announced capacity earns its cost of capital."
- sticky pricing: A regime where premium prices remain fixed in absolute terms despite falling mass-tier prices; "under sticky pricing, premium prices hold in absolute dollars per token, defended by contracts, compliance lock-in, and switching costs."
- token minimization: An enterprise practice of reducing tokens per task via pruning, routing, and optimization; "token minimization as an enterprise discipline."
- TOP500: The global ranking of the fastest supercomputers, used as an HPC benchmark; "took the #1 TOP500 position at 2.198 EFLOPS sustained."
- TurboQuant: A KV-cache compression technique operating near theoretical limits; "TurboQuant's error is close to the Shannon limit."
- vintage: A purchase-year cohort of capacity with economics governed by its amortization state; "A vintage is a purchase-year cohort of capacity; its economics evolve deterministically over its life."
- vintage breakeven: The premium token share needed for a given purchase year’s fleet to cover costs; "it derives a U-shaped vintage-breakeven curve."
Collections
Sign up for free to add this paper to one or more collections.

