- The paper presents a novel per-pass empirical methodology that incrementally applies LLVM -O3 passes while measuring impacts on runtime, compile time, binary size, and energy.
- The paper uncovers non-monotonic performance improvements with most speedup accrued in later passes, revealing that a small subset of optimizations drive the majority of gains.
- The paper quantifies phase-interference losses averaging up to 46.35% and demonstrates that static metrics like IR instruction count are unreliable proxies for runtime.
Multi-Dimensional Per-Pass Analysis of the LLVM Optimization Pipeline
Overview
The paper "A Multi-Dimensional, Per-Pass Empirical Study of the LLVM Optimization Pipeline" (2606.31238) introduces a comprehensive empirical instrumentation and analysis of the LLVM -O3 optimization pipeline. Departing from previous approaches that considered aggregate pipeline effects or only runtime, the authors construct cumulative prefixes of the -O3 pipeline, measuring the marginal impact of each optimization pass across execution time, compile time, binary size, hardware performance counters, and energy (via RAPL) using an extensive experimental infrastructure. Evaluations span 84,750 measurements across 113 pipeline prefixes and 30 PolyBench/C kernels, under rigorous measurement noise mitigation. The study reveals deeply non-monotonic optimization behavior, quantifies phase-ordering interference, exposes multi-objective trade-offs, and demonstrates the unreliability of static metrics (such as IR instruction count) as proxies for runtime.
Methodology and Experimental Design
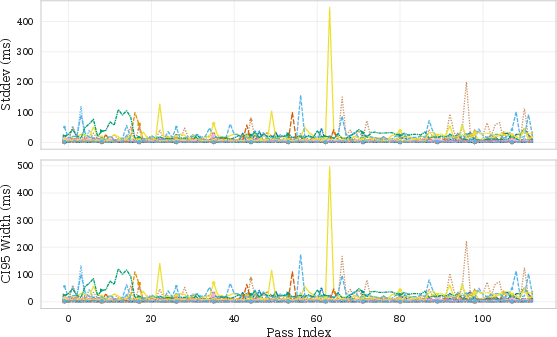
The authors decompose the canonical LLVM -O3 pipeline into 113 ordered passes, forming cumulative prefixes such that each prefix Pi applies the first i passes to the same unoptimized IR. For every prefix, they generate binaries and measure numerous metrics, including median and mean runtime (with 95% confidence), binary size, compile time, multiple hardware event counters (D1, L1-I, LLC misses, cycles, instructions-retired, branch misses), and energy via RAPL. All benchmarks are from PolyBench/C 4.2.1, targeting regular affine compute kernels structurally similar to ML/MLIR-lowered operators. Systematic noise control is achieved via CPU pinning, ASLR disabling, and separate counter collection runs.
Empirical Findings: Runtime, Trade-offs, and Pass Impact
A central empirical finding is the pronounced non-monotonicity of the -O3 pipeline: 6.6% (median) to 9.7% (mean) of pass transitions degrade runtime rather than improve it, providing direct evidence of phase interference even in the default production configuration. Marginal gain analysis, via per-prefix deltas and marginal-utility plots, shows that most passes have negligible standalone effect and that speedup is highly back-loaded—on average, benchmarks require 84.8% of the pipeline passes to achieve 80% of the final speedup, overturning the “front-loaded gain” hypothesis.
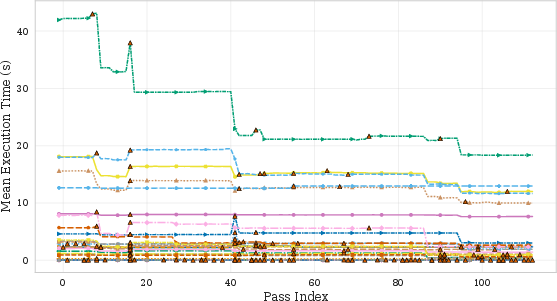
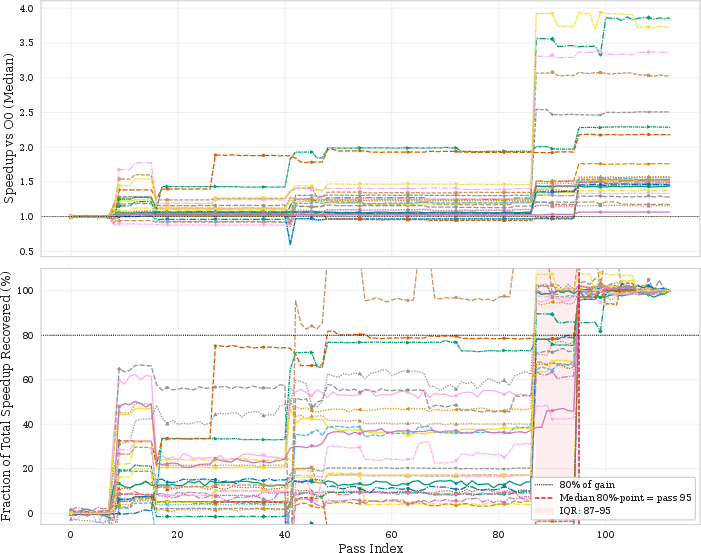
Figure 1: Runtime evolution across the pipeline, with 95% confidence interval, highlighting non-monotonic trajectories and back-loaded speedup accrual.
Decomposition of per-pass effects demonstrates that a small subset of passes (early-cse, licm, instcombine, loop-vectorize, loop-rotate, sroa, simplifycfg, indvars) are responsible for the majority of realized optimization benefit. These passes align closely with traditionally hand-tuned, load-bearing transformations and recur in multiple pipeline positions due to LLVM's hierarchical pass scheduling.
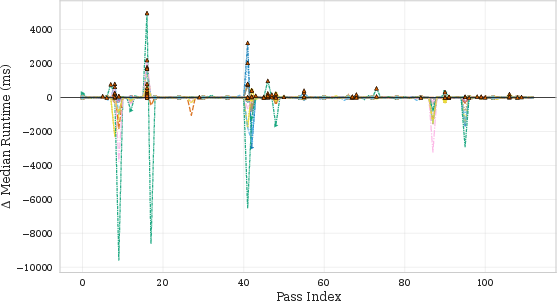
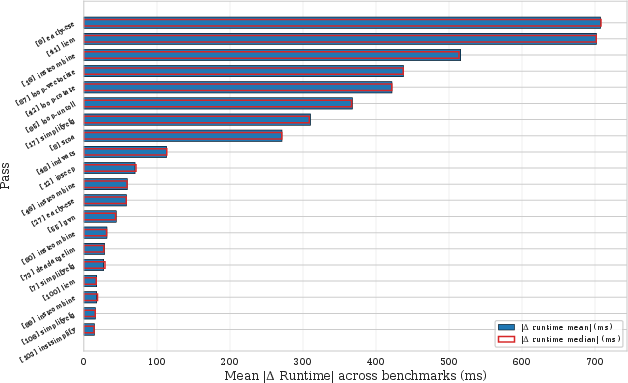
Figure 2: Marginal-utility plot of ΔTi along the pipeline, showing pass-specific impact spikes clustered in a Pareto-dominant regime.
Statistical effect size analysis (Figure 3) confirms that strong and reliable effects are concentrated in the top passes, while effect sizes for the long tail of passes are negligible or inflated due to low variance rather than true impact.

Figure 3: Heatmap of Cohen's d between consecutive variants for the top-10 impactful passes, denoting strong and statistically significant effects for a select few transformations.
Multi-Objective Analysis: Compile-Time, Size, and Pareto Dominance
The paper investigates traditional trade-offs—whether runtime gains are offset by increased compile time or binary bloat. Compile time grows near-monotonically, especially at points of heavy inlining or loop transformations, while binary size is non-monotone: early passes reduce size (dead code elimination); later passes (inlining, unrolling) often increase it substantially.
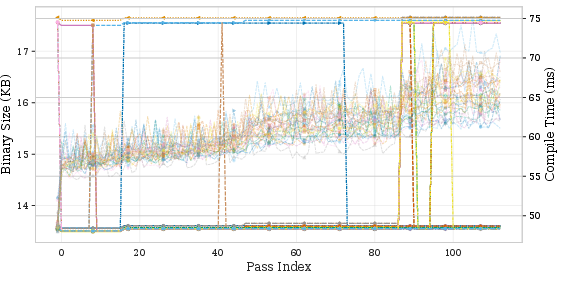
Figure 4: Compile time and binary size trajectories, highlighting near-monotonic compile-time growth and non-monotonic binary size evolution.
A key numerical result is that, in 29 of 30 benchmarks, the final -O3 output is Pareto-dominated: an earlier pipeline checkpoint delivers higher speedup for the same or smaller binary size. This counterintuitive result has direct implications for autotuning or cost-model driven pipeline truncation, as the canonical ordering is not globally optimal across objectives.
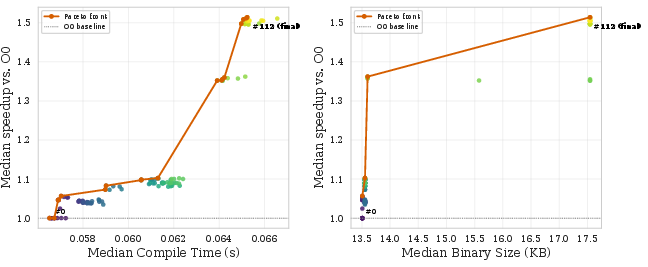
Figure 5: Pareto views of the multi-objective trade-off, parcellating the boundary of achievable (speedup, binary size) trade-offs and illustrating broad final Pareto-dominance by intermediate checkpoints.
Hardware and Energy Profiling
Extending the analysis beyond traditional metrics, the study tracks the hardware-level manifestations of IR transformations using a suite of performance counters and energy measurements. The hardware signature of impactful passes varies: scalar canonicalization produces uniform IPC gain, while late loop vectorization/unrolling causes heavy data-side LLC working set expansion on dense linear algebra benchmarks but reduces instruction count and L1-I misses across the board. Critical insight is that runtime-targeted optimizations are also energy-targeted in these workloads, with observed energy savings of 30–60%.
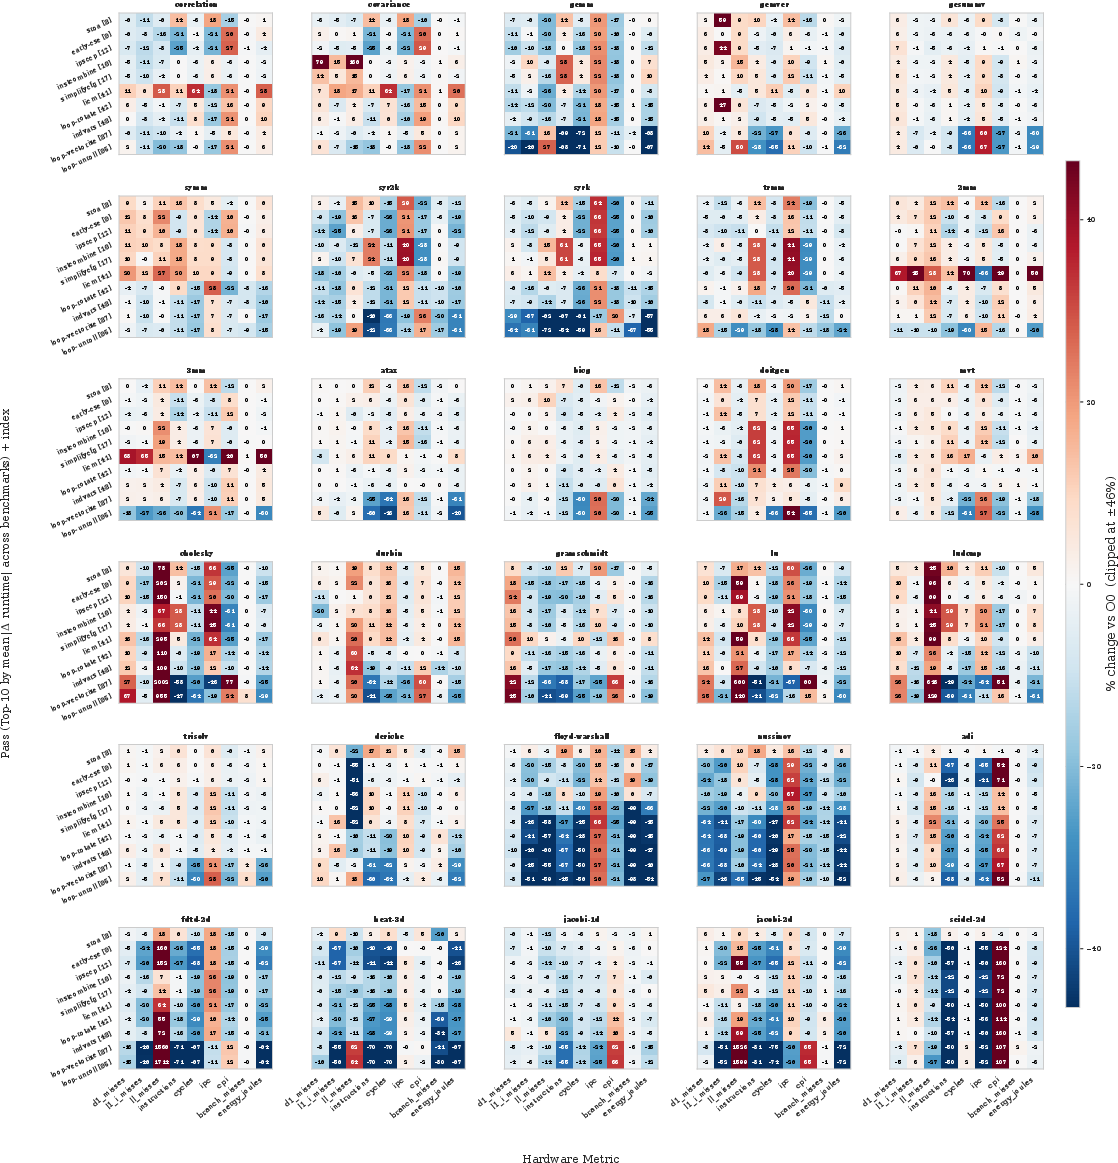
Figure 6: Per-benchmark hardware-counter signatures at the top-10 most impactful pass positions, revealing benchmark-specific and universal microarchitectural effects.
Further, detailed per-pass Δ-trajectories across six key dimensions (runtime, IPC, cache misses, cycles, energy) show that the few most impactful passes dominate all six, with most passes effecting little or no change.
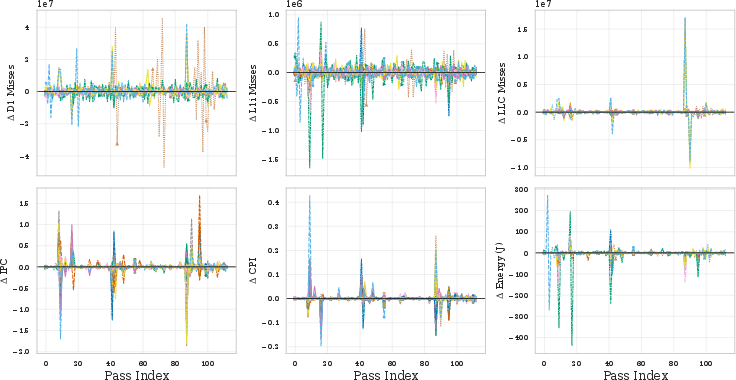
Figure 7: Per-pass Δ-trajectories across runtime, IPC, cache misses, cycles, and energy, showing the dominance of a small number of passes.
The study decouples binary size growth from instruction cache pressure: L1-I misses decline with instruction count, and only data cache (LLC) pressure increases for the bulk of late passes, specifically on memory-intensive workloads.
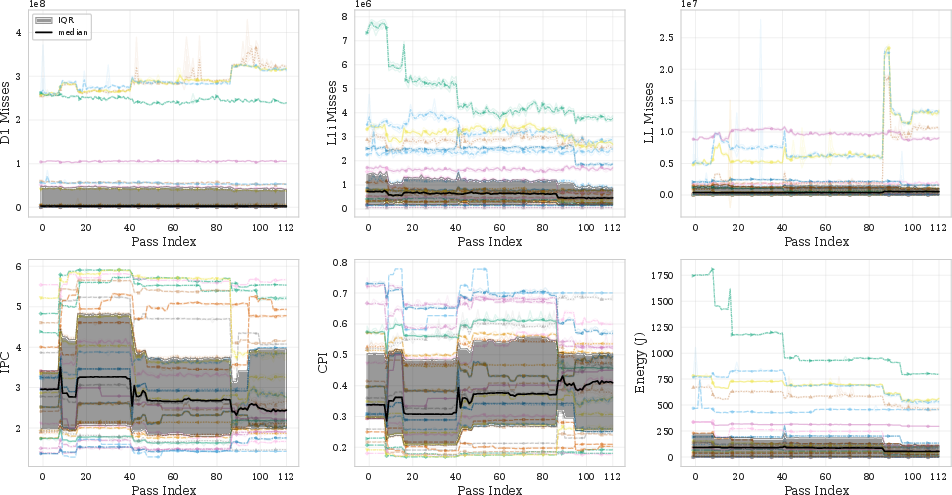
Figure 8: Per-pass evolution of D1, LLC, and L1-I miss rates, IPC, CPI, and energy, demonstrating metric convergence and dominated outlier clusters.
Phase-Interference Quantification
The investigation introduces a novel, search-free, per-pass-attributed quantification of phase-interference loss L: the fraction of speedup attainable under an idealized additive model but lost due to destructive pass interactions. This upper bound is substantial—mean L=46.35% (median 39.3%)—providing the first reproducible empirical estimate of latent optimization potential foregone by pipeline interference, as opposed to search-derived alternative orderings.
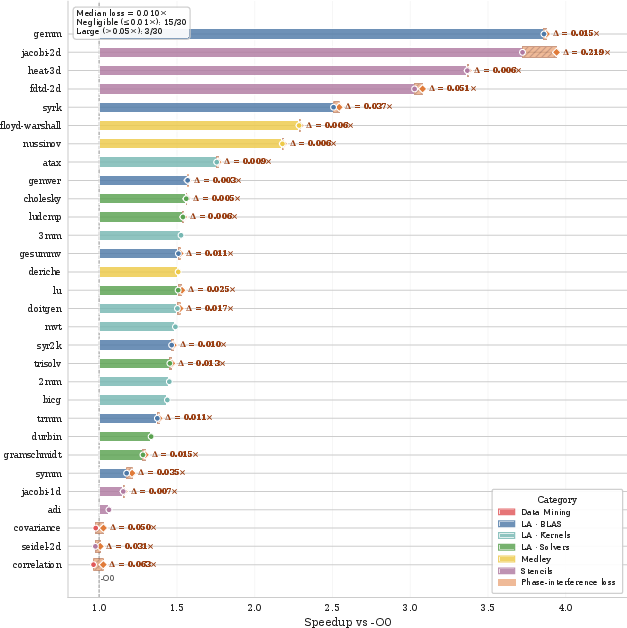
Figure 9: Bounded phase-interference loss L per benchmark quantifying the unrealizable additive upper bound on speedup lost to intra-pipeline interference.
Negative Results: Static Metrics as Proxies
The correlation between static IR-level features and runtime is found to be weak (Spearman ρ=0.31 cross-benchmark, negative or unreliable within-benchmark for 27/30 cases). This refutes the reliability of IR-instruction count as a predictor in cost models—a negative result with direct relevance for MLIR and other code-generation frameworks.
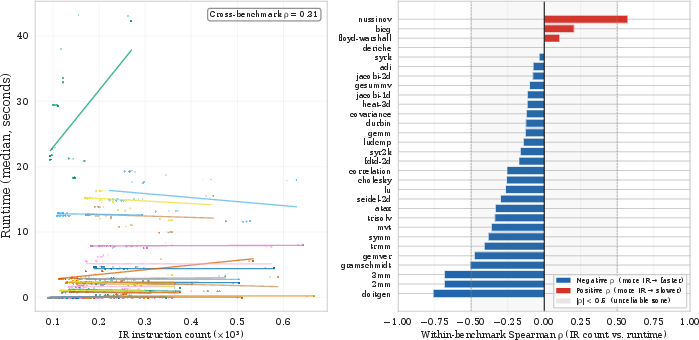
Figure 10: Correlation between IR instruction count and median runtime, confirming the unreliability of IR count as a runtime proxy under pipeline variation.
Implications, Methodological Recommendations, and Applicability
The study's findings have broad implications for compiler autotuning, cost-model calibration, MLIR-based code generation, and the empirical evaluation of complex optimization pipelines:
Conclusion
This paper delivers a rigorous, empirically anchored characterization of the LLVM -O3 optimization pipeline, dissecting it at per-pass, multi-metric granularity. The canonical pipeline is shown to be non-monotonic, back-loaded, and profoundly impacted by phase-ordering effects. A small, reproducibly core set of passes delivers the optimization payload; the remainder are effectively inert or contextually regressive. Final outputs are often Pareto-dominated, and phase interference incurs a large, unrecoverable opportunity cost under default ordering. The presented methodology and results strengthen the foundation for future autotuning, principled pass selection, and informed empirical design of compiler transformation sequences. The approach and infrastructure outlined will be highly relevant for future research in optimizing compiler design, MLIR-based code generation, and AI-driven autotuning strategies.