PPT-Eval: A Benchmark for Computer-Use Agents on PowerPoint Tasks
Abstract: Creating and editing slides is a rich, multimodal activity that is ubiquitous in professional and educational settings, making it an ideal testbed for real-world computer-use agents. Microsoft PowerPoint is among the most widely adopted and feature-rich environments for presentation creation. We introduce PPT-Eval, a benchmark of 120 PowerPoint tasks across 12 files that cover both content creation and presentation editing scenarios, organized by difficulty. A central challenge in this domain is evaluation: tasks are complex, multimodal, and often admit many valid solutions. Moreover, today's agents frequently make only partial progress, which binary success metrics fail to capture. To address this, we design a robust evaluation framework to help create task-specific rubrics for PowerPoint tasks, taking inspiration from and building on past works for rubric-based evaluation. These rubrics award partial credit for intermediate steps, penalize unnecessary changes and poor aesthetics, and provide natural language feedback. This nuanced approach proves highly effective, achieving a Kendall's τ-b correlation of 0.77 with human judgments. We find that existing frontier agents still struggle with solving PowerPoint tasks, with strong models like Claude-4.5-Opus achieving only a 45% success rate and an average partial score of 57%. The benchmark is located at: https://microsoft.github.io/ppteval.
Paper Prompts
Sign up for free to create and run prompts on this paper using GPT-5.
Top Community Prompts
Explain it Like I'm 14
PPT‑Eval: A teen‑friendly summary
What is this paper about?
This paper introduces PPT‑Eval, a big set of challenges (called a “benchmark”) to test how well AI “computer‑use agents” can make and edit Microsoft PowerPoint slides. Think of a computer‑use agent as a smart helper that moves the mouse, types, and clicks buttons on the screen like a person would—except it’s an AI. The goal is to see how good these agents are at real, everyday slide tasks (adding text, fixing layouts, inserting images, making tables, setting animations, and more).
What did the researchers want to find out?
In simple terms, they asked:
- Can today’s AI agents actually use PowerPoint well, the way people do?
- How can we fairly judge their work when there are many “right” ways to make a good slide?
- Can we score partial progress (not just pass/fail), the same way a teacher gives points for doing part of a problem?
How did they study it?
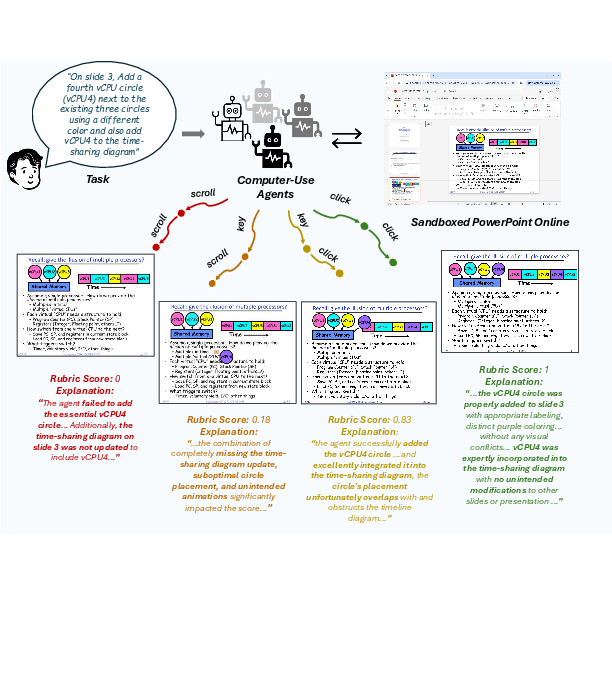
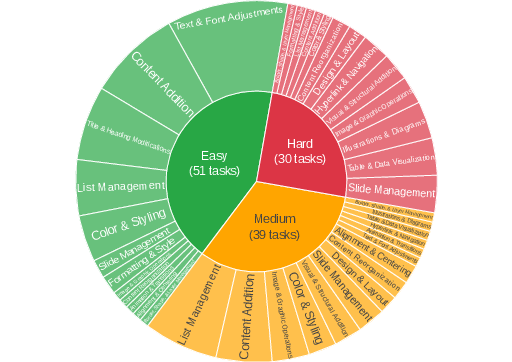
They built PPT‑Eval, which contains 120 tasks spread across 12 real PowerPoint files. Tasks are labeled easy, medium, or hard. Examples include things like “reformat this slide to three columns,” “insert a SmartArt diagram,” or “sort a table.”
To make testing realistic, the agents work in PowerPoint Online in a safe “sandbox” (a controlled environment), using the keyboard and mouse like a human would. That means they can access the full set of PowerPoint features (layouts, themes, transitions, animations, etc.), not just a limited programming interface.
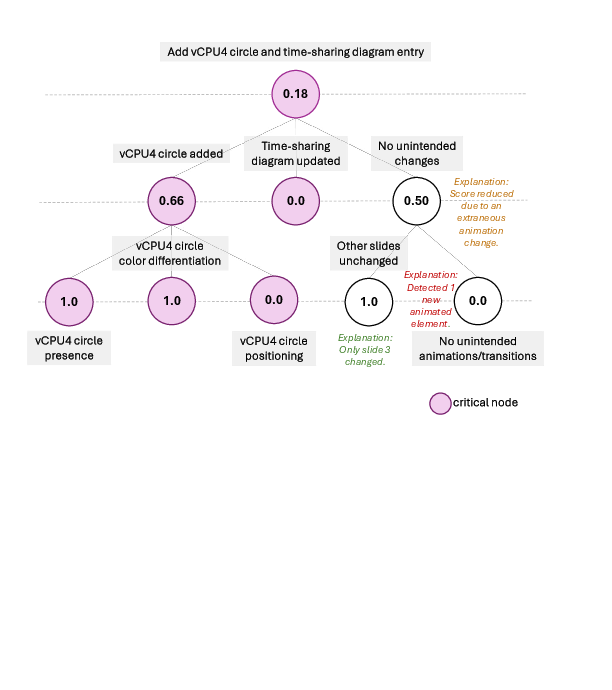
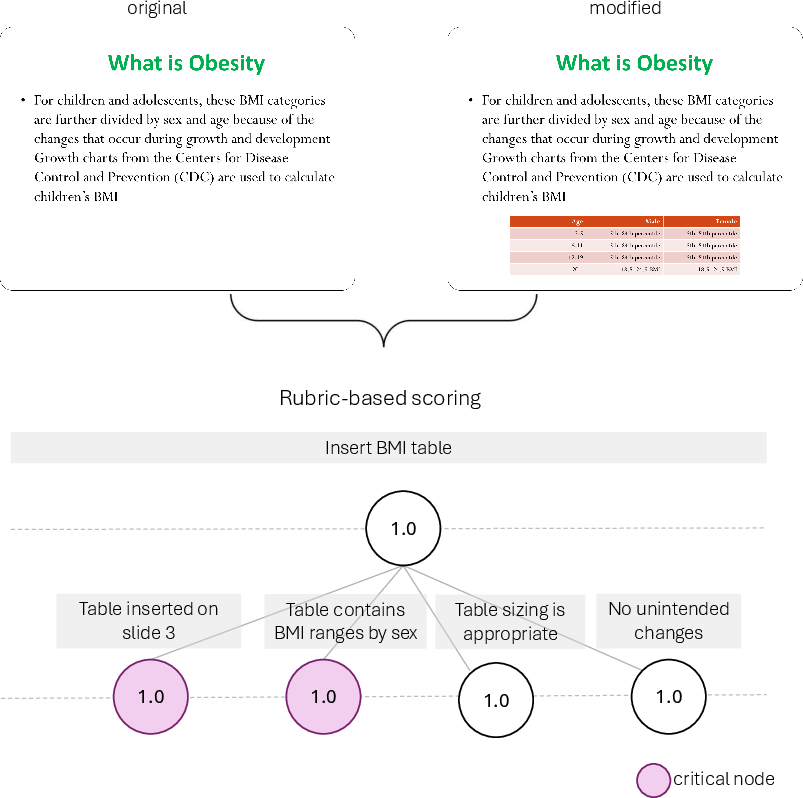
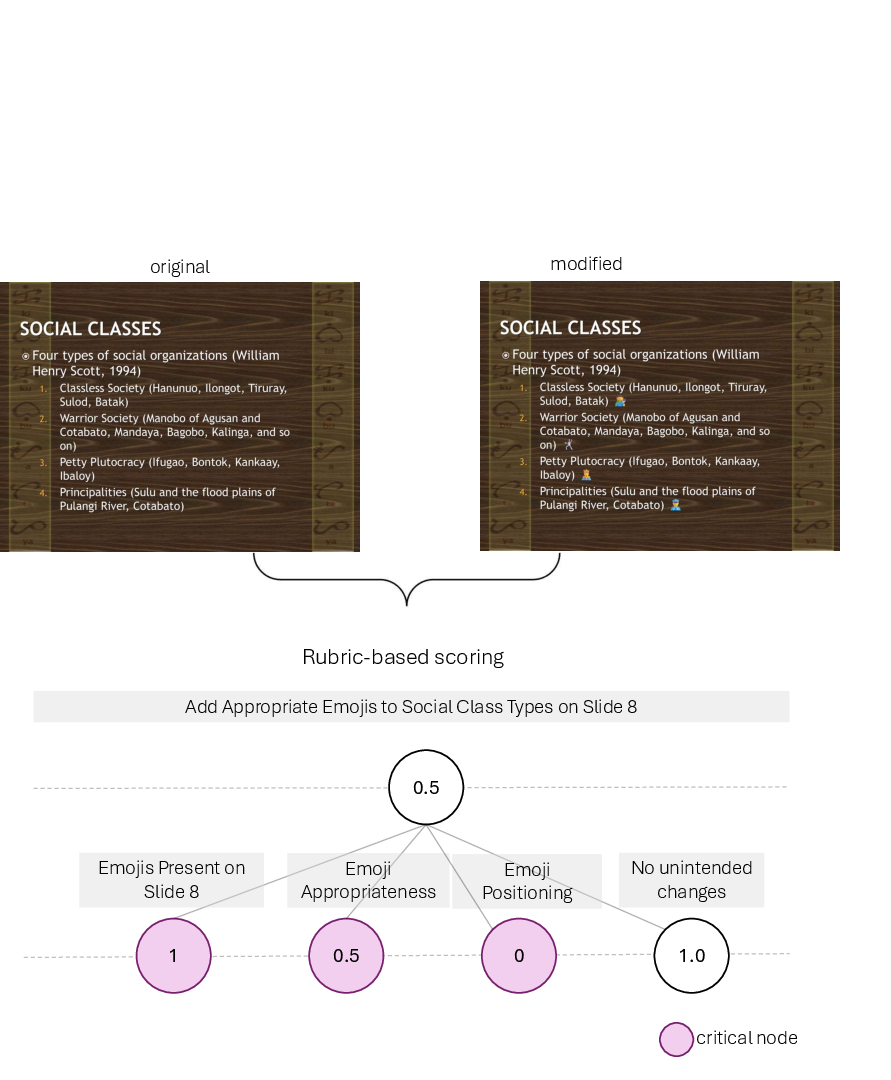
Scoring is done with rubrics—like a teacher’s checklist:
- The rubric looks for key steps (“critical” items) and nice‑to‑have steps (“non‑critical” items).
- It gives partial credit for meaningful progress and subtracts points for unnecessary or messy changes.
- It can use both program checks (comparing before/after files) and AI vision/language checks (to judge if something looks right or says the right thing).
- The rubric explains the score in plain language so you know what went well and what didn’t.
To make the tasks and rubrics:
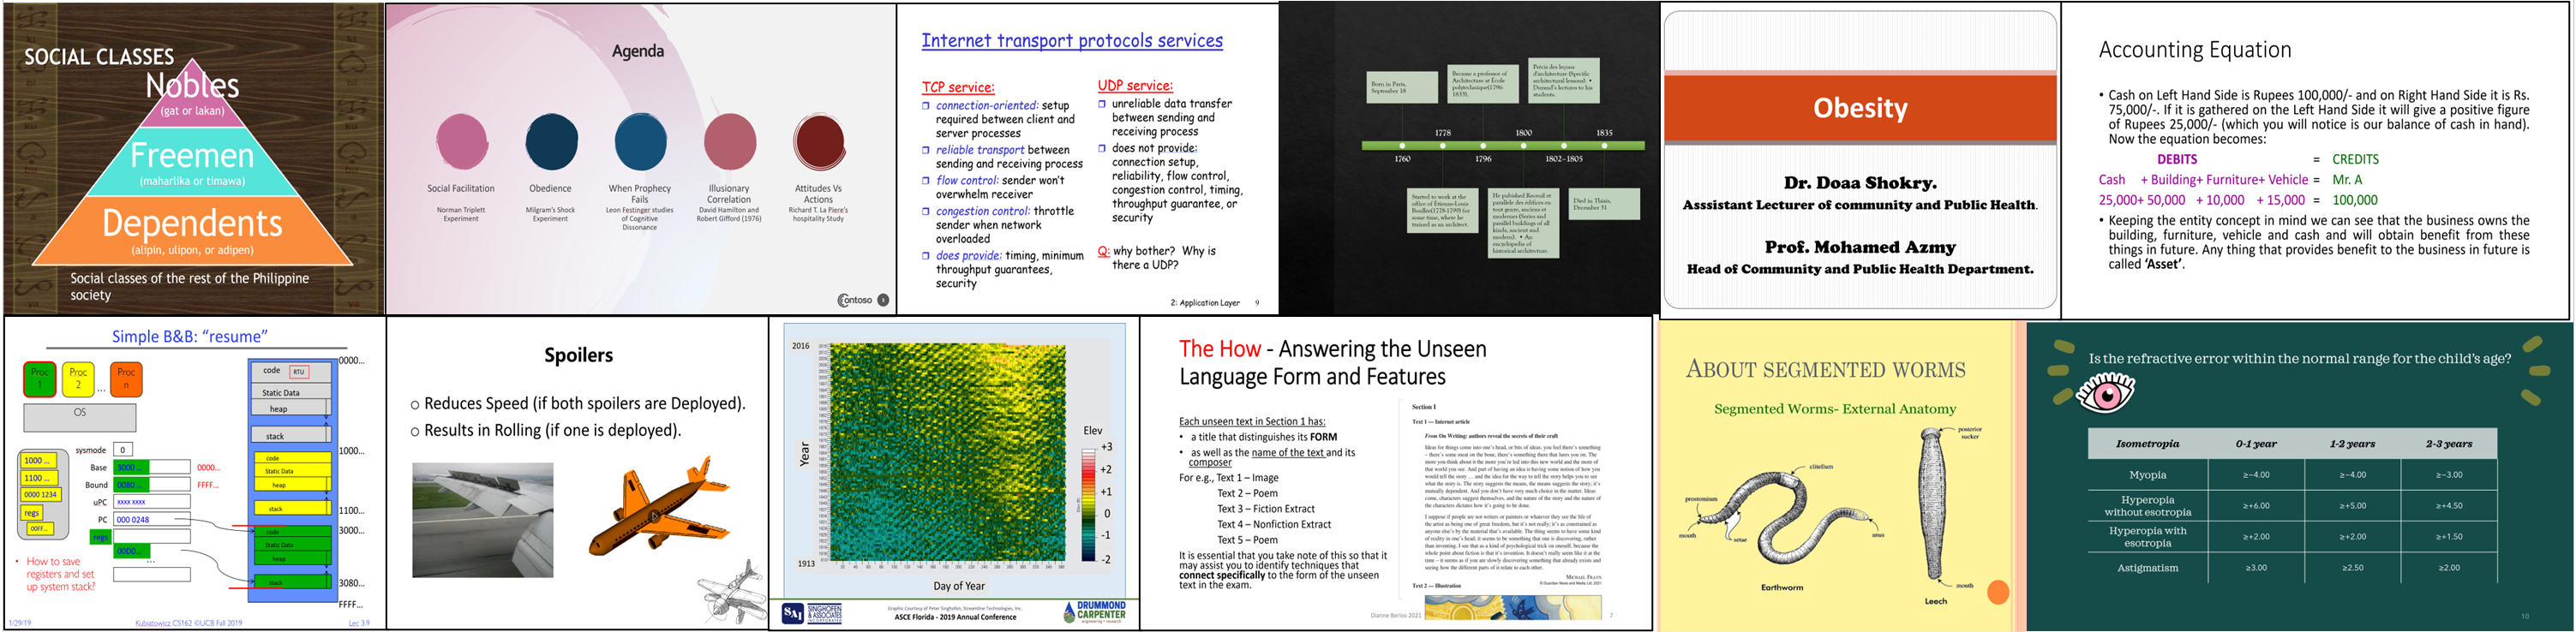
- They collected openly licensed slide decks on many topics (science, history, medicine, etc.).
- An AI helped suggest task ideas, and humans picked the best ones and cleaned them up.
- AI drafted the rubrics, and humans refined them to be fair and reliable.
They also checked how well the rubric matches human judgment. A statistic called Kendall’s tau () was 0.77, meaning the rubric’s rankings agreed strongly with how people ranked the quality of attempts.
What did they discover?
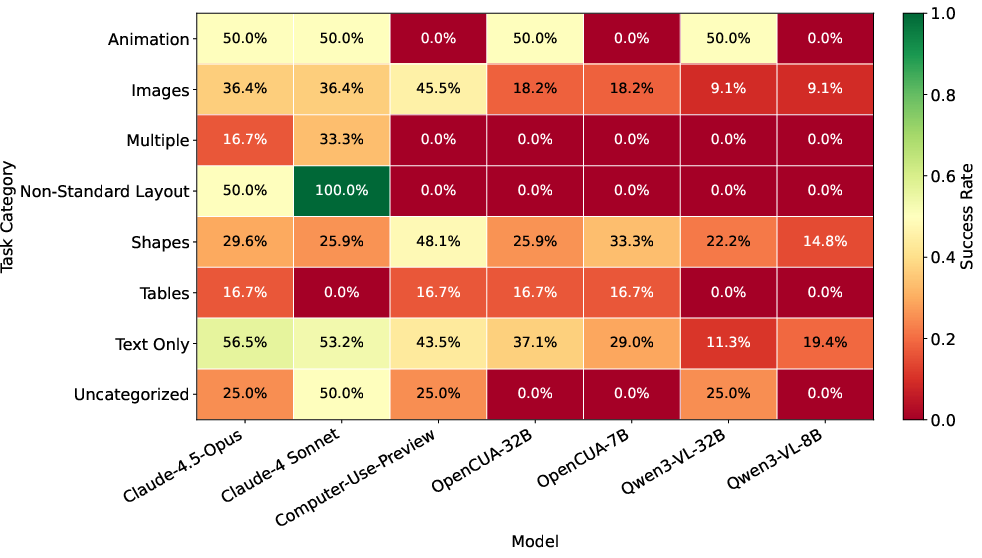
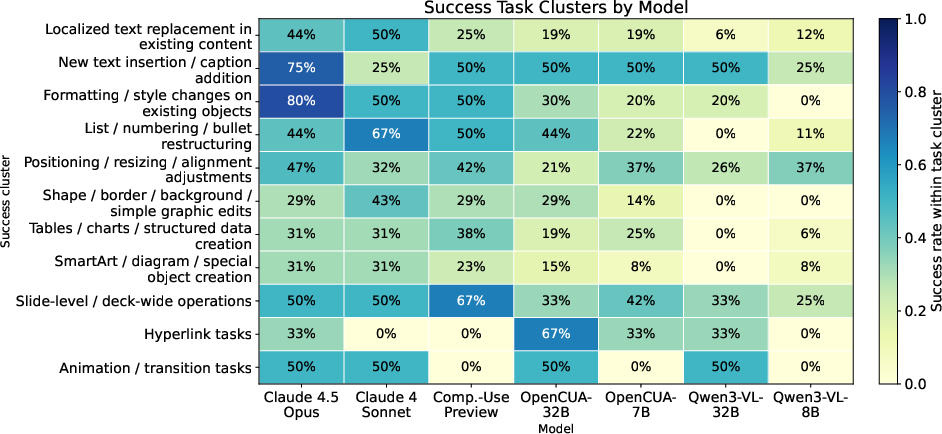
They tested several agents, including top commercial ones and open‑source ones, plus real people as a baseline, and also an API/code‑based agent. Here’s the big picture:
- Humans: about 80% success rate and a high average score (about 0.90).
- Best GUI (mouse/keyboard) agent: about 45% success and a moderate average score (about 0.57).
- API/code agent: about 62% success and 0.81 average score—better than GUI agents, but limited on features that aren’t easy to control with code (like some design tools or animations).
- Open‑source GUI agents: lower scores overall than the top commercial ones.
In short: even the best GUI agents can do a fair amount but still make mistakes, struggle on harder tasks, and lag behind people. The rubric’s partial scoring helped show meaningful progress even when agents didn’t fully finish a task.
Why does this matter?
- Real‑world usefulness: Many students and workers spend hours making slides. Smarter slide‑editing agents could save lots of time and help people communicate better.
- Better training and fairer testing: This benchmark provides a realistic way to test agents on everyday, visual, and creative tasks—and to judge partial progress rather than just pass/fail.
- Clear room for improvement: The gap between humans and agents (and between API‑based and GUI‑based skills) shows where researchers should focus next—like handling complex layouts, animations, or aesthetics.
What’s next?
The authors suggest:
- Improving how partial credit is given so it lines up even more smoothly with human judgment.
- Speeding up rubric creation with better AI tools, so it’s easier to build lots of high‑quality tasks.
- Expanding beyond PowerPoint to multi‑app workflows (for example, using Excel, Word, and email together), which is how people often work in real life.
Overall, PPT‑Eval is like a fair, detailed scoreboard for testing how well AI can actually use a computer to make good slides—something many of us do all the time.
Knowledge Gaps
Knowledge gaps, limitations, and open questions
Below is a single, consolidated list of what remains missing, uncertain, or unexplored in the paper, phrased to guide concrete follow-up work:
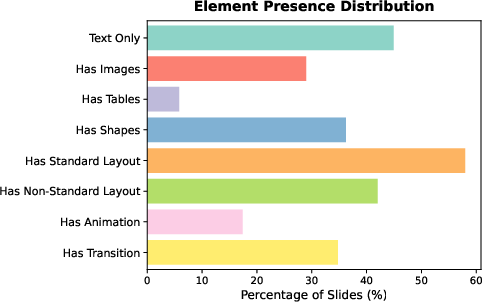
- Limited scale and diversity: only 120 tasks across 12 decks may not capture the breadth of real-world slide-editing workflows, styles, and edge cases (e.g., corporate templates, dense charts, complex animations, designer-assisted layouts).
- Task difficulty calibration: difficulty tiers are based on estimated effort rather than empirical measurements; lacks human time/step statistics and inter-annotator agreement on difficulty.
- Representativeness of sources: decks are sourced from the Internet Archive and may not reflect typical enterprise decks, templates, and brand guidelines (risk of selection bias).
- English-only scope: no tasks involving non-English or right-to-left languages, font fallback issues, or locale-specific formatting—unclear generalization to multilingual settings.
- Accessibility workflows absent: no tasks for alt text, reading order, contrast checks, or accessible templates—key for real-world slide quality and compliance.
- Collaboration and review features untested: no tasks involving comments, version history, track changes, or co-authoring—common in enterprise workflows.
- Cross-application workflows missing: benchmark isolates PowerPoint; does not include realistic multi-app tasks (e.g., linked Excel charts, Word content imports, email presentation handoff).
- Dynamic media excluded: audio/video, embedded 3D objects, or add-ins are omitted; open question on how to evaluate agents on rich media tasks.
- Advanced animation/timing fidelity: evaluation uses XML extraction but does not verify visual timing/sequence semantics or playback correctness beyond presence/metadata.
- Aesthetic evaluation is subjective: reliance on VLM/LLM judgments for design quality and “poor aesthetics” penalties lacks formal, reproducible metrics for typography, alignment, contrast, and spacing.
- Partial-credit scoring calibration: the aggregation parameter λ=0.3 is set heuristically—no sensitivity analysis or ablation to justify robustness across tasks.
- Intermediate progress assessment gaps: rubric meta-evaluation shows lower accuracy for “Some Progress” and “Significant Progress”; needs targeted improvements and error analysis.
- Evaluator-model dependency: rubrics depend on a single LLM/VLM (Claude-4-Sonnet) at inference time, raising concerns about evaluator bias and robustness across scoring models.
- Limited meta-evaluation sample: rubric reliability is assessed on 30 tasks with 2–4 attempts each; lacks larger-scale validation and cross-dataset replication.
- Potential gaming of rubrics: no analysis of adversarial behavior where agents satisfy minimal checks while degrading overall slide quality; requires stress-testing and anti-gaming safeguards.
- Ambiguity in “unnecessary changes” penalties: thresholds and detection logic for benign vs. detrimental edits are under-specified; needs canonicalization and tolerance policies.
- Equivalence beyond exact matches: guidance is needed for robust semantic/visual equivalence checks (e.g., acceptable layout variants, paraphrasing) without overfitting to a single solution.
- Generalization to other platforms: results are specific to PowerPoint Online; transferability to desktop PowerPoint, Google Slides, or Keynote remains untested.
- Environment fragility and updates: the benchmark depends on PowerPoint Online’s evolving UI; missing strategy for versioning, UI changes, and long-term maintenance.
- Network/UI nondeterminism: the impact of latency, page load variability, and browser quirks on agent performance and reproducibility is not quantified.
- Step budget and planning: fixed 30-step cap may truncate long-horizon tasks; no analysis of sample efficiency, planning quality, or cost–performance trade-offs.
- Human baseline comparability: human results lack step/time records, making it hard to compare efficiency or error recovery between humans and agents.
- Scaling rubric creation: semi-automatic rubric generation still requires ~150 hours of expert edits; no clear path to generate thousands of high-quality rubrics for training or RL at scale.
- Reward learning potential: partial scores are promising for RL but no experiments show how well rubrics support reward shaping, stability, or exploitation resistance during training.
- Fairness across benchmarked models: the same model family contributes to rubric scoring (Claude for evaluation) and task generation; risk of evaluator–evaluatee coupling or inadvertent bias.
- Coverage of PowerPoint features: some capabilities (e.g., Designer suggestions, Slide Master edits, theme customization at scale, hyperlink verification in runtime) are lightly or not evaluated.
- Hyperlink and interactivity validation: beyond XML checks, link functionality and navigation behavior are not systematically tested via GUI playback.
- Release artifacts for reproducibility: the paper does not state whether gold-standard “ideal” solutions, action traces, or detailed per-task scoring breakdowns are released for independent verification.
- Benchmark overfitting risk: with a small, public set of tasks, models may tune to the benchmark; lacks hidden test sets or rotation strategies.
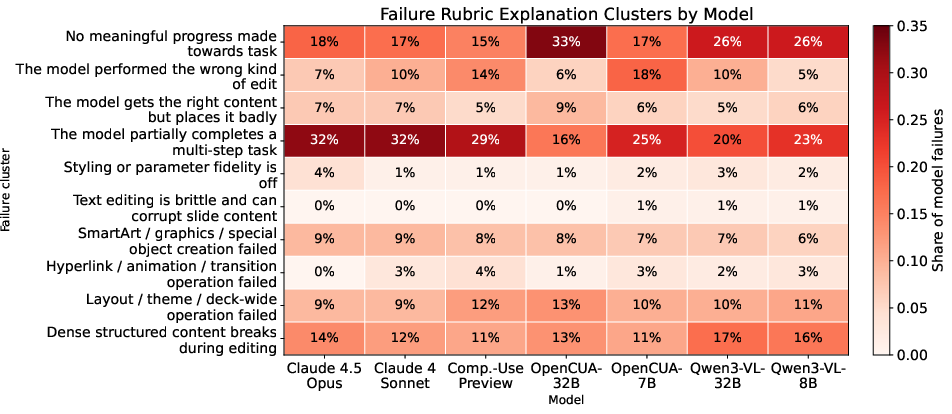
- Error taxonomy: performance analysis focuses on success rates and partial scores, but lacks a structured taxonomy linking failure modes (e.g., perception, tool discovery, layout reasoning) to actionable interventions.
- Internationalization of fonts and assets: impact of missing fonts, substituted fonts, and asset availability on model behavior and scoring remains unexamined.
- Hybrid approaches unexplored: combining GUI control with APIs/CLIs (when available) might close the performance gap; no baseline or study of hybrid agents.
- Human-in-the-loop evaluation: no investigation into integrating lightweight human judgments with rubrics for subjective aspects (e.g., aesthetics) and for powering iterative refinement.
- Cost and compute constraints: while runtime is reported (~3.5 hours/run), there is limited discussion of scoring compute costs (LLM/VLM calls) and budget-aware benchmarking protocols.
Practical Applications
Below is a concise mapping from the paper’s contributions (a GUI-based benchmark for PowerPoint task-solving, a sandboxed environment for PowerPoint Online, and a rubric-based, partial-credit evaluation framework) to real-world applications. Items are grouped by deployment horizon and annotated with sector links, emergent tools/workflows, and key assumptions or dependencies.
Immediate Applications
These can be piloted or deployed today using the released benchmark, sandbox harness, and rubric framework.
Software/AI and Productivity
- Benchmarking and regression testing for GUI agents
- What: Use PPT-Eval to evaluate and compare computer-use agents (internal models or vendor products) on realistic slide-editing tasks with partial-credit scoring.
- Sectors: Software/AI, Enterprise IT
- Tools/workflows: CI pipelines that run the 120-task suite per model release; dashboards tracking success rate and average partial scores by task category (text, images, tables, animations).
- Assumptions/dependencies: Stable access to PowerPoint Online; sandbox infrastructure (e.g., screenenv, Chromium) and OneDrive anonymous edit links; tolerance for LLM/VLM scoring latency and cost.
- Reward modeling and offline RL fine-tuning using rubric scores
- What: Leverage the rubric’s partial scores and explanations as dense rewards or preference signals to train/improve GUI agents without human labels.
- Sectors: Software/AI
- Tools/workflows: Batch evaluation of agent rollouts with rubric trees; reward-model training; curriculum learning (easy→hard tasks).
- Assumptions/dependencies: Budget for LLM/VLM calls in leaf checks; compute for iterative training; current rubrics cover PowerPoint but not other apps.
- Slide QA and brand-compliance checker
- What: Turn the rubric engine into a “Slide QA Bot” that flags off-template fonts/colors, alignment issues, unnecessary edits, and provides natural-language feedback.
- Sectors: Marketing, Sales, Enterprise Comms
- Tools/products: PowerPoint add-in or M365 Copilot plugin; pre-commit “deck linter” in content workflows; Git-like review for decks.
- Assumptions/dependencies: Access to brand style guides encoded as rubric criteria; tenant policies for add-ins; model privacy policies for processing slides.
- Accessibility and basic design checks
- What: Extend rubric leaves to check contrast, font sizes, alt text presence, reading order for screen readers; penalize poor aesthetics.
- Sectors: Public sector, Education, Enterprise
- Tools/workflows: “Accessibility pass” in pre-presentation reviews; auto-generated remediation suggestions.
- Assumptions/dependencies: VLM reliability for visual judgments; alignment with standards (e.g., WCAG) encoded in rubric nodes.
- Human-in-the-loop slide assistant with measurable quality
- What: Pair a GUI agent with post-edit rubric feedback so users can quickly accept/reject edits and understand what remains.
- Sectors: General productivity, Daily life, SMBs
- Tools/products: “Fix-this-slide” button; partial-credit feedback sidebar; undo-safe application of agent suggestions.
- Assumptions/dependencies: Agents remain below human performance on complex tasks; user trust and oversight; reliable rollback of unintended changes.
Academia and Education
- Auto-grading and formative feedback for presentation assignments
- What: Use rubric trees to grade slide-editing labs and provide granular feedback on formatting, layout, and content goals.
- Sectors: Education (K–12, higher ed)
- Tools/workflows: LMS integration (Canvas/Moodle) that evaluates submitted PPTX files; per-criterion comments synthesized by the rubric.
- Assumptions/dependencies: Alignment of rubric with instructor grading schemes; compute costs for rubric inference; privacy for student materials.
- Reproducible research testbed for GUI agents
- What: Standardize experiments on multimodal computer-use agents; report Kendall/Spearman correlations to validate evaluators.
- Sectors: Academia (HCI, ML, NLP, CV)
- Tools/workflows: Shared harness for PowerPoint Online; task/trajectory release; cross-lab leaderboards.
- Assumptions/dependencies: UI stability in PowerPoint Online; continued access to anon-edit links.
Policy and Procurement
- Internal evaluation standards for office AI procurement
- What: Use PPT-Eval tasks and scoring to vet third-party agents (RFPs, pilots) for document/presentation workflows.
- Sectors: Public sector, Regulated industries
- Tools/workflows: Model acceptance thresholds (e.g., min avg. partial score by category); audit trails of rubric explanations.
- Assumptions/dependencies: Contractual permission for cloud evaluation; data handling policies; alignment on acceptable error types (e.g., no unintended edits).
Long-Term Applications
These require further research, scale-up, or ecosystem changes (e.g., stronger GUI agents, cross-app coverage, automated rubric generation).
Cross-Application, Enterprise-Scale Agents
- Multi-app office workflow agents with partial-credit evaluators
- What: Agents that move content across Word/Excel/PowerPoint/Email with rubric-based evaluators for each app and inter-app transformations.
- Sectors: Enterprise productivity, Finance, Healthcare, Energy/Engineering
- Tools/products: “Quarterly deck assembler” that pulls charts/tables from Excel, formats into brand-consistent slides, and self-evaluates with rubrics.
- Assumptions/dependencies: Robust GUI control across apps; richer, standardized rubric SDKs; stronger VLMs for layout/visual equivalence; organizational data integration and permissions.
- Brand- and compliance-aware autonomous slide editors
- What: Near-human GUI agents that autonomously refactor decks to meet brand, legal, and privacy rules; propose changes with low supervision.
- Sectors: Marketing, Legal/Compliance, Pharma, Finance
- Tools/products: Compliance copilot that detects risky content, enforces disclaimers, and self-checks edits.
- Assumptions/dependencies: Reliable detection of “unnecessary edits”; model alignment and auditability; domain-specific rubric packs.
Training and Evaluation Infrastructure
- Sandbox-as-a-Service for GUI agent evaluation
- What: Managed service providing isolated, reproducible Office Online environments and rubric scoring as APIs.
- Sectors: AI vendors, Large enterprises, Academia
- Tools/products: Evaluation credits; hosted leaderboards; privacy-preserving sandboxes; red-team suites for safety testing.
- Assumptions/dependencies: Long-term API stability from office-suite providers; licensing terms; cost-effective LLM/VLM inference.
- Scalable auto-rubric generation and rubric-learning
- What: Automated creation/refinement of rubric trees from task specs and demonstration data; learning rubric weights from human preferences.
- Sectors: Software/AI, Academia
- Tools/workflows: Synthetic task generation; few-shot rubric induction; rubric-reward model distillation.
- Assumptions/dependencies: Advances in rubric induction reliability; safeguards against reward hacking; evaluation of subjectivity and fairness.
- Generalized rubric engine for multimodal GUIs beyond slides
- What: Apply tree-structured, partial-credit evaluation to other apps (design tools, CAD, video editors, web design).
- Sectors: Design, Media, Manufacturing
- Tools/products: “Design QA” evaluators for Figma or CAD; visual-diff plus semantic checks for layout and constraints.
- Assumptions/dependencies: App-specific APIs or reliable screenshots; VLM progress on fine-grained visual reasoning and spatial relationships.
Sector-Specific Workflows
- Healthcare: Patient education deck assembly with safety checks
- What: Agents assemble patient-facing slides from approved materials; rubrics verify readability, accuracy proxies, and branding.
- Sectors: Healthcare
- Tools/products: Content governance pipelines; hospital-approved slide libraries; automatic localization.
- Assumptions/dependencies: Strict privacy/security; medical content validation beyond aesthetics; integration with EHR-safe repositories.
- Education: Intelligent tutoring for presentation skills
- What: Personalized coaching on slide design and structure; step-by-step practice tasks with rubric-based feedback loops.
- Sectors: Education
- Tools/products: “Presentation coach” modules integrated in LMS; analytics on progress by skill (layout, hierarchy, visuals).
- Assumptions/dependencies: Reliable pedagogical rubrics; fairness and accessibility considerations; cost controls for large student cohorts.
- Finance and Board Reporting: Automated narrative and layout polish
- What: Agents that refactor board/QBR decks from raw figures; rubrics enforce crisp layouts, consistent labeling, and change tracking.
- Sectors: Finance, Enterprise leadership
- Tools/products: “Narrative polish” pipelines; approval workflows with rubric-based sign-off criteria.
- Assumptions/dependencies: Near-human precision on tables/charts; robust detection of unintended edits; strict audit requirements.
Standards and Governance
- Certification benchmarks for office-document AI
- What: Independent benchmarks and thresholds (e.g., min Kendall correlation to human grading) for certifying AI tools used in public sector or regulated domains.
- Sectors: Policy, Standards bodies
- Tools/workflows: Open standards for rubric formats; sector-specific test suites; auditing procedures with reproducible sandboxes.
- Assumptions/dependencies: Consensus among vendors and regulators; reproducibility guarantees; transparent reporting of partial-credit logic.
- Privacy-preserving, on-device evaluation and editing
- What: Local VLM/LLM-backed rubric checks and editing for sensitive decks; no cloud egress.
- Sectors: Defense, Finance, Healthcare
- Tools/products: On-prem add-ins; edge models for visual checks; secure enclaves for evaluation.
- Assumptions/dependencies: High-quality on-device VLMs; hardware acceleration; cost-effective maintenance.
In summary, PPT-Eval’s GUI-driven environment and rubric-based partial-credit evaluation enable immediate enhancements in benchmarking, QA, education, and procurement while laying the groundwork for long-term, cross-application, compliance-aware, and standardized AI systems for office productivity. Feasibility hinges on stable access to PowerPoint Online, the cost/latency of LLM/VLM scoring, UI stability, privacy/compliance constraints, and ongoing advances in GUI-agent robustness and visual reasoning.
Glossary
- action space: The set of actions available to an agent during interaction with an environment. "we augmented the agent’s action space with an additional tool (add_tasks_to_dataset(tasks: list[str]))"
- agent harness: A wrapper or framework that orchestrates an agent’s tools, prompts, and execution flow. "implemented using the Claude Code agent harness"
- anonymous edit access: Permission to modify a document via a link without authentication or account login. "because the link provides anonymous edit access"
- API-bound benchmarks: Benchmarks that restrict interaction to programmatic APIs rather than full user interfaces. "Unlike API-bound benchmarks, PPT-Eval enables agents to access the full functionality available to human users"
- API-based (or CLI) agent: An agent that performs tasks through programmatic or command-line interfaces instead of graphical interaction. "we also add a strong API-based (or CLI) agent"
- critical vs. non-critical criteria: Rubric categories distinguishing essential requirements from desirable but secondary ones. "we distinguish between critical and non-critical criteria"
- deterministic initialization: A consistent, repeatable starting state for experiments to improve reproducibility. "enabling deterministic initialization, safe execution, and parallel evaluation."
- frontier proprietary models: The most advanced, closed-source models from leading providers at a given time. "The frontier proprietary models we benchmark, Computer-Use-Preview, Claude-4-Sonnet and Claude-4.5-Opus, achieve moderate scores on the benchmark"
- gate-then-average rule: An aggregation policy in which failure on any critical criterion zeros the score before averaging non-critical ones. "Mind2Web 2 adopts a gate-then-average rule"
- GUI-based interaction: Direct manipulation of software via graphical user interfaces (e.g., mouse/keyboard), rather than APIs. "a benchmark for GUI-based interaction with the web version of PowerPoint (PowerPoint Online)."
- Kendall's τ_b: A rank correlation coefficient measuring ordinal association between two variables, adjusted for ties. "achieving a Kendall's correlation of 0.77 with human judgments."
- LLM: A neural model trained on text that can reason and generate language; here used for rubric checks. "a leaf node's compute_score function may make use of an LLM call"
- LLM-driven exploration: Using LLMs to autonomously explore environments and propose tasks or actions. "using LLM-driven exploration to generate grounded computer-use tasks"
- meta-evaluation: A study evaluating the evaluators (e.g., rubrics) themselves, often by comparing against human judgments. "we conducted a meta-evaluation study."
- method-agnostic: Independent of the solver’s approach (e.g., GUI or API), enabling fair comparison across methods. "This design makes PPT-Eval method-agnostic."
- modified aggregation formula: A scoring aggregation that partially penalizes non-critical failures without nullifying progress on critical criteria. "We instead adopt a modified aggregation formula that yields better partial scoring"
- multimodal: Involving multiple data modalities such as text, images, and layout/visual features. "tasks are complex, multimodal, and often admit many valid solutions."
- natural language feedback: Human-readable explanations produced by the rubric to justify scores and guide improvement. "and provide natural language feedback."
- non-standard layouts: Slide structures that deviate from default templates, requiring more nuanced layout reasoning. "(e.g., images, tables, animations, non-standard layouts, etc)"
- non-verifiable domains: Tasks where correctness cannot be fully or easily checked by deterministic rules, often requiring judgment. "RL for non-verifiable domains"
- open-weights models: Released models whose parameter weights are available for use and fine-tuning. "open-weights models like the 7/8B and 32B variants of Opencua and Qwen3-VL"
- OS-level benchmarks: Evaluations conducted across full operating systems and multiple applications, not just single APIs. "OS-level benchmarks such as OSWorld and WindowsAgentArena"
- partial credit: Grading that assigns intermediate scores for incomplete but meaningful progress. "These rubrics award partial credit for intermediate steps"
- PowerPoint Online: The web-based version of Microsoft PowerPoint used for GUI-level agent interaction. "the web version of PowerPoint (PowerPoint Online)."
- PPTDiff: A custom differencing tool to compare slides, detect unintended changes, and extract metadata like transitions/animations. "We also provide a custom PPTDiff class that supports common checks"
- programmatic APIs: Machine interfaces for manipulating documents via code rather than through the GUI. "coverage limitations of programmatic APIs such as python-pptx."
- python-pptx: A Python library for creating and manipulating PowerPoint files programmatically. "via python-pptx"
- sandboxed instance: An isolated runtime environment that contains execution and prevents interference across tasks. "a sandboxed instance of PowerPoint Online."
- screenenv: A tool/environment for rendering and interacting with screen-based applications in a controlled setup. "instantiated with screenenv"
- semantic or visual equivalence: Assessing correctness by meaning or visual arrangement rather than exact string or pixel matches. "assessing semantic or visual equivalence rather than exact matches."
- SmartArt: PowerPoint’s built-in diagramming feature for stylized graphics and relationships. "Insert a SmartArt graphic on slide 3 representing the accounting equation"
- Spearman's ρ: A nonparametric rank correlation coefficient measuring monotonic relationships between variables. "Spearman's rank correlation coefficient."
- Success Rate (SR): The percentage of tasks that achieve a perfect score in the evaluation. "Success Rate (SR) is the percentage of tasks that get a perfect score of 1"
- tree-structured rubric: A hierarchical evaluation structure where internal nodes aggregate leaf checks into a composite score. "Each task is represented by a tree-structured rubric"
- VLM (Vision-LLM): A model integrating visual and textual inputs/outputs, used here to assess visual correctness. "or a VLM call (to assess correctness visually)"
- VLM hallucinations: Incorrect or fabricated outputs produced by a vision-LLM. "occasional VLM hallucinations."
- WindowsAgentArena: A specific OS-level benchmark suite for evaluating agents on Windows applications. "OS-level benchmarks such as OSWorld and WindowsAgentArena"
- OSWorld: A benchmark for evaluating agent performance across diverse OS-level tasks and applications. "OS-level benchmarks such as OSWorld and WindowsAgentArena"
Collections
Sign up for free to add this paper to one or more collections.

