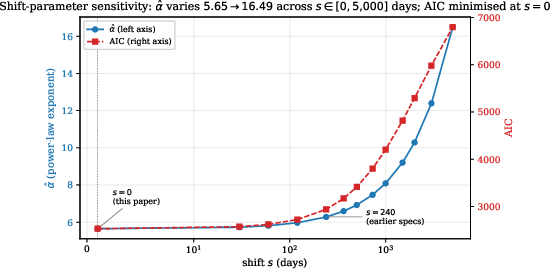
- The paper finds that the conventional power-law model for Bitcoin's price is highly sensitive to time origin shifts, questioning its invariant structural interpretation.
- Methodologically, it compares distributional tests, residual bootstrapping, and multi-component sigmoid fits to reveal superior long-horizon forecasting performance for the simpler power law.
- The study demonstrates that Bitcoin's price exhibits a distinctive multi-wave structure with significant cross-asset differences and leads on-chain adoption metrics.
Bitcoin’s Power Law: A Specification-Robustness and Predictive Utility Analysis
Introduction and Motivation
The empirical observation that Bitcoin’s US-dollar price trajectory from 2010 to 2026 is well-approximated by a power-law relationship P∼tβ (with exponent β≈5.7) has attracted substantial interest in both academic and practitioner domains. On log-log axes, the daily price profile appears as a quasi-linear trend across nearly six orders of magnitude, yielding high R2 in OLS regressions and motivating mechanistic rationales rooted in network adoption and Metcalfe-like scaling.
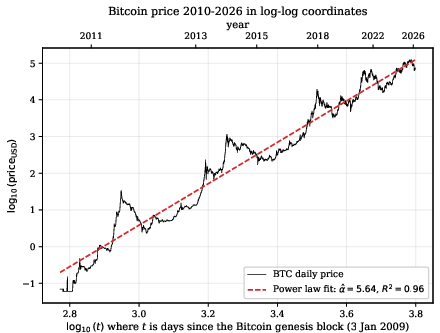
Figure 1: Bitcoin’s daily closing price, 2010–2026, on log-log axes; the power-law fit (dashed red, α^=5.64) yields R2=0.96.
However, prior statistical examination of such power-law claims, especially in complex systems, underscore that apparent linearity on log-log scales is neither necessary nor sufficient for demonstrating genuine scale-free structure. The core objective of this paper is to rigorously evaluate the statistical robustness and predictive value of the power-law hypothesis for Bitcoin’s price evolution, employing both distributional and time-domain methodologies, cross-asset comparisons, and careful out-of-sample forecasting analysis (2605.21316).
Distributional Versus Time-Domain Power Laws
Distributional Tests Using the Clauset–Shalizi–Newman (CSN) Protocol
Application of CSN’s four-step protocol to two relevant Bitcoin series — UTXO balance cross-sections and the distribution of daily ∣returns∣ — yields decisive rejections of the power-law hypothesis. Across seven yearly UTXO snapshots and four periods of daily returns, eight of eleven tests (bootstrap goodness-of-fit with B=200) reject the power law at p<0.05, with lognormal forms substantially preferred by Vuong likelihood-ratio comparisons.
The two instances in which the test fails to reject the power law are direct consequences of sample size limitations in the extreme tails (truncation artifacts rather than statistical support). Thus, for distributional aspects of Bitcoin, lognormal models are consistently superior, congruent with established critiques in the empirical power-law literature.
Time-Domain Power Laws: Specification Sensitivity and Model Indistinguishability
The time-domain claim that P∼tβ is fundamentally a regression statement rather than a distributional tail-law. The authors adapt CSN logic to this setting through: (i) shift-sensitivity analysis (variation of fit with the choice of time origin), (ii) residual diagnostic bootstrapping, and (iii) Vuong tests against alternative functional forms.
Key findings:
Cross-Asset Model Comparison and Structural Wave Detection
To discern whether Bitcoin’s apparent deviation from simple functional forms is idiosyncratic, the paper examines eight additional series: five Bitcoin on-chain metrics, NASDAQ, S&P 500, and gold.
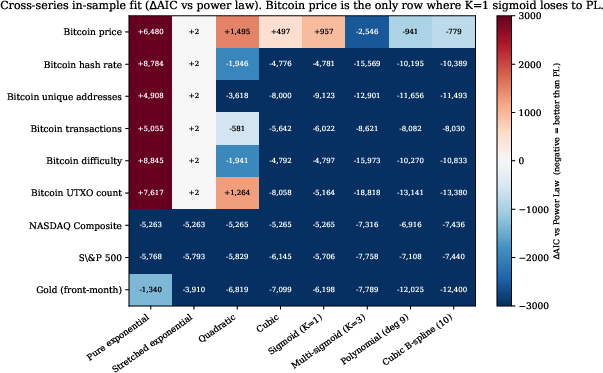
Figure 3: Cross-series in-sample AIC deltas of various functional fits relative to power law. Only Bitcoin price exhibits no single-component model (e.g., K=1 sigmoid, pure exponential) that improves on power law.
- For all non-price series, a single-component model (sigmoid or exponential) surpasses the power law in AIC. Only for Bitcoin price does multi-component structure decisively dominate.
- The K=3 wave-stability bootstrap procedure is introduced to statistically test for persistent (across rolling windows) sigmoid components in K=3 fits, using a PL+AR(1) noise null model.
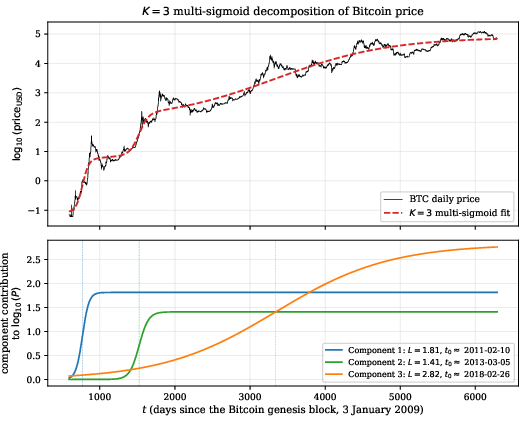
Figure 4: Top—Bitcoin price and K=3 multi-sigmoid fit. Bottom—decomposed sigmoid components. Inflection dates demarcate the onset of each adoption “wave.”
- At quarterly resolution (2016Q1–2026Q1, R22), Bitcoin price consistently yields two stable (low-CV amplitude) sigmoid components, rejecting the PL+AR(1) null at R23 and R24 (Figure 5).
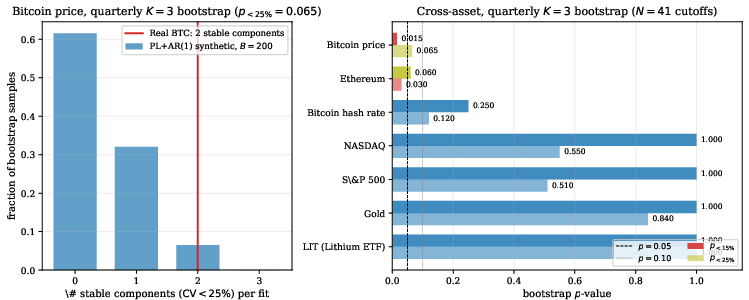
Figure 5: Distribution of stable K=3 components under PL+AR(1) null (blue), with real Bitcoin (red) marking the tail outcome. Bitcoin exhibits statistically significant component stability.
- This rejection is unique to Bitcoin price across the asset comparison group; Ethereum is the only other series with marginal signal, but not significant at conventional levels.
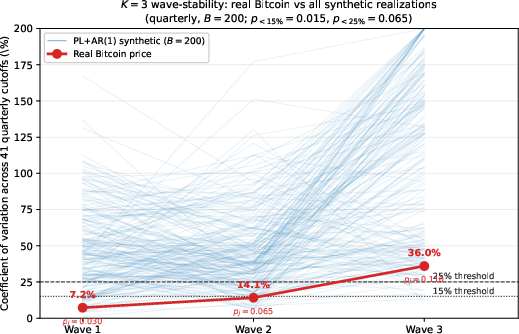
Figure 6: Parallel coordinates of per-wave amplitude CVs for synthetic nulls (blue) versus real Bitcoin price (red). Real Bitcoin amplitude stabilities are outliers in the null distribution.
Direction of Causality Between Price and Adoption Metrics
Using Granger causality and cross-correlation functions (on stationary, first-differenced log series), the paper establishes that price changes systematically precede corresponding changes in all five tested on-chain adoption metrics — with typical lead times of 2–8 weeks. The effect is consistent, though of moderate size (F-statistic asymmetry ratios R25), and not reversed in any window.
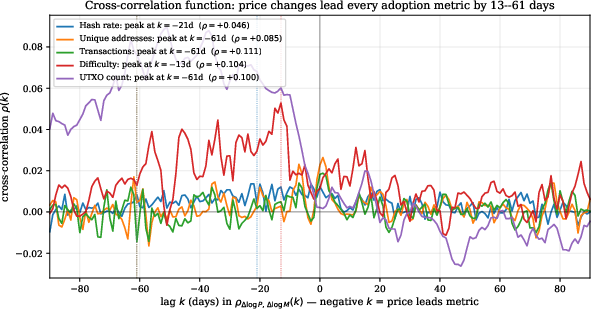
Figure 7: Cross-correlation functions between dlog(price) and dlog(on-chain metrics) for lags ±90 days. Peaks at negative lags show price leads adoption metrics.
Out-of-Sample Forecasting: Long-Run Utility of Power Law
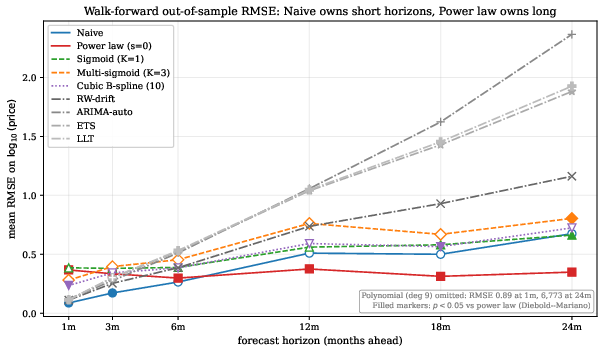
The practical relevance of structural detection is evaluated via walk-forward forecasting, comparing the power law, K=3 and K=1 sigmoid models, flexible polynomials/splines, naïve (no skill), and four standard time-series baselines (RW-drift, auto-ARIMA, ETS, local-linear trend) over 11 yearly cutoffs and horizons from 1 to 24 months.
Implications, Theoretical Discussion, and Forward Directions
This work rigorously demonstrates that while a power-law envelope characterizes the long-run average slope of the Bitcoin price trajectory, such a relationship is not specification-robust (the exponent is highly origin-dependent) and is not structurally unique (multi-component sigmoid models with equivalent flexibility fit as well or better in-sample and are indistinguishable by standard diagnostics).
However, cross-asset and wave-stability bootstraps robustly indicate that Bitcoin price possesses distinctive multi-component “wave” structure—uniquely persistent compared to all benchmark metrics/assets tested, and not explainable by PL+AR(1) noise. Nonetheless, the forecast utility of such multi-wave description is limited: point forecasts at horizons relevant for valuation/portfolio allocation (1–2 years) are best grounded in simple power-law extrapolation, as models that attempt to fit individual waves lack predictive value due to their inability to anticipate future regime transitions.
Practically, this study provides a horizon-dependent prescription: use naïve methods for R29 months, switch to power law for α^=5.640 months, and avoid flexible over-fitters for long-run forecasting. The results also clarify that mechanistic or speculative narratives (e.g., Metcalfe-derived exponentials, network models) must account for both the empirical multi-wave structure and the predictive irrelevance of highly flexible fits.
Work remains in developing envelope-based structural models that combine descriptive fidelity with out-of-sample stability; the present negative-control bootstraps and formal Bonferroni correction across assets leave open avenues for further theoretical and empirical reinforcement.
Conclusion
This research establishes that claims of a power-law generative mechanism for Bitcoin price evolution are not supported by rigorous statistical evidence: the exponent is specification-dependent rather than invariant, and standard tests fail to distinguish true power-law relationships from plausible multi-component alternatives. Yet, in terms of long-horizon predictive performance, the power law is pragmatically superior due to its effective averaging across cycles—solidifying its use as a baseline for valuation projections, conditional on continued environment (multi-wave) persistence. The framework, cross-series methodology, and bootstrapped testing implemented here present a robust template for specification testing in other high-dynamic-range financial and social systems (2605.21316).