Revealing NVIDIA Closed-Source Driver Command Streams for CPU-GPU Runtime Behavior Insight
Abstract: For NVIDIA GPUs, CUDA is the primary interface through which applications orchestrate GPU execution, yet much of the logic that realizes CUDA operations resides in NVIDIA's closed-source userspace driver. As a result, the translation from high-level CUDA APIs to low-level hardware commands remains opaque, limiting both software understanding and performance attribution. This paper makes that command path visible. We recover the hardware command streams emitted by NVIDIA's closed-source userspace driver with full integrity by leveraging the recently open-sourced kernel driver, instrumenting the memory-mapping path, and installing a hardware watchpoint on the userspace mapping of the GPU doorbell register. This lets us capture complete command submissions at the moment they are committed. Using this methodology, we present two case studies. For CUDA data movement, we identify the DMA submission modes selected by the driver and characterize their raw hardware performance independently of driver overhead through CUDA-bypassing controlled command issuance. For CUDA Graphs, we show that the reduced launch overhead in newer CUDA releases is associated with a smaller command footprint and a more efficient submission pattern. Together, these results show that command-level visibility provides a practical basis for understanding and optimizing GPU middleware behavior, improving performance interpretation, and informing future hardware--software co-design for CUDA and related accelerator stacks.
Paper Prompts
Sign up for free to create and run prompts on this paper using GPT-5.
Top Community Prompts
Explain it Like I'm 14
Explaining “Revealing NVIDIA Closed-Source Driver Command Streams for CPU–GPU Runtime Behavior Insight”
What is this paper about?
This paper is about peeking behind the curtain of how a computer tells an NVIDIA graphics card (GPU) what to do. People usually write programs using CUDA (NVIDIA’s tools for GPUs), but a lot of the “translation” from CUDA requests to actual hardware instructions happens inside NVIDIA’s closed (secret) software. Because it’s closed, it’s hard to know what’s really going on—and that makes it harder to understand or improve performance.
The authors found a safe, clever way to “listen in” on the exact instructions the driver sends to the GPU. Then they used this to explain why certain features are fast (or slow), and how newer versions of CUDA improved.
What questions were they trying to answer?
The authors focused on two simple questions:
- How exactly do high-level CUDA actions (like copying data or launching kernels) turn into the low-level commands that the GPU actually runs?
- Can we separate pure hardware speed from extra software overhead, so we know what’s slowing things down?
How did they do it? (In simple terms)
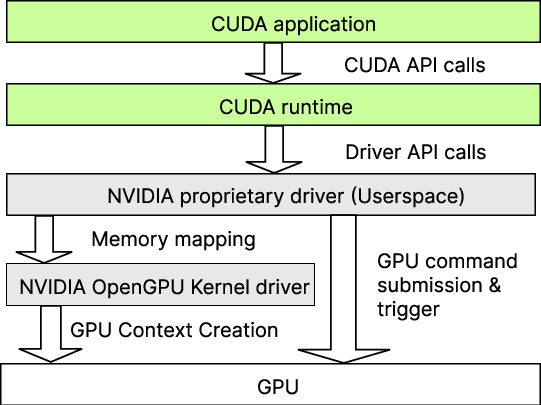
Think of the CPU as a manager and the GPU as a team of workers. CUDA is the way the manager gives jobs to the team. Inside the driver, the manager’s instructions are turned into a “to‑do list” for the GPU. Here’s the key pathway, explained with analogies:
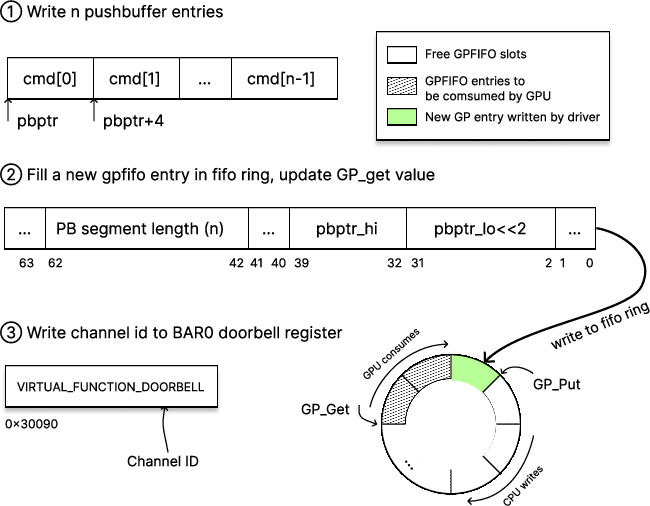
- The “to‑do list” (called a pushbuffer) is where detailed instructions go.
- A “queue” (called GPFIFO) points the GPU to the right part of that to‑do list.
- When the list is ready, the CPU “rings a doorbell” (writes to a special register) to tell the GPU, “new work is ready!”
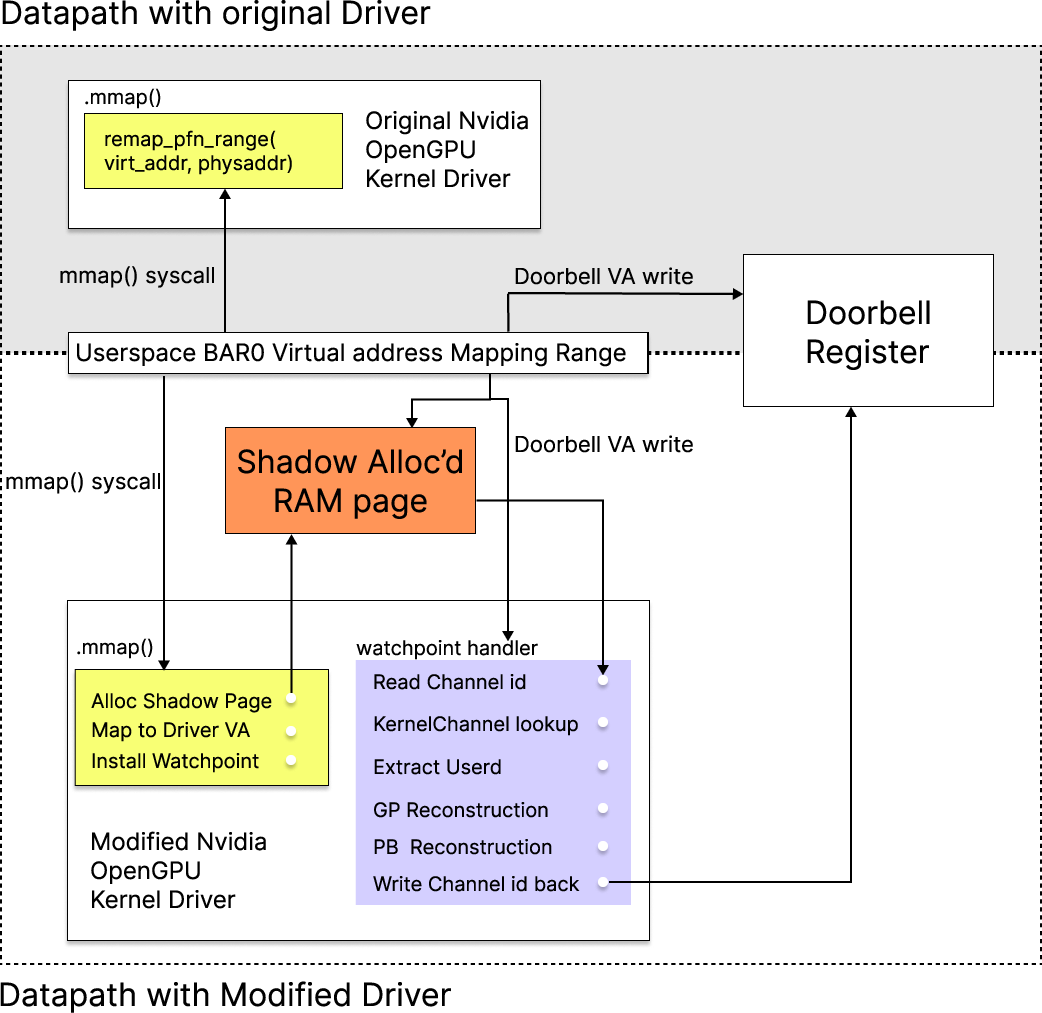
The tricky part: because the userspace driver is closed-source, we can’t see the to‑do list being sent. The authors used a newly open-sourced part (the kernel driver) to set a “watchpoint”—like putting a tiny motion sensor on the doorbell. When the doorbell is pressed, the system briefly pauses and takes a snapshot of the to‑do list and queue at that exact moment. Then it lets things continue normally.
Two extra smart moves made this work well:
- A “shadow doorbell”: since the real doorbell doesn’t let you read back what was written, they first capture the doorbell value in a safe memory page, observe everything, and then pass it along to the GPU.
- Address matching with Unified Virtual Memory (UVM): because CPU and GPU can share address space, the authors could map the captured commands back to user memory. That let them not only read the commands but also craft their own custom commands to test the hardware directly—like giving the GPU a clean, precisely measured task without the usual software detours.
What did they find, and why does it matter?
1) Data copying (cudaMemcpy) uses two different paths
When you copy data from the host (CPU) to the device (GPU), the driver picks between two “delivery methods” depending on the size:
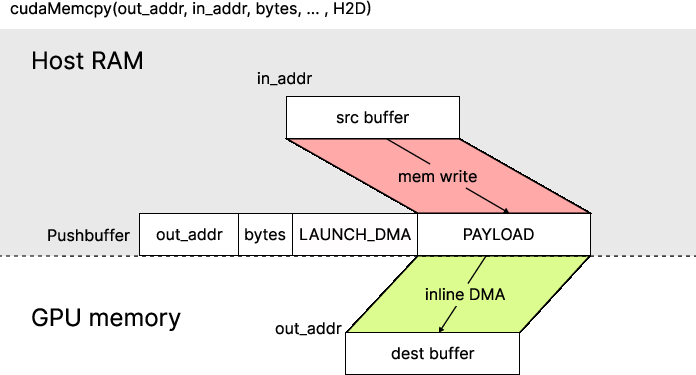
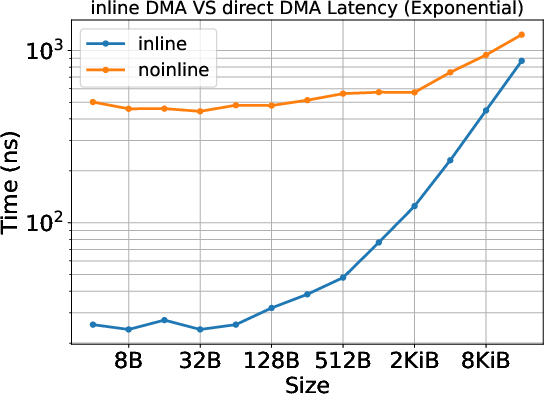
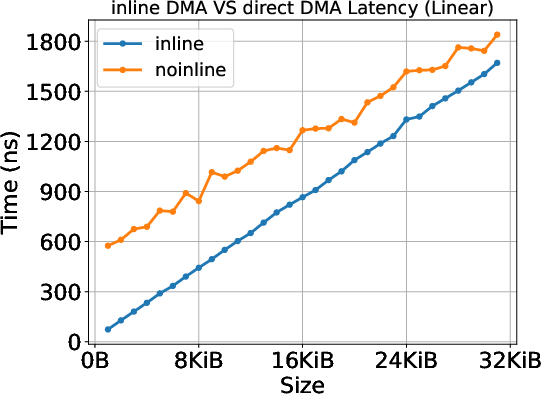
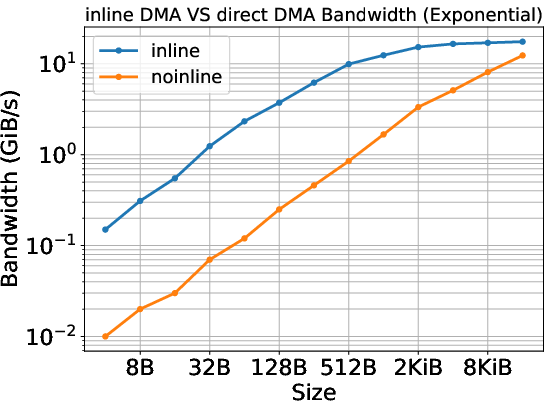
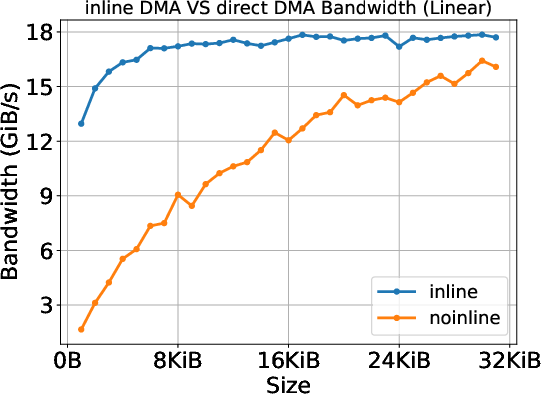
- Inline copy (for small data): The data is stuffed directly into the to‑do list itself. Think of slipping a tiny note into the task list. This has a super-fast start-up time, but it doesn’t reach very high top speed (bandwidth).
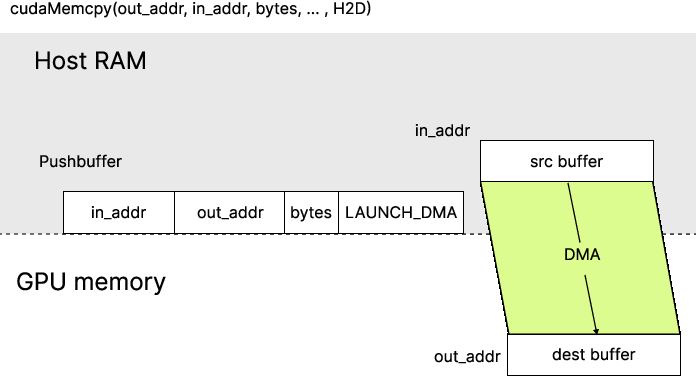
- Direct DMA copy (for larger data): The to‑do list just points to where data is and where it should go, and a dedicated “copy engine” (like a delivery truck) moves it. This starts slower but reaches higher top speeds for big transfers.
Why this matters:
- Small transfers can feel snappy (low delay), but don’t move lots of data quickly.
- Big transfers take a moment to get going but achieve higher sustained speed.
- Developers often measure performance using CUDA timers or tools like Nsight, which include extra software overhead. The authors’ method isolates the pure hardware time by using GPU-side timestamps—so you can see what the hardware can really do.
Big takeaway: If you only look at runtime-level numbers, you might blame the hardware for time that’s actually spent in software. Their method helps separate the two.
2) CUDA Graphs got much more efficient from CUDA 11.8 to 13.0
CUDA Graphs let you record a sequence of GPU tasks (like many repeated kernels) and launch them together. That reduces repetitive launch overhead when you run the same pattern over and over.
The authors compared CUDA 11.8 and CUDA 13.0 and found:
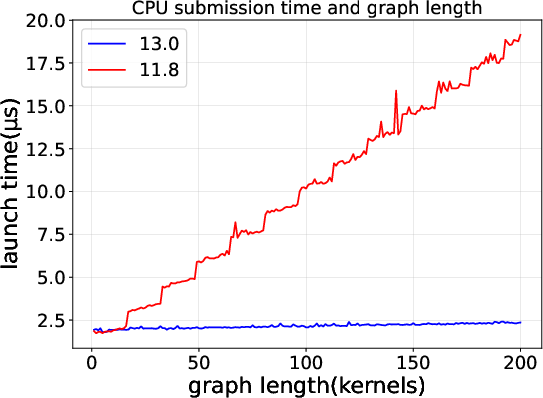
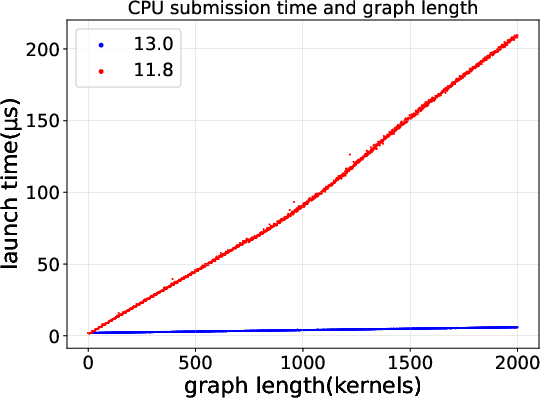
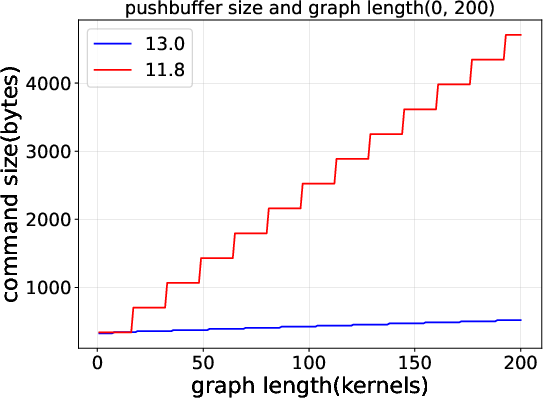
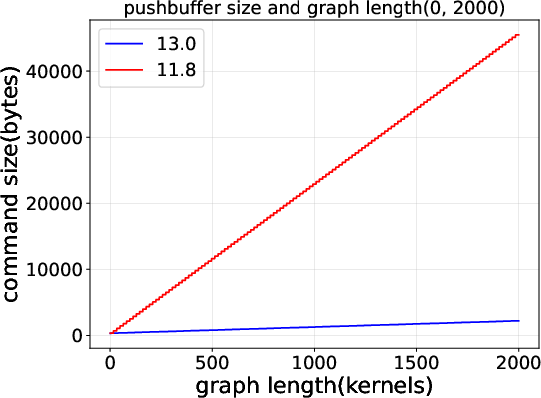
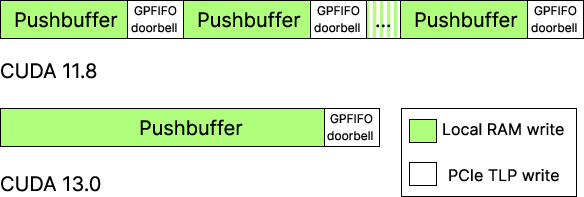
- CUDA 13.0 sends a much smaller set of commands for each graph launch.
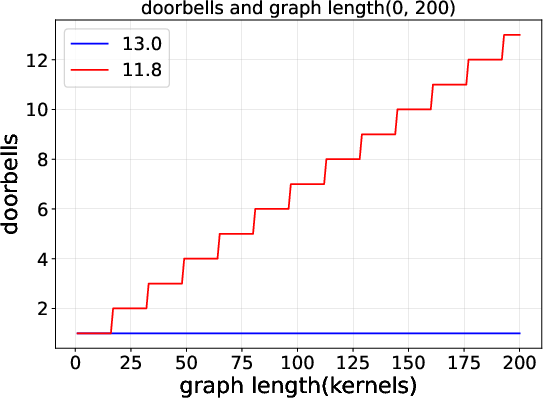
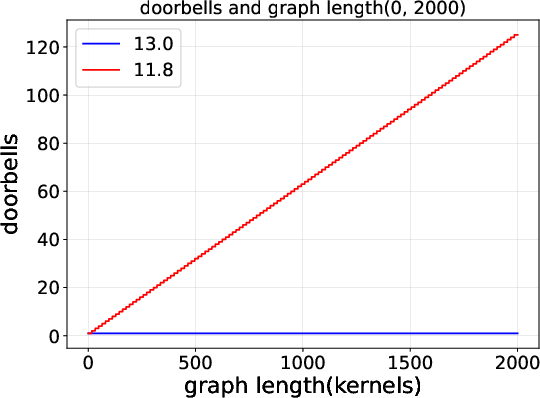
- CUDA 13.0 rings the “doorbell” fewer times (fewer submission cycles).
- As a result, the time the CPU spends launching a graph grows very slowly (almost flat) even when the graph gets bigger. In 11.8, launch time grows linearly (more kernels → more time).
Why this matters:
- If you run the same multi-kernel sequence many times (like in AI training loops), the newer CUDA version saves you a lot of CPU overhead.
- The command-level view shows that these gains come from fewer, more efficient submissions—not just “magic” speedups.
Why is this important overall?
- Clearer performance understanding: By seeing the exact commands, we can tell how much time is spent in hardware vs. software.
- Better optimization: Developers and researchers can spot bottlenecks and choose the right approach (e.g., use Graphs, adjust transfer sizes).
- Informed design: Hardware and driver teams can use this kind of visibility to co-design features that reduce overhead and improve real-world speed.
- Broader impact: This approach can be applied to more CUDA features beyond the two case studies and can help the community improve GPU software stacks—even if some parts remain closed-source.
Final summary
The authors built a simple but powerful window into NVIDIA’s closed userspace driver by “listening for the doorbell.” That let them capture the GPU’s real command stream, understand how CUDA requests are translated, issue their own clean tests, and measure hardware performance directly. With this visibility, they showed why data copies behave differently at small vs. large sizes, and how CUDA Graphs got significantly more efficient in newer releases. This kind of insight helps everyone—from app developers to hardware designers—make GPUs faster and more predictable in practice.
Knowledge Gaps
Knowledge gaps, limitations, and open questions
Below is a consolidated list of what remains missing, uncertain, or unexplored in the paper, phrased to enable concrete follow-on research.
- Cross-architecture generality: Validate the interception and reconstruction method on other NVIDIA generations (Pascal, Turing, Volta, Hopper/Blackwell) and confirm whether command formats, doorbell semantics, and USERD/RAMFC layouts remain compatible.
- OS and driver ecosystem coverage: Assess applicability under Windows/WDDM and different Linux kernels (e.g., mainline vs. vendor kernels), including stability without the custom kernel patches (e.g., exported sched_task_fork).
- Virtualization and multi-tenant modes: Evaluate correctness and feasibility under MIG, vGPU/SR-IOV, and cloud hypervisors, where doorbell mappings, BAR access, and channel isolation may differ or be restricted.
- Confidential computing and security modes: Determine whether CC-On or similar protections block doorbell interception, GPU MMU page-table walks, or mapping of USERD/RAMFC, and how to instrument safely within those constraints.
- Multi-GPU, peer-to-peer, and NVLink environments: Extend the approach to P2P transfers, NVLink/NVSwitch fabrics, and multi-GPU submission ordering to see if doorbell interception is sufficient for reconstructing cross-device interactions.
- Robustness of doorbell interception: Quantify edge cases where the userspace driver might post multiple GPFIFO entries before a single doorbell ring; define how to recover the full batch (range from prior GP_PUT to current GP_PUT) rather than just the last entry.
- Completeness under high concurrency: Analyze correctness for multiple channels/processes issuing doorbells concurrently (e.g., race conditions, coalesced MMIO writes), and whether the single watchpoint reliably captures all submissions without loss.
- Scalability of watchpoint-based tracing: Measure the overhead and missed-event rate when submissions occur at very high frequency, and explore the hardware limit of available debug registers for many simultaneous processes.
- Perturbation/Heisenberg effect: Quantify the timing and behavioral perturbation introduced by pausing the userspace driver on each doorbell (e.g., command reordering, increased latency, GPU watchdog/TDR risks).
- Memory ordering and coherence: Establish whether reading pushbuffer/GPFIFO content immediately after trapping guarantees memory visibility (e.g., WC buffers flushed, CPU cache coherence), and specify required barriers/fences for correctness.
- UVM dependence and portability: The reconstruction relies on unified CPU/GPU virtual addresses; evaluate behavior when UVM is disabled, in non-UVM allocations, with IOMMUs, or under alternate memory paths (pinned/pageable, GPUDirect RDMA/P2P).
- Coverage of device-initiated work: Determine whether the method captures GPU-initiated launches (e.g., CUDA Dynamic Parallelism) and other device-side command emission paths that may not involve a host doorbell write.
- Command decoding breadth: Many method classes/fields remain undocumented; specify current decoding coverage (engines, classes, opcodes) and provide a roadmap for unknown fields to avoid misinterpretation across driver updates.
- Reliability of shadow doorbell approach: Evaluate the generality and future-proofing of the “shadow doorbell page” workaround across driver versions and devices, and document failure modes (e.g., if the register becomes readable or changes behavior).
- Handling GPFIFO wraparound and overflow: Detail how the reconstruction handles ring buffer wrap, overrun, and backpressure, especially when multiple entries are enqueued before a trap, or when GP_GET write-back lags.
- Case-study scope limitations (data movement): Only host-to-device direction and limited size ranges are shown; extend to device-to-host, device-to-device, larger transfers, alignment effects, page sizes (4K vs. large pages), and TLB/IOMMU/ATS impacts.
- Copy-engine diversity and scheduling: Characterize behavior with multiple copy engines, engine arbitration, and engine affinity policies across sizes and concurrency levels.
- Inline DMA limits and staging mechanism: The compute engine’s inline DMA cap (~31 KiB) is observed but not explained; determine the exact hardware/driver thresholds and the cost of CPU-side staging into pushbuffers.
- Pushbuffer/GPFIFO placement effects: Finding 2 notes asymmetric placement (GPFIFO in VRAM, PB in host RAM), but performance implications (e.g., host memory type: WC/UC, NUMA, cache behavior) are not quantified or compared to alternative placements.
- Cross-tool timing reconciliation: The gap between raw engine timestamps and Nsight “CUDA HW” timings is documented but not attributed; decompose Nsight’s interval components and validate against low-level markers for precise attribution.
- GPU timestamp calibration: GPU-provided nanosecond timestamps are used without cross-calibration to the CPU clock; define procedures to align timelines and validate stability across power states and clock domain changes.
- CUDA Graphs generality: Only linear chains of identical kernels are studied; evaluate graphs with parallel branches, mixed node types (kernels, memcpys, events), graph updates, capture vs. explicit construction, and node parameter changes.
- Mechanistic understanding of Graph improvements: The reduced launch overhead in CUDA 13.0 is attributed to smaller command footprints and fewer doorbells, but the specific driver mechanisms (e.g., persistent descriptors, batching policies) are not identified.
- Tooling availability and reproducibility: The paper does not state whether the modified kernel modules and parsers are open-sourced; without them, replicability and community validation remain limited.
- Safety and isolation of custom command injection: Directly programming engines bypasses runtime invariants; define guardrails to prevent channel corruption, MMU faults, or interference with driver-managed state in multi-tenant settings.
Practical Applications
Immediate Applications
Below are actionable, deployable uses that can be implemented today using the paper’s methods and findings or that leverage the insights they reveal.
- GPU command-stream observability toolkit: Deploy the paper’s watchpoint-based interception to capture, reconstruct, and parse NVIDIA command streams in situ, enabling end-to-end visibility from CUDA API calls to hardware commands for debugging and performance attribution (sectors: software tooling, HPC/AI, cloud).
- Tools/Products/Workflows: Patched OpenGPU kernel module with doorbell shadowing; command decoder and log pipeline; per-workload command-stream snapshots for regression/perf triage; integration hooks for CI.
- Assumptions/Dependencies: Root access; NVIDIA open-source kernel driver present; kernel patchability (e.g., Linux 5.14 in paper); specific GPU families (tested on Ampere A40); UVM enabled; method robustness may vary across driver versions/EULAs.
- Engine-only DMA benchmarking and calibration: Use custom pushbuffer/GPFIFO injection with semaphore timestamps to measure raw compute-engine inline DMA vs copy-engine direct DMA without runtime overheads, calibrating latency/bandwidth and PCIe behavior for a given platform (sectors: HPC/AI, hardware bring-up, procurement).
- Tools/Products/Workflows: Microbenchmark suite generating single-shot command segments with warmup + test phases; automated plots of engine-only latency vs Nsight-reported latency to quantify overheads.
- Assumptions/Dependencies: Access to command injection path; stable command encodings per GPU; correct semaphore timestamp configuration; results are model-/driver-specific.
- Transfer-size tuning and data pipeline optimization: Operationalize the observed mode switch (~24 KiB in the paper’s setup) to choose chunk sizes that exploit low-latency inline DMA for tiny payloads and higher-throughput copy engine for larger transfers, improving end-to-end data-movement efficiency (sectors: AI/ML training & inference, scientific workflows, media processing).
- Tools/Products/Workflows: Dataloader/file-streaming policies that coalesce/split transfers around measured thresholds; staging buffers sized to saturate the copy engine; stream-level overlap strategies (compute vs copy) aligned to observed saturation points.
- Assumptions/Dependencies: Thresholds are hardware-, interconnect-, and driver-version-dependent; may change across CUDA releases; must be validated per deployment.
- CUDA Graph adoption and launch-cost reduction playbook: Migrate to CUDA 13.0+ to benefit from reduced command footprint and fewer doorbell writes during cudaGraphLaunch, yielding near-constant launch time versus linear growth in CUDA 11.8 (sectors: AI frameworks, HPC simulation, real-time robotics).
- Tools/Products/Workflows: Use cudaGraphUpload + repeated cudaGraphLaunch; refactor repetitive loops into chain-structured graphs; verify lowered command sizes and doorbell counts with the observability toolkit.
- Assumptions/Dependencies: GPUs and drivers supporting CUDA 13.0+; correctness of graph refactoring; benefits depend on graph structure and node count.
- Profiler augmentation with “engine-only” metrics: Pair Nsight (or other profilers) with semaphore-based timing to expose the delta between raw engine time and profiler “CUDA HW” intervals, improving attribution to driver/runtime overhead vs hardware execution (sectors: software tooling, performance engineering).
- Tools/Products/Workflows: A sidecar profiler or plugin that reads device-side timestamps and reports “engine-only latency,” “submission overhead,” and “staging cost” metrics.
- Assumptions/Dependencies: Stable access to timestamped semaphores; profiler integration constraints; potential measurement perturbation must be managed.
- GPU middleware SRE diagnostics for small-message regimes: Use doorbell and command-volume telemetry to diagnose cases where software-side submission dominates (e.g., in disaggregated or virtualized systems), guiding mitigations like batching, graphification, or topology-aware tuning (sectors: cloud, data centers, HPC ops).
- Tools/Products/Workflows: Per-job dashboards of doorbell rate, pushbuffer size, and GP_PUT/GET dynamics; runbooks to reduce submission cycles and increase coalescing.
- Assumptions/Dependencies: Operational acceptance of kernel instrumentation; overhead must be controlled; per-tenant observability policies in shared environments.
- Security triage and GPU forensics: Baseline expected command patterns (e.g., cudaMemcpy signatures, graph submission shapes) and flag deviations indicative of abuse or stealth computation on the GPU (sectors: security operations, incident response).
- Tools/Products/Workflows: Command pattern miners; whitelists for benign workloads; anomaly detectors on GPFIFO/doorbell activity.
- Assumptions/Dependencies: Legal and policy clearance; low-overhead monitoring; attacker countermeasures could obfuscate patterns.
- Education and training modules: Build hands-on labs demonstrating pushbuffer/GPFIFO mechanics, doorbell triggering, and semaphore timing for OS, compilers, and systems courses (sectors: academia, workforce development).
- Tools/Products/Workflows: Reproducible lab scripts using the modified kernel module; annotated traces mapping CUDA APIs to decoded commands; exercises on performance attribution.
- Assumptions/Dependencies: Access to supported GPUs; lab safety guidance; version-pinning of drivers/toolchains.
Long-Term Applications
These use cases require further R&D, scaling, vendor cooperation, or standardization before broad deployment.
- Vendor-supported command-stream telemetry API: A standardized, read-only, low-overhead interface to mirror or summarize command streams, doorbell events, and semaphore timestamps for observability without kernel patching (sectors: industry standards, software tooling, cloud).
- Tools/Products/Workflows: “Shadow doorbell” hardware/firmware path; driver-validated metadata channel; per-context telemetry with access control.
- Assumptions/Dependencies: Vendor buy-in; security and IP protection; ABI stability across generations.
- Cross-vendor “engine-only” performance counters in profilers: First-class metrics in Nsight/VTune/ROC-prof to distinguish device execution from submission overhead, harmonized across GPU vendors (sectors: software tooling, procurement benchmarks).
- Tools/Products/Workflows: Profiler APIs to read device-resident timestamps tied to completion semaphores; standardized semantics for “engine-only time.”
- Assumptions/Dependencies: Agreement on definitions; hardware support for precise, low-jitter timestamps.
- Adaptive runtime transfer-mode selection: Make cudaMemcpy-like operations dynamically choose inline vs direct DMA thresholds based on size, link utilization, NUMA/fabric topology, and contention, rather than static heuristics (sectors: CUDA/HIP/SYCL runtimes, AI frameworks).
- Tools/Products/Workflows: Telemetry-informed heuristics; per-link performance models; runtime autotuning on first-run calibration.
- Assumptions/Dependencies: Access to link metrics; stability and predictability across workloads; must avoid regressions.
- Graph-aware launch compilers and schedulers: Automatically reshape graphs to minimize doorbell writes and pushbuffer size (e.g., coalescing nodes, reordering independent ops), while preserving dependencies and performance (sectors: AI compilers and runtimes, HPC workflow engines).
- Tools/Products/Workflows: IR passes in PyTorch/XLA/TVM/JAX; static cost models fed by command-stream analytics; correctness validation with device-side timing.
- Assumptions/Dependencies: Accurate, portable cost models; driver behavior stability; vendor documentation or learned models.
- Hypervisor-level GPU observability for multi-tenant cloud: Safe, virtualized export of per-VM submission metadata for QoS, billing, and security without exposing proprietary details (sectors: cloud providers, confidential computing).
- Tools/Products/Workflows: Mediated pass-through with telemetry hooks; per-tenant rate limiting on doorbells; anomaly detection at the hypervisor.
- Assumptions/Dependencies: Isolation guarantees; performance overhead budgets; alignment with confidential-computing threat models.
- Hardware–software co-design for submission efficiency: New PBDMA features for on-device command compression, batching-friendly doorbell semantics, or queue-level telemetry, reducing CPU work and PCIe traffic (sectors: GPU architecture, systems vendors).
- Tools/Products/Workflows: Compressed pushbuffer formats; scatter–gather PB support; hardware counters for submission-path breakdowns; firmware-assisted graph playback.
- Assumptions/Dependencies: Silicon changes; driver/compiler support; rigorous performance validation.
- GPU EDR and SIEM integrations: Enterprise-grade endpoint detection and response for accelerators using command-stream baselining and drift analytics to surface covert compute or data exfiltration patterns (sectors: enterprise security).
- Tools/Products/Workflows: Sensors with minimal performance impact; model training on benign workloads; SIEM connectors with GPU-aware alerts.
- Assumptions/Dependencies: Operational acceptance; clear signal vs noise; evolving attacker TTPs.
- Standardized CPU–GPU middleware benchmarks for procurement and policy: Benchmarks separating hardware engine performance from driver/runtime overhead, incorporated into RFPs and compliance (sectors: public sector, enterprise IT governance).
- Tools/Products/Workflows: Open benchmark suite producing split metrics (engine-only vs end-to-end); reference traces; reporting templates.
- Assumptions/Dependencies: Neutral governance; reproducibility across platforms; vendor participation.
- Disaggregated accelerator tuning over CXL/fabrics: Use engine-only telemetry and doorbell/command-size shaping to minimize fabric overheads and tail latency in rack-scale GPU/CPU disaggregation (sectors: hyperscale, telecom, HPC).
- Tools/Products/Workflows: Fabric-aware submission pacing; coalescing policies guided by topology; end-to-end models including switch/retimer behavior.
- Assumptions/Dependencies: Maturity of CXL/NVLink fabrics; fabric telemetry access; coordination with NIC/DPUs.
- Automated performance regressions in CI/CD for ML/HPC: Integrate command-stream and engine-only metrics in CI to catch runtime/driver changes that inflate submission overhead or alter DMA mode thresholds (sectors: software engineering, MLOps).
- Tools/Products/Workflows: Golden traces; delta-based alerting on doorbell counts and PB sizes; auto-bisect of driver/toolkit versions.
- Assumptions/Dependencies: Stable lab hardware; noise control; process adoption.
Notes on feasibility and scope across all applications:
- The methodology relies on NVIDIA’s open-source kernel driver and specific kernel capabilities (e.g., hardware watchpoints); portability to other OSes/hypervisors requires engineering.
- Observed thresholds and command formats are GPU- and driver-version-specific and may shift; any automation should recalibrate per deployment.
- Instrumentation introduces overhead and operational risk; production deployments should prefer vendor-supported telemetry when available.
Glossary
- Ampere: NVIDIA GPU microarchitecture generation used in this study’s hardware and command formats. "Recent advances from CUDA 11.8 to 13.0 for Ampere+ GPUs further reduce graph launch overhead"
- BAR (Base Address Register): A PCIe register set that exposes device memory/registers to the host address space. "maps the GPU's PCIe BAR (Base Address Register) region into its virtual address space"
- BAR0: The primary PCIe BAR region used here for MMIO access to GPU registers. "is accessed via the PCIe BAR0 MMIO range at the VIRTUAL_FUNCTION_DOORBELL offset."
- Channel: A runnable GPU context that encapsulates execution and memory state for command submission. "A runable context is referred to as a Channel."
- compute engine: The GPU engine that executes kernels and, for small transfers, inline copy operations. "On the device side, the compute engine fetches this staged payload and writes it to the destination."
- copy engine: A dedicated GPU engine that performs bulk memory copies independently of compute engines. "the transfer is executed by a dedicated copy engine rather than the compute engine."
- CUDA Graphs: A CUDA mechanism to capture and repeatedly launch a dependency graph of operations with reduced CPU overhead. "For CUDA Graphs, we show that the reduced launch overhead in newer CUDA releases is associated with a smaller command footprint and a more efficient submission pattern."
- cudaGraphLaunch: API that launches an already-uploaded CUDA Graph for execution. "cudaGraphLaunch subsequently triggers execution using that uploaded state."
- cudaGraphUpload: API that uploads reusable execution metadata for a CUDA Graph before launching. "cudaGraphUpload uploads reusable execution metadata for the graph"
- cudaMemcpy: CUDA API for explicit data movement between host and device (or between device regions). "We begin by analyzing cudaMemcpy, a CUDA API that explicitly transfers data between different domains."
- cudaMemcpyAsync: Asynchronous variant of cudaMemcpy that enqueues a copy into a stream. "generated by a cudaMemcpyAsync transferring 64MB."
- debug registers: CPU hardware registers used here to set watchpoints that trap on specific memory accesses. "We configure the CPU debug registers to watch the userspace virtual address mapped to the GPU doorbell"
- direct DMA: Submission mode where the pushbuffer specifies both source and destination addresses for the copy engine. "it follows a direct DMA path."
- DMA (Direct Memory Access): Hardware-supported memory transfer bypassing CPU-mediated copying. "an inline DMA (Direct Memory Access) path."
- DMA engine: GPU hardware unit that performs DMA transfers; measured independently of driver overhead. "decouple raw GPU DMA-engine performance from driver overhead."
- doorbell register: An MMIO register the CPU writes to notify the GPU that new work has been enqueued. "userspace mapping of the GPU doorbell register."
- doorbell write: The act of writing to the doorbell register to trigger GPU consumption of queued commands. "When we intercept a doorbell write, the only information we directly observe is the channel identifier."
- GPU MMU: The GPU’s memory management unit responsible for translating GPU virtual to physical addresses. "we resolve the physical address by walking the GPU MMU pagetable"
- GP_BASE: The base address of the GPFIFO ring buffer for a channel. "obtain the GPFIFO base address GP_BASE from RAMFC."
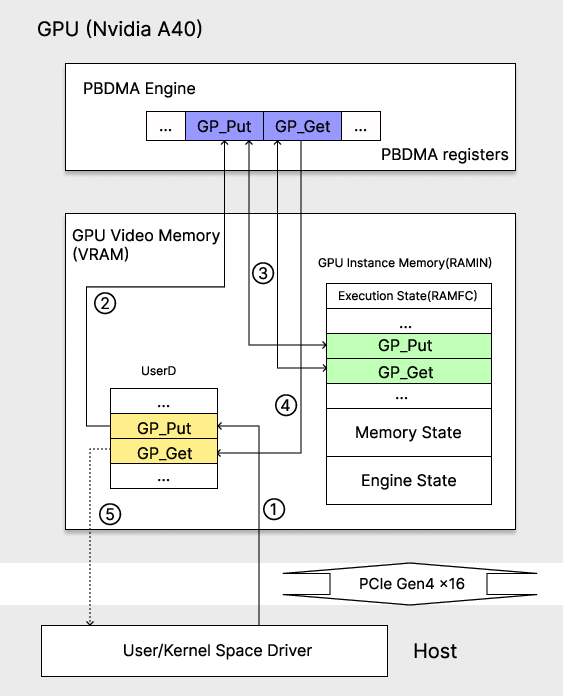
- GP_GET: The consumer index of the GPFIFO indicating how much work the GPU has consumed. "If write-back is enabled, the GPU periodically writes GP_GET (the consumer index) back to USERD."
- GP_PUT: The producer index of the GPFIFO indicating how much work the driver has enqueued. "USERD allows the user-mode driver to update producer index GP_PUT through its virtual address mapping."
- GPFIFO (Get/Put FIFO): A per-channel ring buffer of descriptors pointing to pushbuffer segments for execution. "NVIDIA GPUs employ a two-level command submission hierarchy composed of the GPFIFO (Get/Put FIFO) and the pushbuffer (PB)."
- Heterogeneous Memory Management (HMM): Linux kernel feature that mirrors CPU page tables for accelerators to unify memory management. "Recent integration with Linux HMM~\cite{linux_hmm_doc} (heterogeneous memory management) further extends UVM"
- inline DMA: Submission mode where small transfer data are embedded directly in the pushbuffer and executed by the compute engine. "the driver uses the inline DMA method."
- KernelChannel: Kernel-driver structure holding per-channel memory descriptors and state used for reconstruction. "the KernelChannel structure records memory descriptors for USERD, RAMIN, and RAMFC"
- memory semaphore: A device-side synchronization primitive where engines write a value to memory upon completion. "a hardware primitive referred to a memory semaphore"
- MIG: Multi-Instance GPU, a hardware partitioning feature referenced in related work. "side-channel attacks on MIG through reverse engineering of GPU TLBs~\cite{TunneLs}."
- MMIO (Memory-Mapped IO): Method of accessing device registers by mapping them into the CPU address space. "sampled MMIO (Memory-Mapped IO) execution registers"
- Nsight Systems: NVIDIA’s system-wide profiler that reports runtime-level timings for CUDA operations. "Tools such as Nsight Systems~\cite{nvidia-nsight-systems} report timings at the runtime level"
- PBDMA (pushbuffer DMA): GPU front-end engine that fetches GPFIFO entries and dispatches pushbuffer commands to engines. "the GPU PBDMA (pushbuffer DMA) engine fetches the newly enqueued GPFIFO entry"
- pushbuffer: A linear buffer containing raw GPU command streams referenced by GPFIFO entries. "The pushbuffer holds the raw command stream that is directly consumed by GPU engines."
- RAMFC (FIFO context memory): Privileged per-channel memory holding execution state like GP_GET/GP_PUT during context switches. "The execution state (also known as host state) resides in RAMFC (FIFO context memory)."
- RAMIN (channel instance memory): Persistent per-channel memory storing context metadata managed by the GPU front-end. "The persistent per-channel state is stored in RAMIN (channel instance memory)."
- semaphore release: A command that writes a specified payload to a target address to signal that prior commands have completed. "A semaphore release specifies (i) a target address and (ii) a payload value to be written to that address."
- Unified Virtual Memory (UVM): CUDA mechanism that unifies CPU and GPU virtual address spaces and manages on-demand page migration. "CUDA Unified Virtual Memory (UVM) allows a pointer to be dereferenced by both the host and the device (e.g., within CUDA kernels)."
- USERD: A user-accessible memory region exposing per-channel producer/consumer fields to user-space drivers. "USERD allows the user-mode driver to update producer index GP_PUT through its virtual address mapping."
- VIRTUAL_FUNCTION_DOORBELL: The specific MMIO offset for doorbell writes in the device’s PCIe BAR. "VIRTUAL_FUNCTION_DOORBELL offset."
- watchpoint: A hardware-triggered breakpoint that traps on specified memory accesses, used here to intercept doorbell writes. "we install a hardware watchpoint on the corresponding user-space virtual address"
Collections
Sign up for free to add this paper to one or more collections.

