- The paper introduces the TraceToChain pipeline, which maps LLM agents' execution traces to an absorbing discrete-time Markov chain.
- It employs maximum likelihood estimation, AIC-KS diagnostics, and uncertainty quantification to validate reliability metrics.
- Empirical simulations confirm that analytic and Monte Carlo estimates align within 5%, unifying diverse scalar measures.
Markov Chain Reliability Framework for LLM Agents
Motivation and Problem Statement
This paper proposes a rigorous methodology for auditing the reliability of LLM-based agents operating as sequential software systems using absorbing discrete-time Markov chains (DTMCs) (2604.24579). Current evaluation protocols for LLM agents rely on scalar metrics such as pass@k, passk, and the reliability decay curve (RDC), but these metrics lack explicit semantics about the first-passage distribution, fail to quantify uncertainty, and do not audit the fit against agent execution traces. The research solves this deficit by constructing an explicit and auditable reliability model from empirical agent traces, enabling principled queries about horizon-dependent reliability, perturbation sensitivity, and metric reconciliation.
TraceToChain Pipeline: Core Methodology
The central contribution is the TraceToChain pipeline, which maps execution traces of LLM agents to an absorbing DTMC M^=(Q^,R^⊕,R^⊖), capturing transient execution states, success/failure absorbing states, and step-level transitions. The pipeline proceeds in four stages:
- Trace Featurization and State Construction: Automated clustering of featurized trace steps via Ward linkage and silhouette scoring determines the transient state taxonomy (Figure 1).
- Transition Estimation: Maximum likelihood estimation (Laplace-smoothed) is used for Q^, R^⊕, R^⊖.
- Order Selection and Goodness-of-Fit Testing: A composite AIC-vs-KS protocol audits both Markov order via AIC and empirical/analytic first-passage distributions via KS test. Rejection prompts segmentation or richer modeling.
- Uncertainty Quantification: Posteriors for transition/exits are reported via Dirichlet-Beta conjugacy and bootstrapped trace resampling.
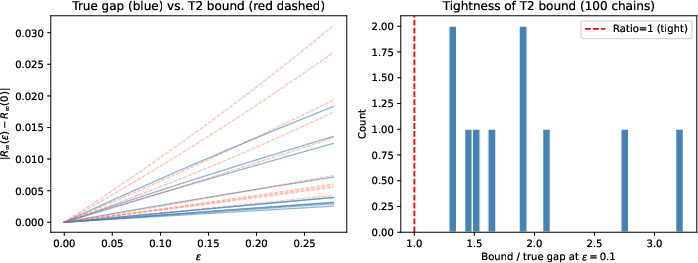
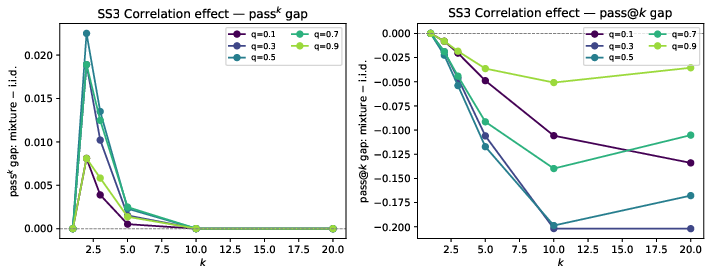
Figure 1: Theorem checks: (a) perturbation bound screening, (b) correlated-trial agreement lift, and (c) passk gap diagnostic.
Reliability is interpreted as a first-passage property on the fitted chain: given a step budget d, R(d)=Pr[τ⊕≤d] quantifies the probability of successful absorption within d steps. Classical results (Kemeny-Snell) yield closed forms for finite-horizon and asymptotic reliability:
passk0
Besides, the approach supports:
- Local perturbation screening: Analytic bounds propagate transition matrix changes (passk1) to reliability deltas, facilitating fast engineering analysis (Figure 3).
- Metric unification: passpassk2, passpassk3, and RDC are shown to be explicit projections of the same first-passage distribution, with formal caveats for correlated trials (Figure 4).
Figure 5: True gap vs. analytic upper bound for perturbation sensitivity, demonstrating the sharpness and utility of the analytic screening approach.
Figure 6: The correlated-trial gap reveals increasing deviation in passpassk4 estimators as latent variation rises, confirming Jensen's diagnostic.
Simulation Validation of Reliability Claims
Comprehensive simulation studies validate both analytic expressions and diagnostic machinery:
- Closed-form Validation: The absorbing-chain reliability formulas agree with Monte Carlo simulation within strict thresholds (Figure 7).
- Goel–Okumoto Limit Recovery: In the rare-failure regime, the fitted chain reduces to the classical NHPP mean-value form, confirming consistency with established reliability-growth models (Figure 8, Figure 9).
- Goodness-of-Fit Safeguard: SS7 demonstrates that the composite AIC-KS protocol robustly separates first-order Markov chains (accepts) from second-order ground truth (rejects), confirming statistical adequacy.
- Held-Out Recovery on Controlled Traces: SS9 applies a strict 50/50 split to MAST-style synthetic traces, recovering empirical RDC to within passk5 and KS passk6 for all frameworks (Figure 10).
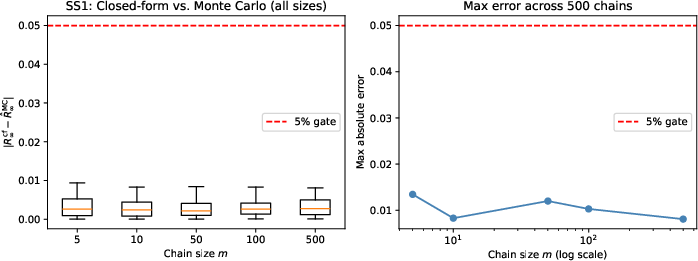
Figure 11: SS1 verifies closed-form analytic reliability against Monte Carlo simulation, with absolute error below 5% across all tested chains.
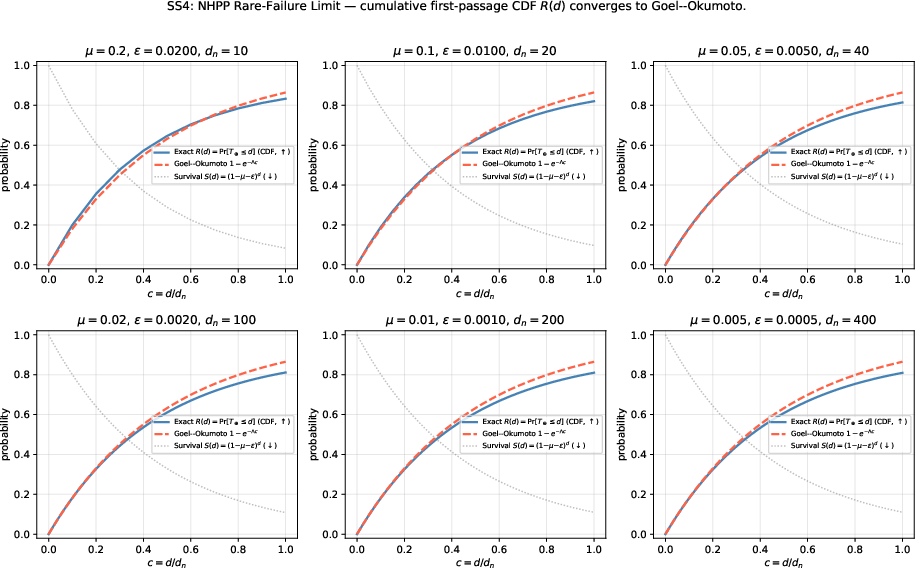
Figure 7: Fitted-chain cumulative first-passage converges to Goel--Okumoto NHPP mean-value form as absorption probabilities decrease.
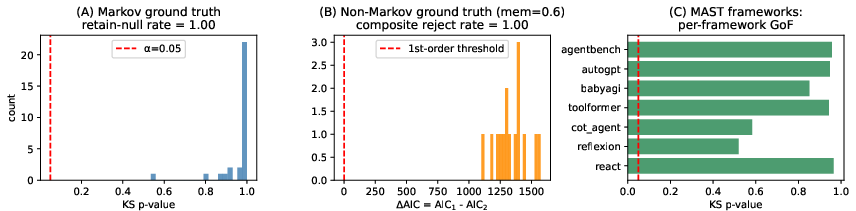
Figure 2: GoF safeguard outcome across Markov ground truth, 2nd-order ground truth, and MAST-derived synthetic corpora.
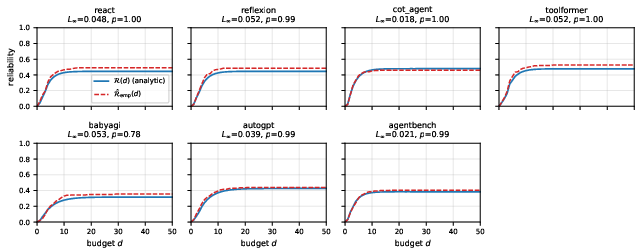
Figure 8: SS9: Empirical RDC overlays analytic RDC showing held-out recovery of first-passage reliability across seven agent frameworks.
Empirical Illustration and Metric Portability
MAST-derived summaries showcase practical utility of the reliability vocabulary, with analytic RDC curves and horizon/protocol-specific reliability for seven frameworks. Cross-benchmark archetypes (SWE-bench, passk7-bench, AgentBench) are synthesized to demonstrate semantic portability and adaptability of the absorbing-chain modeling (Figure 13, Figure 14).
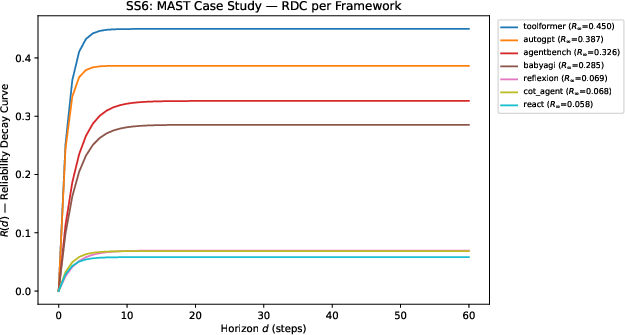
Figure 3: SS6: Reliability decay curves for MAST frameworks, demonstrating the quantification and ranking of reliability across agent types.
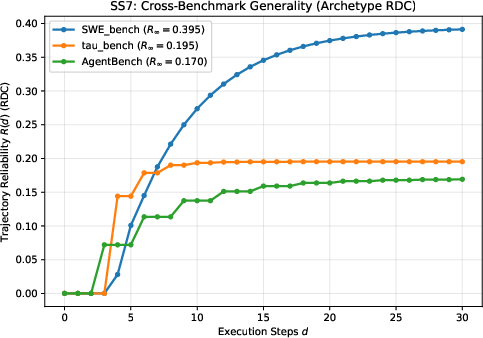
Figure 4: Cross-benchmark archetypes: synthetic RDC curves illustrate portability and adaptability across heterogeneous agent environments.
Contradictory and Strong Claims
The paper makes several bold assertions:
- Scalar metrics reported in the literature are incomplete; they fail to explicitly identify the first-passage distribution or uncertainty, and do not support deployment-facing queries.
- Metric reconciliation: passpassk8, passpassk9, and RDC are not competing summaries but conditional projections of one underlying distribution; disagreement is a denominator/semantic issue, not a fundamental reliability difference.
- The composite KS-AIC diagnostic allows practitioners to reject DTMC abstractions when traces are not Markov, providing actionable guidance for model selection.
- Max RDC discrepancy M^=(Q^,R^⊕,R^⊖)0 indicates tight agreement between analytic and empirical reliability curves on synthetic held-out corpora.
Practical and Theoretical Implications
Practically, TraceToChain enables team-level deployment reliability queries (step horizons, tool perturbations, local metric compatibility) without rerunning entire benchmarks for each alteration. The fit is conditional: diagnostics and uncertainty quantification are central, and rejected fits prompt segmentation or adoption of semi-Markov or HMM alternatives.
Theoretically, the approach unifies scalar metrics, perturbation analysis, and classical NHPP reliability growth within the absorbing-chain framework, clarifies the importance of repeated-trial semantics, and paves the way for mixture-chain and online estimation extensions. The diagnostic layer converts latent assumption violations into measurable gaps, aligning evaluation with reliability engineering principles.
Future Directions
Further research will extend to semi-Markov durations, partial observability (HMM reliability), mixture-chain modeling of cross-trial correlation, and integration with model-checking toolchains (PRISM, Storm). Validation on raw SWE-bench and M^=(Q^,R^⊕,R^⊖)1-bench trajectories requires step-level feature engineering, a current empirical bottleneck.
Conclusion
This work provides an audited, conditional methodology for LLM-agent reliability grounded in absorbing Markov chains. The framework supports actionable, horizon-aware, and perturbation-sensitive reliability queries, consolidates metrics into a unified semantic space, and delivers uncertainty quantification and diagnostic capability. The empirical and simulation validation demonstrates statistical adequacy for controlled agent traces, and the methodology is extensible to broader agentic environments contingent on trace feature availability. Acceptance of the fitted chain as a reliability artifact is always conditional on diagnostic and empirical validation.
Figure 11: SS1 closed-form validation: absolute error M^=(Q^,R^⊕,R^⊖)2 between analytic and Monte Carlo estimates stays below the 5% threshold, validating reliability formulas.
Figure 1: Additional theorem checks: perturbation screening, correlated-trial lift, and passM^=(Q^,R^⊕,R^⊖)3 diagnostic gap.
Figure 7: The NHPP rare-failure limit: cumulative first-passage distributions of the fitted chain align with Goel--Okumoto mean-value forms in rare-failure regimes.
Figure 5: Perturbation sensitivity analysis: empirical gaps versus analytic upper bounds across chains with varying M^=(Q^,R^⊕,R^⊖)4.
Figure 6: Correlated-trial effect: gap between mixture and i.i.d. passM^=(Q^,R^⊕,R^⊖)5 grows with M^=(Q^,R^⊕,R^⊖)6 and latent variation.
Figure 7: Exact cumulative first-passage CDF (M^=(Q^,R^⊕,R^⊖)7) matches Goel--Okumoto NHPP limit (M^=(Q^,R^⊕,R^⊖)8) as scaling regime intensifies.
Figure 2: GoF safeguard: composite KS-AIC protocol outcome across Markov and non-Markov ground truth, and MAST-derived synthetic corpora.
Figure 3: Finite-horizon reliability curves on MAST summaries: RDCs for seven frameworks ranked by M^=(Q^,R^⊕,R^⊖)9.
Figure 8: Held-out empirical RDC recovery: analytic curves overlay empirical RDCs for controlled agent traces.
Figure 4: Cross-benchmark archetypes: analytic RDCs for SWE-bench, tau-bench, AgentBench synthetic state spaces show vocabulary portability.