- The paper demonstrates that static leaderboards obscure model performance heterogeneity by relying on aggregated, designer-defined metrics.
- It presents an interactive interface employing hierarchical clustering and dynamic weighting to let users tailor evaluation criteria and reveal ranking tradeoffs.
- Empirical analysis on the Human Preference 140K dataset shows that prompt bias and oversampled tasks distort overall rankings and challenge one-size-fits-all evaluations.
Interactive, User-Defined Evaluation of LLM Leaderboards
Context and Challenges of LLM Leaderboard Evaluation
The benchmarking and comparative evaluation of LLMs has become centrally institutionalized through public leaderboards. However, current leaderboard designs are fundamentally shaped by the data selection, aggregation, and evaluation paradigms chosen by a narrow group of benchmark designers. This structural asymmetry decouples evaluation outcomes from the pluralistic and context-specific deployment requirements of real-world users and organizations. Aggregate metrics—such as single overall Elo scores—obscure substantive heterogeneity in model behavior across prompt types and compositional slices, masking variability that is often critical for practical model selection in vertical domains or value-laden contexts.
The paper "Who Defines 'Best'? Towards Interactive, User-Defined Evaluation of LLM Leaderboards" (2604.21769) presents an in-depth investigation into these issues. It provides both a technical and empirical analysis of the LMArena benchmark's data composition and the instability of aggregate rankings, before introducing an interactive visualization interface that allows end users to directly define and weight evaluation slices, surfacing the tradeoffs and instabilities inherent in existing approaches.
Empirical Analysis of Dataset Bias and Ranking Instability
A core analytic result concerns the detailed examination of the Human Preference 140K dataset from the LMArena leaderboard. The authors construct a three-level hierarchical clustering of prompt topics using combined LLM-based and human-in-the-loop methods to maximize semantic coherence and cluster robustness. This analysis reveals a highly skewed distribution of prompt types:
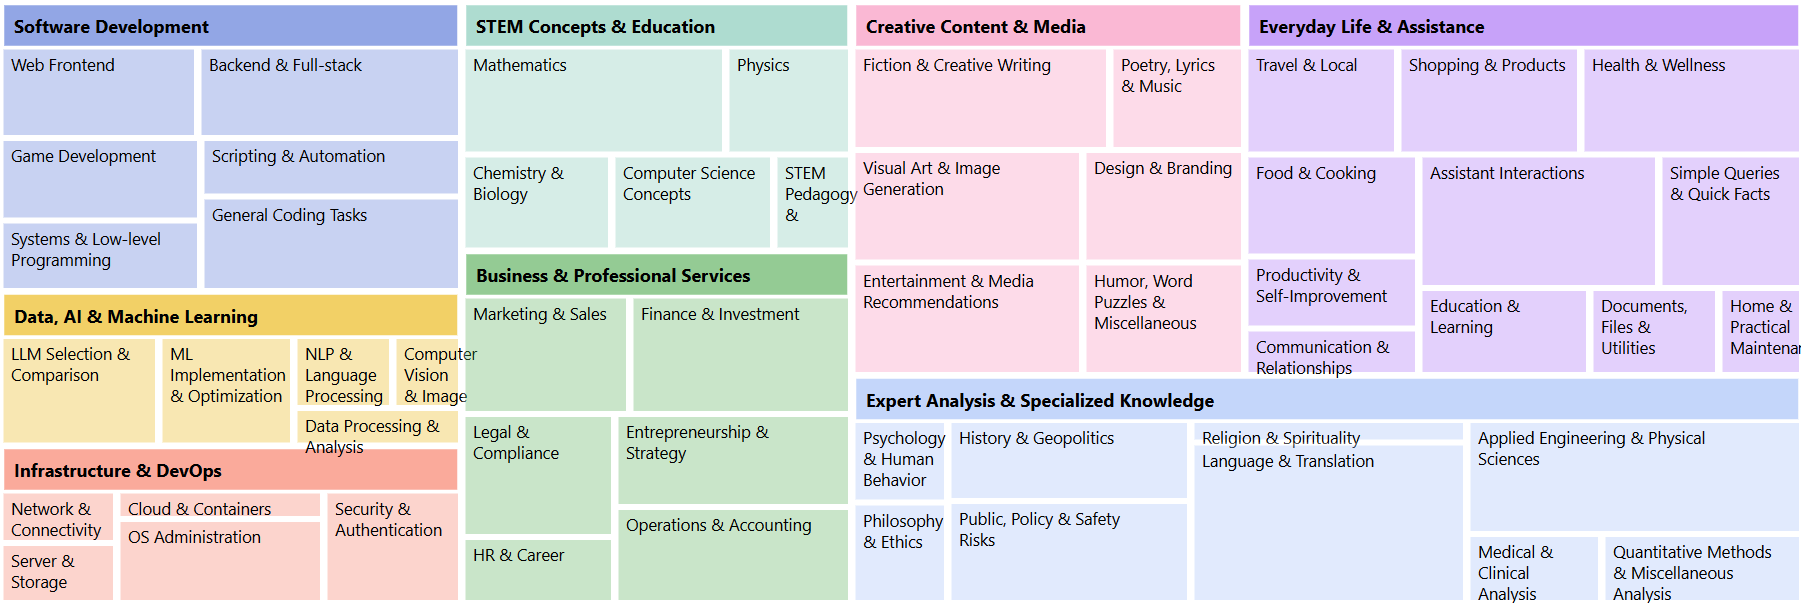
Figure 1: The LMArena dataset is dominated by developer- and AI-related prompts, with these categories comprising approximately 30% of the total data.
Such overrepresentation introduces consequential bias: leaderboard scores primarily reflect performance on these highly sampled topics, rather than general model robustness or capability across the true deployment spectrum. Additional empirical irregularities are detected, including the proliferation of simple "greeting" prompts—where users often arbitrarily select a winner—and the heavy repetition of idiosyncratic queries (e.g., character counting questions), each distorting aggregate results.
Evaluation of model win rates across mid-level prompt categories further foregrounds the instability of the leaderboard's single global ranking. The authors compute Bayesian-smoothed win rates for each model-category pair and visualize performance heterogeneity:
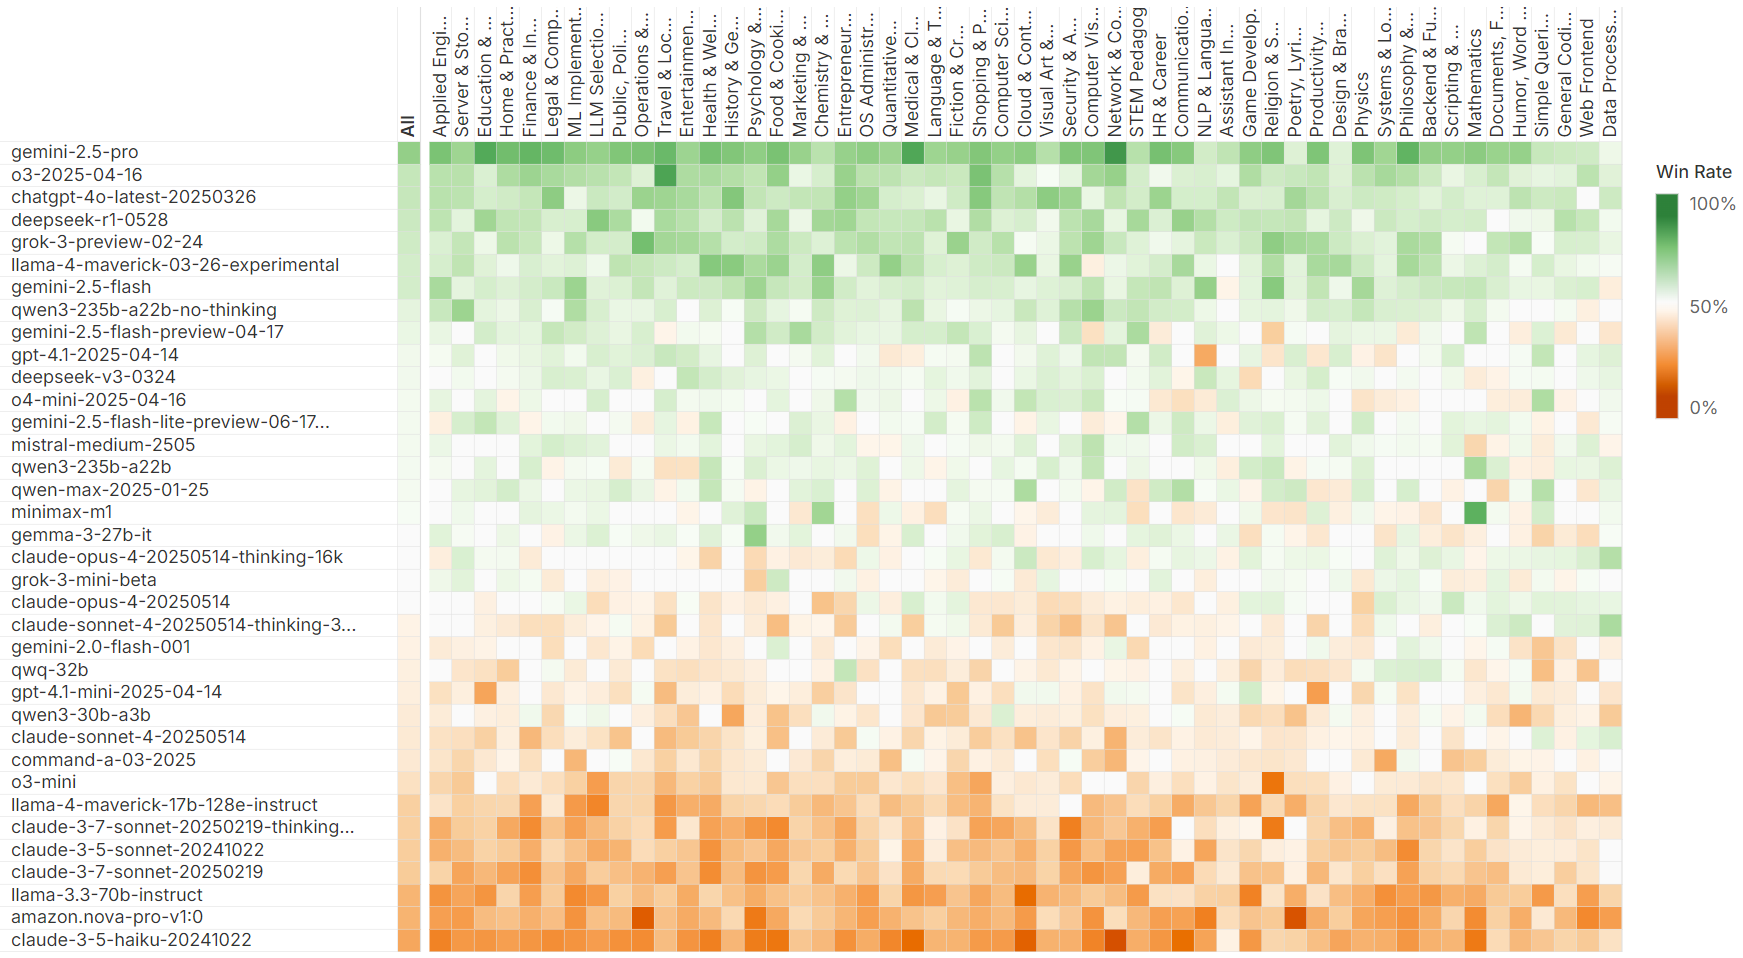
Figure 2: A heatmap shows substantial divergence in category-specific win rates for top models, with categories such as Data Processing and Math highlighting outlier behaviors (e.g., Claude-family excelling in Data Processing; minimax-m1 dominating Math).
Notably, the Spearman correlation between per-category and overall rankings varies widely; for Data Processing {content} Analysis, it falls as low as 0.60, demonstrating that models normally absent from the global top 20—such as several Claude variants—rise dramatically in these specific task types. For minimax-m1, the Math category win rate exceeds 80% (z-score > 8), despite a much lower global position.
Limits of Preference-Based Aggregation: Deterministic vs. Value-Dependent Tasks
The authors systematically characterize when aggregate, preference-based evaluation fails to capture either correctness or operationally relevant distinctions. Deterministic tasks (e.g., non-ambiguous mathematics prompts) reveal that human annotators select the correct answer only 74% of the time—even when the other response is objectively incorrect. Inspection shows that stylistic factors dominate user preference in many cases: when both responses are correct, users make a preference judgment 56% of the time, typically based on explanation conciseness, elaboration, and structural clarity, as revealed by LLM-based analysis of explanation style features.
Conversely, for value-dependent, pluralistic prompts (e.g., politically sensitive questions), 6% of model responses in identified sensitive categories are position-taking (non-pluralistic), with rates that escalate to 21% for value judgments and 16% for China-related issues. Aggregated rankings are structurally determined by majority annotator perspectives; for example, preference between pluralistic and position-taking responses is not statistically significant (non-pluralistic response wins: 54%, 95% CI [0.44, 0.65]; p=0.25). The consequence is that models can gain rank not on epistemic quality but on alignment with dominant or transient value-positions among annotators, undermining claims of universal utility or fairness.
Interactive Visualization Interface: Design and Implementation
Motivated by these empirical findings, the authors design an interactive, user-facing leaderboard interface enabling the dynamic configuration of evaluation slices and their respective importances.
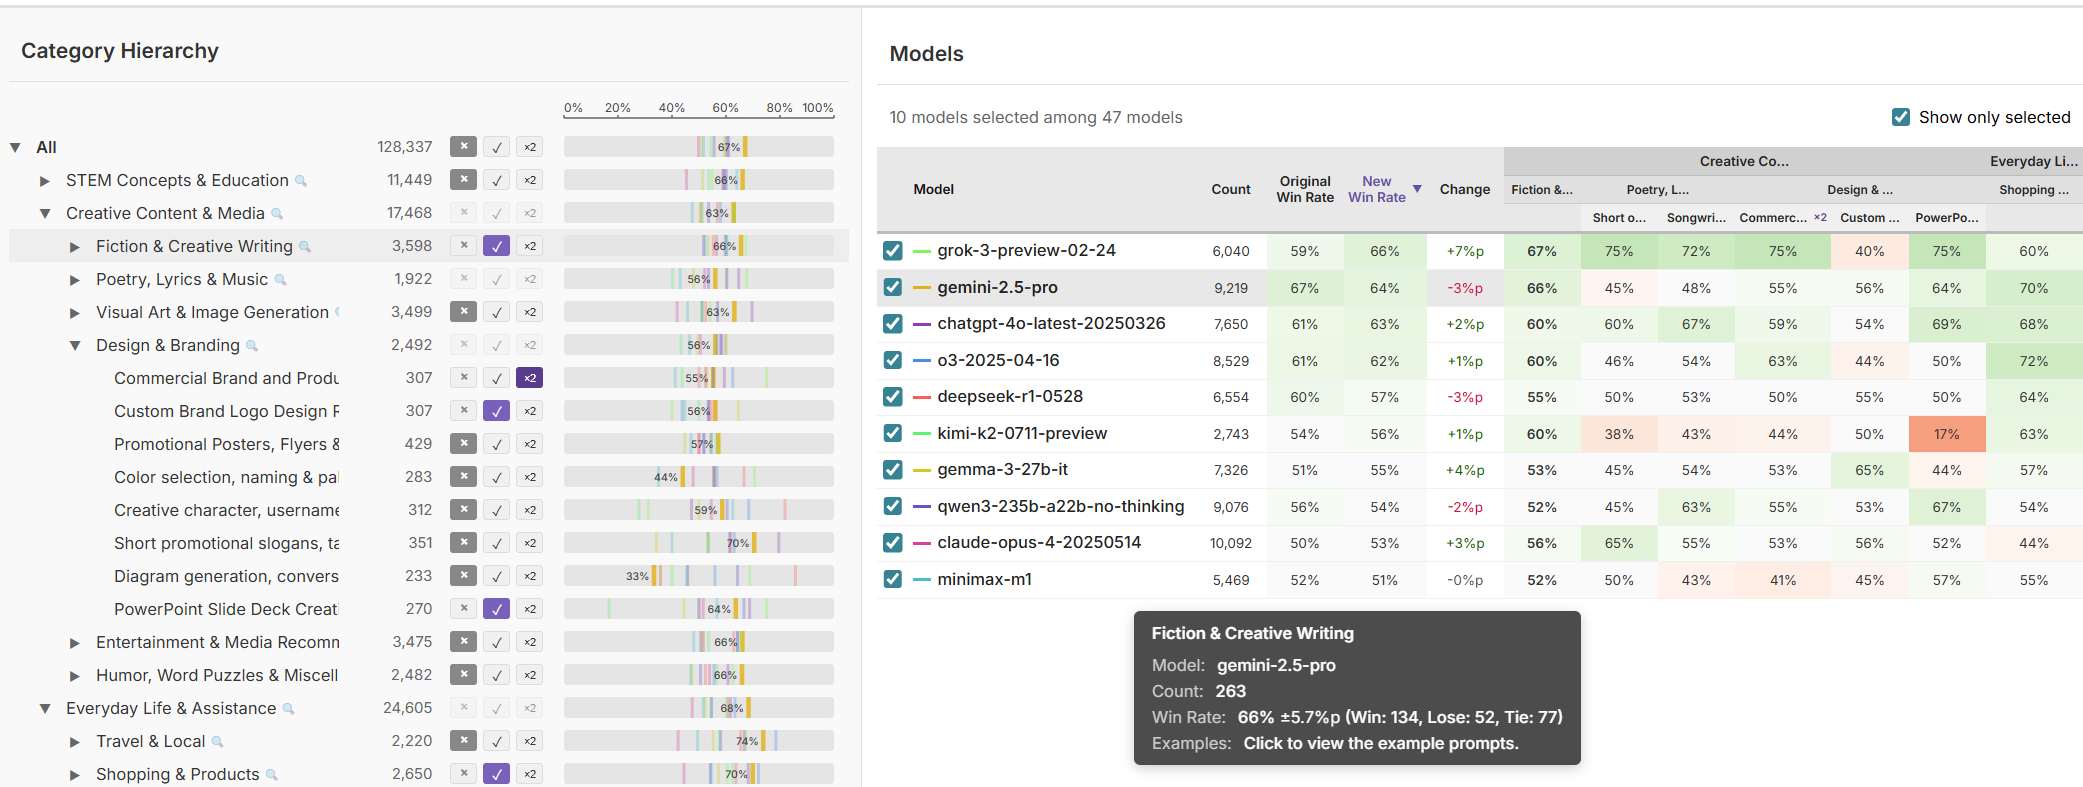
Figure 3: The interactive leaderboard allows users to select and weight prompt slices via a hierarchical topic panel (left) and view dynamically recomputed model rankings with per-category win rates and example inspection (right).
Users can expand or collapse branches in the topic tree and assign weights to categories, with model rankings updating in real time to reflect the selected composition. Heatmap encodings of category-level win rates and coordinated views facilitate rapid identification of slice-dependent tradeoffs and outlier behaviors. Example prompts and performance details are made accessible at the model-category intersection, grounding metric numbers in qualitative behavior.
A qualitative study (n=10) with experienced AI practitioners demonstrates that participants leverage the interface to challenge assumptions about model quality, refine slices to match deployment domains, calibrate statistical reliability, and, crucially, support team decision-making with transparent justifications. Notably, participants did not passively accept rankings, but interrogated their meaning, reflected on dataset artifacts, and negotiated the application-relevance of candidate models.
Implications, Risks, and Theoretical Significance
The principal theoretical implication is that leaderboard evaluation should be reframed as a sensemaking activity, not as a search for a global optimum. Model rankings, especially those founded on preference-based aggregation, are contingent artifacts of data composition, annotation strategy, and the value positions of annotator populations. Existing leaderboards collapse distinct modes of evaluation—such as correctness in deterministic domains and value-conformance in pluralistic settings—into an undifferentiated signal, thereby concealing instability, bias, and operationally significant variation.
Interactive, user-driven slicing makes the contingency and tradeoff structure visible, aligning evaluation more closely with deployment requirements and values. Nevertheless, user-defined evaluation introduces new risks, such as narrow or biased configuration, unreliable statistical signals in small slices, and an increased surface for adversarial manipulation. These remain open research questions, particularly as the complexity of slice and metric assignment grows.
The authors argue for a broader transition towards multi-metric, multi-slice evaluation, in which users may select both slices and the relevant metrics (e.g., correctness rather than preference for deterministic tasks), addressing the observed limitations of existing data and interfaces. Such a shift will require advances in dataset annotation, interface ergonomics, and methods for surfacing the stability or instability of aggregate metrics.
Conclusion
This work establishes that current LLM leaderboard practices are structurally limited by their dependency on static, designer-chosen benchmarks and aggregated preference-based scoring. Through detailed empirical analysis and interactive visualization design, the authors demonstrate that model rankings are unstable artifacts, closely tied to dataset composition and insensitive to deployment-context divergences. Allowing stakeholders to flexibly slice, weight, and inspect leaderboard data greatly increases transparency and supports context-sensitive evaluation. For both practical and theoretical progress, future evaluation frameworks must move beyond one-size-fits-all aggregation, supporting pluralistic, multi-metric, and dynamically sliceable evaluation paradigms that reflect both technical and socio-ethical requirements in real-world deployments.