- The paper introduces a two-stage framework that uses LLM semantic filtering to isolate genuine economic relationships from corporate disclosures.
- The methodology refines candidate networks by removing spurious edges, resulting in improved Sharpe ratios and reduced maximum drawdown in portfolio signals.
- Empirical results confirm that high-fidelity filtered economic networks yield robust mean-reversion strategies with superior risk-adjusted returns.
LLM-Augmented Semantic Networks for Cross-Stock Predictability
Introduction
This paper introduces a two-stage LLM-augmented framework for constructing economic networks from corporate textual disclosures with the objective of improving cross-stock return predictability. The central motivation is to overcome the limitation of existing embedding-based approaches that infer economic linkages between firms solely from textual similarity, resulting in networks contaminated by spurious edges that do not reflect substantive economic relationships. By incorporating LLM reasoning as a semantic filter, the proposed method aims to isolate true economic relations and thereby produce more robust mean-reversion trading signals.
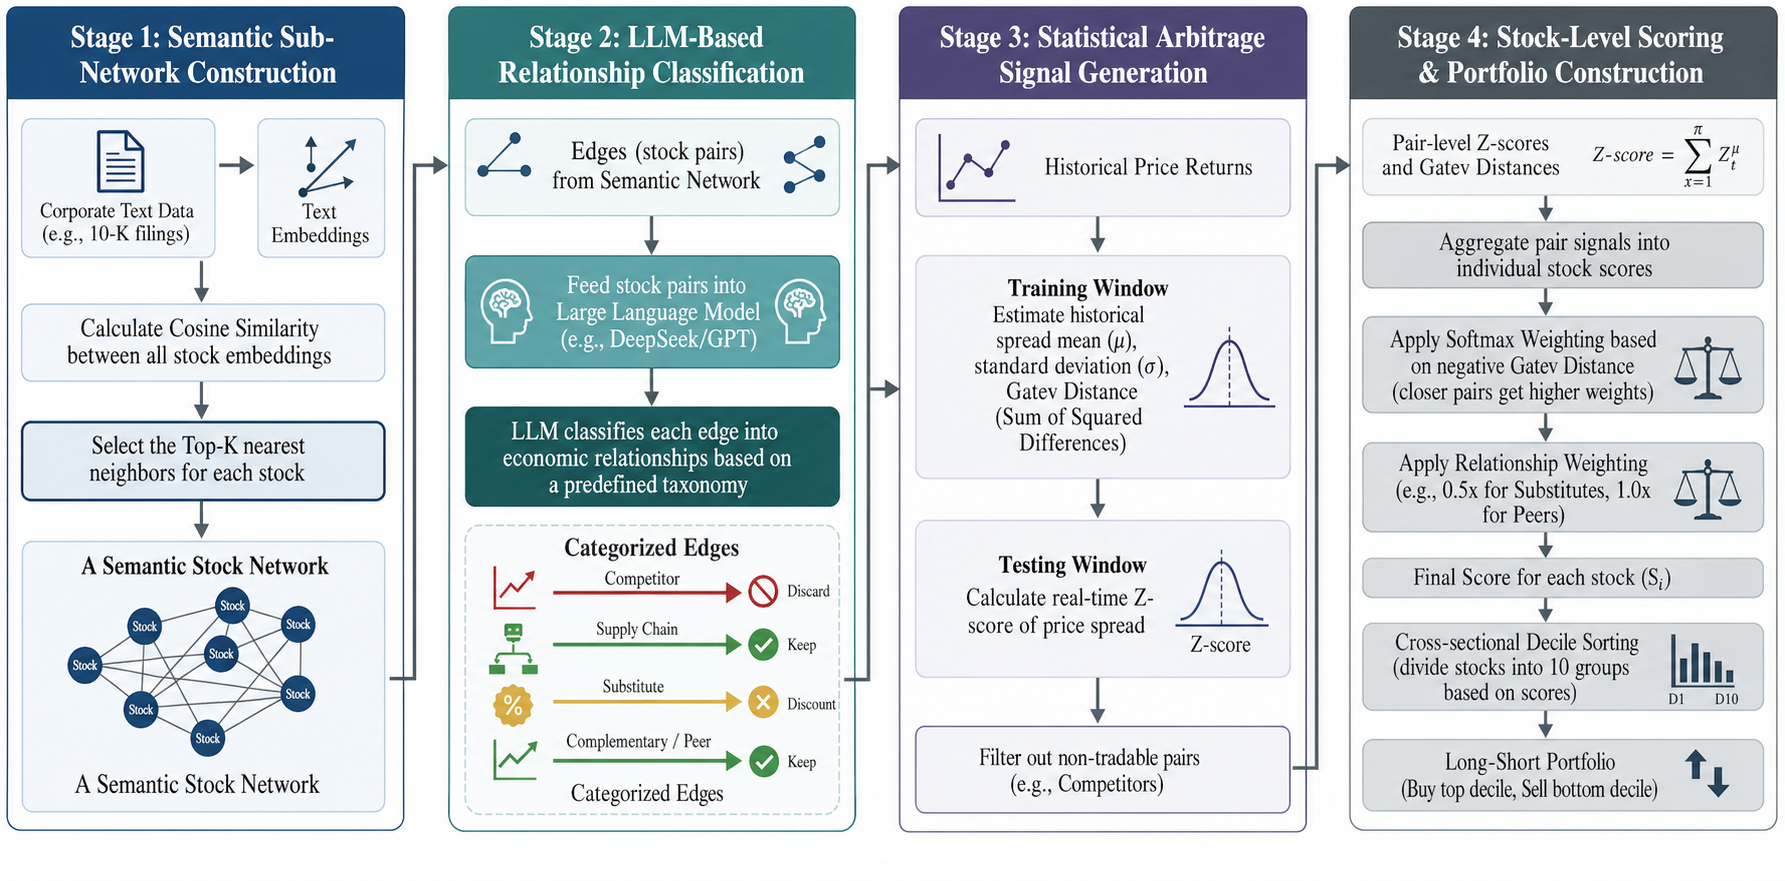
Figure 1: Overview of the proposed framework. The pipeline consists of candidate edge retrieval using text embedding similarity, followed by LLM-based relationship classification and portfolio signal construction.
Methodology
Candidate Edge Retrieval
The initial step computes 10-K text embeddings for each firm–year, preserving high-level representations of firm characteristics from annual disclosures. For each firm, a candidate peer network is generated by taking the top-K most similar companies by cosine similarity in embedding space and symmetrizing the resulting adjacency graph.
LLM-Based Edge Classification
To address the problem of networks polluted by topical similarity rather than economic relevance, an LLM is prompted as a semantic classifier. For every candidate firm pair, anonymized disclosures—including business description, product/segment details, and competitor mentions—are fed as structured prompts. The LLM must select a single edge category (competitor, supply_chain, complementary, substitute, peer, unrelated) and provide supporting evidence from the filings. Edges identified as competitors are removed (reflecting the structural nature of price divergence for substitutes), while other relation types are retained or downweighted according to a pre-defined schema.
This retrieve-then-reason approach recasts network construction as a supervised semantic labeling problem, leveraging advances in LLMs for economic interpretation rather than direct price forecasting.
Signal Aggregation and Portfolio Construction
Return spread z-scores for each retained firm pair are computed with rolling-window statistical normalization. Pair-level signals are then aggregated into per-stock signals using a relation- and distance-aware weighted sum, where the historical co-movement tightness (Gatev distance) determines softmax weights. The resulting cross-sectional signals are used to generate daily long-short portfolios by ranking stocks and executing quintile trades.
Empirical Results
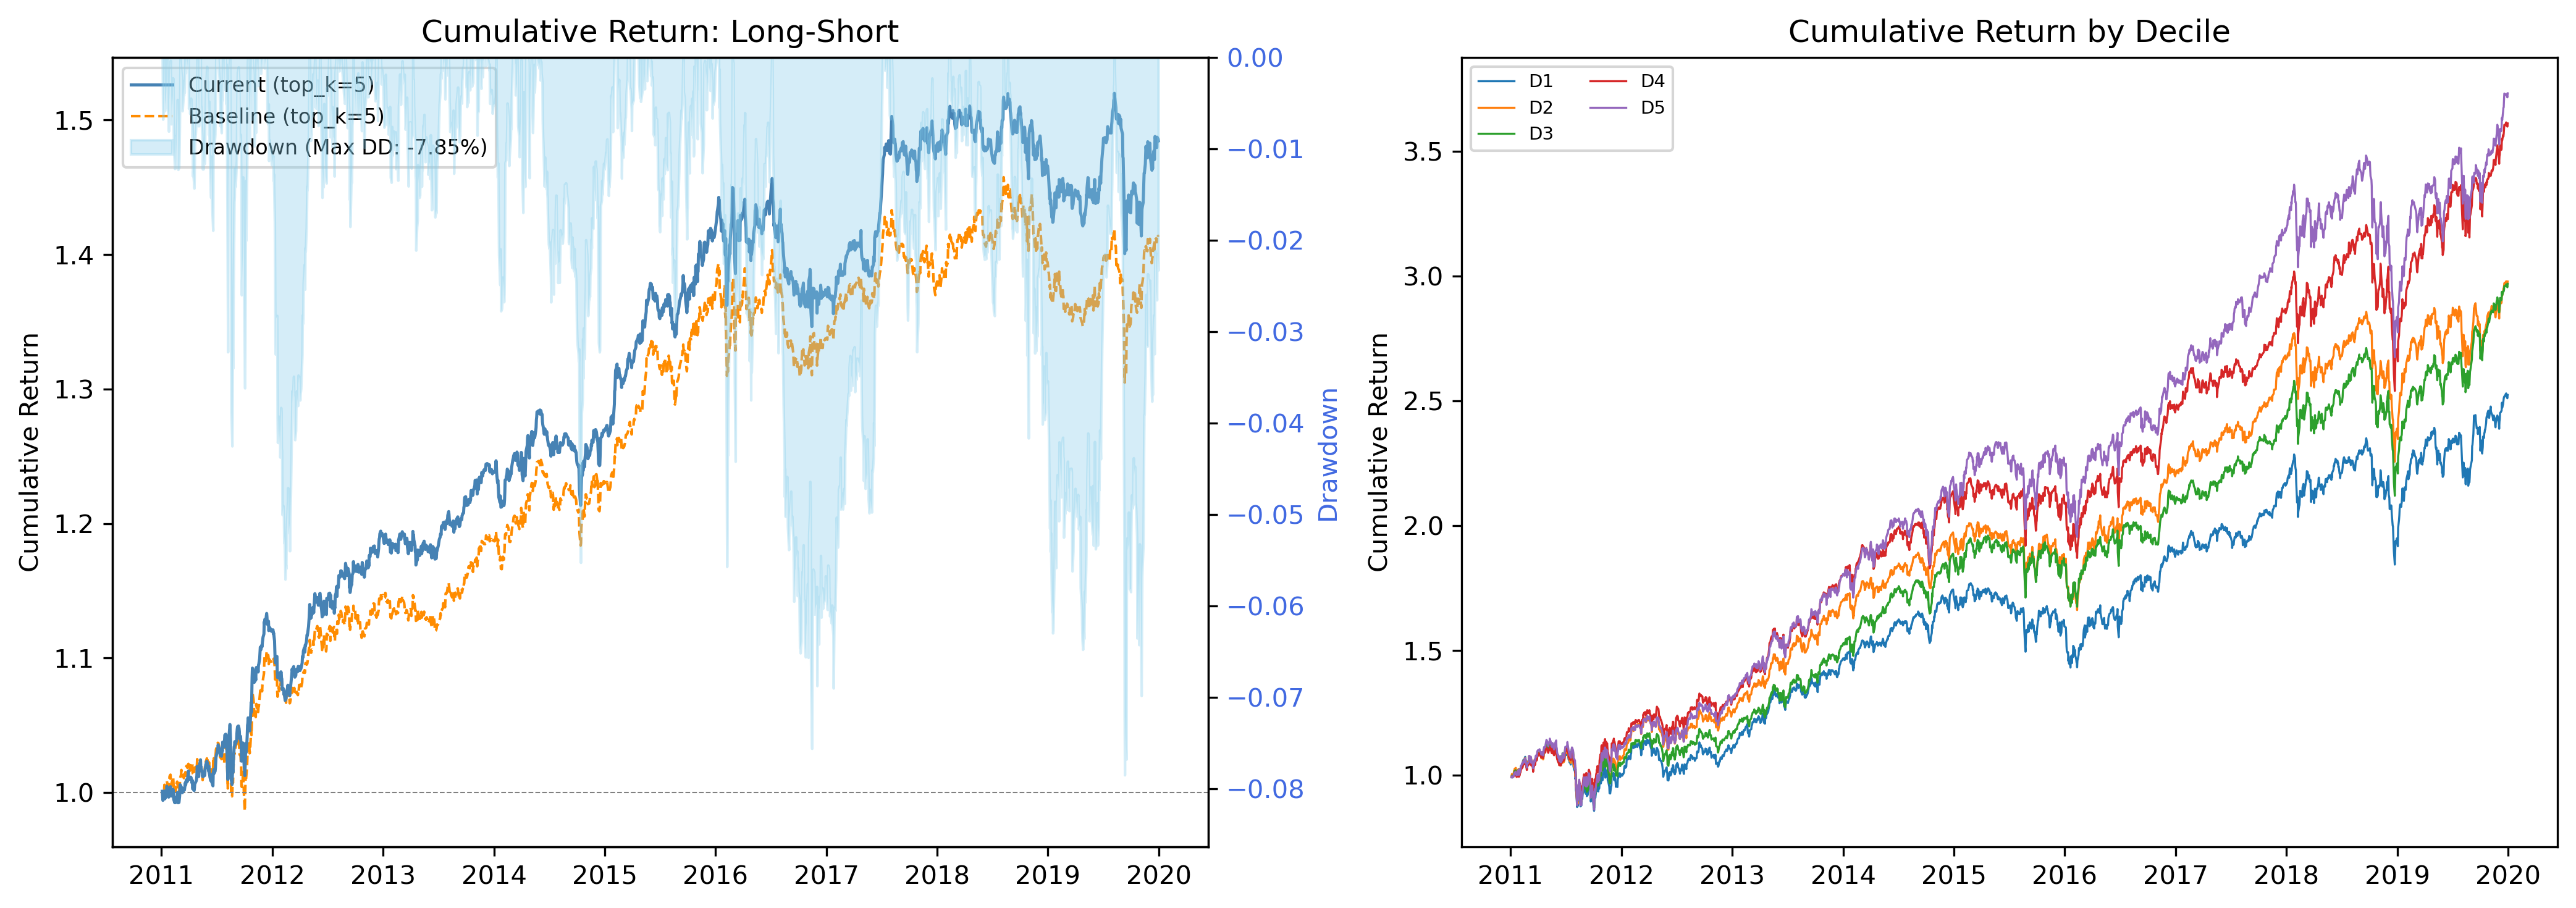
Figure 2: Cumulative returns of the long-short portfolio and quintile portfolios, demonstrating monotonic risk-adjusted return improvement with LLM-augmented filtering.
Across a comprehensive backtest on S&P 500 constituents from 2011 to 2019, the LLM-augmented filtering enhances statistical and economic performance on multiple dimensions:
- Sharpe ratio improves from 0.742 (baseline embedding network) to 0.820 with LLM filtering.
- Maximum drawdown reduces from −10.47% to −7.85%, indicating tangible tail risk mitigation.
- Outperforms both random-graph and SIC-based industry network baselines, where the latter achieves a lower Sharpe of 0.792 with higher volatility.
Empirical analysis also demonstrates that the LLM-based framework yields positive abnormal returns (alpha) orthogonal to standard Fama–French risk factors, confirming that its cross-stock signal is not subsumed by known premia. Quintile portfolio sorting further shows monotonic risk-adjusted returns, with the long leg (Q5) delivering the strongest outperformance.
Component ablations underline that the economic content of the signals arises specifically from the high-fidelity filtered network, not from aggregation mechanics. Parameter sensitivity experiments indicate robustness to key choices such as network sparsity, rolling window length, and rebalancing horizon.
Theoretical and Practical Implications
The findings directly address longstanding challenges in empirical asset pricing, particularly the construction of dynamic, high-resolution economic networks at scale. By shifting from unsupervised proximity-based heuristics to supervised semantic classification, the framework aligns with contemporary finance literature emphasizing the importance of directional and typed inter-firm links (e.g., supply chain, competition, complementarity). The explicit removal and downweighting of links associated with spurious signal regimes (competitors, substitutes) yields more reliable mean-reversion portfolios and lower drawdown risk.
From a practical perspective, the method is scalable—owing to the two-stage design—and amenable to integration with modern systematic trading infrastructure. The use of LLMs for relational reasoning, rather than memorization-driven direct prediction, mitigates common pitfalls (such as overfitting via data leakage) observed in prior studies on LLM-based financial prediction.
Limitations and Directions for Further Research
Several limitations exist. The current implementation restricts itself to annual 10-K disclosures; incorporating timelier proxies (e.g., newsfeed, supply chain datasets, real-time filings) could improve the responsiveness and granularity of edge classification. Although the anonymization protocol reduces memorization bias, it relies on the representativeness and completeness of extracted text, and truncation may suppress relevant context. The static nature of the refined network within annual windows is another bottleneck—higher-frequency or online graph learning could better capture dynamic economic relationships. Additionally, integrating the LLM-refined graph structure within end-to-end differentiable architectures (e.g., GNNs) would allow optimization of the network with respect to portfolio objectives.
Conclusion
By embedding LLM-based semantic reasoning into the construction of cross-stock economic networks, this work demonstrates substantial improvements in risk-adjusted portfolio performance relative to traditional embedding or industry code approaches. The framework produces interpretable, high-fidelity inter-firm graphs that enhance the economic relevance of cross-stock signals, offering both empirical and methodological advances in systematic equity investing. Future work is likely to exploit richer data, higher-frequency inference, and tighter agentic-AI integrations for further performance and interpretability gains.