- The paper demonstrates that LLMs, when compared to humans, employ a deterministic strategy focusing on numerical extraction while humans synthesize visual charts narratively.
- The study uses mixed-methods across varied chart types and prompt constraints to quantify cognitive and statistical reasoning differences, highlighting structural invariance among LLM outputs.
- The evaluation reveals LLMs align more reliably with designer intent yet lag in mimicking human perceptual sensemaking, positioning them as objective validators rather than holistic interpreters.
High-Level Visualization Comprehension in Humans and LLMs: Systematic Divergence and Alignment
Introduction
This paper presents a rigorous comparative analysis of high-level visualization comprehension between humans and state-of-the-art multimodal LLMs (MLLMs), specifically GPT-4o, Claude Sonnet 4, and Gemini 2.5 Flash. The study interrogates whether LLM-driven visual reasoning mechanisms mirror human strategies, particularly in synthesizing complex, designer-intended patterns from charts, or whether machine comprehension fundamentally diverges—either in strategic approach or qualitative outcome. Through an extensive mixed-methods experimental framework, the authors probe human and LLM responses to a diverse set of visual stimuli, systematically varying chart type, data complexity, composition, and prompt constraints, with detailed evaluation along cognitive, statistical, and semantic axes.
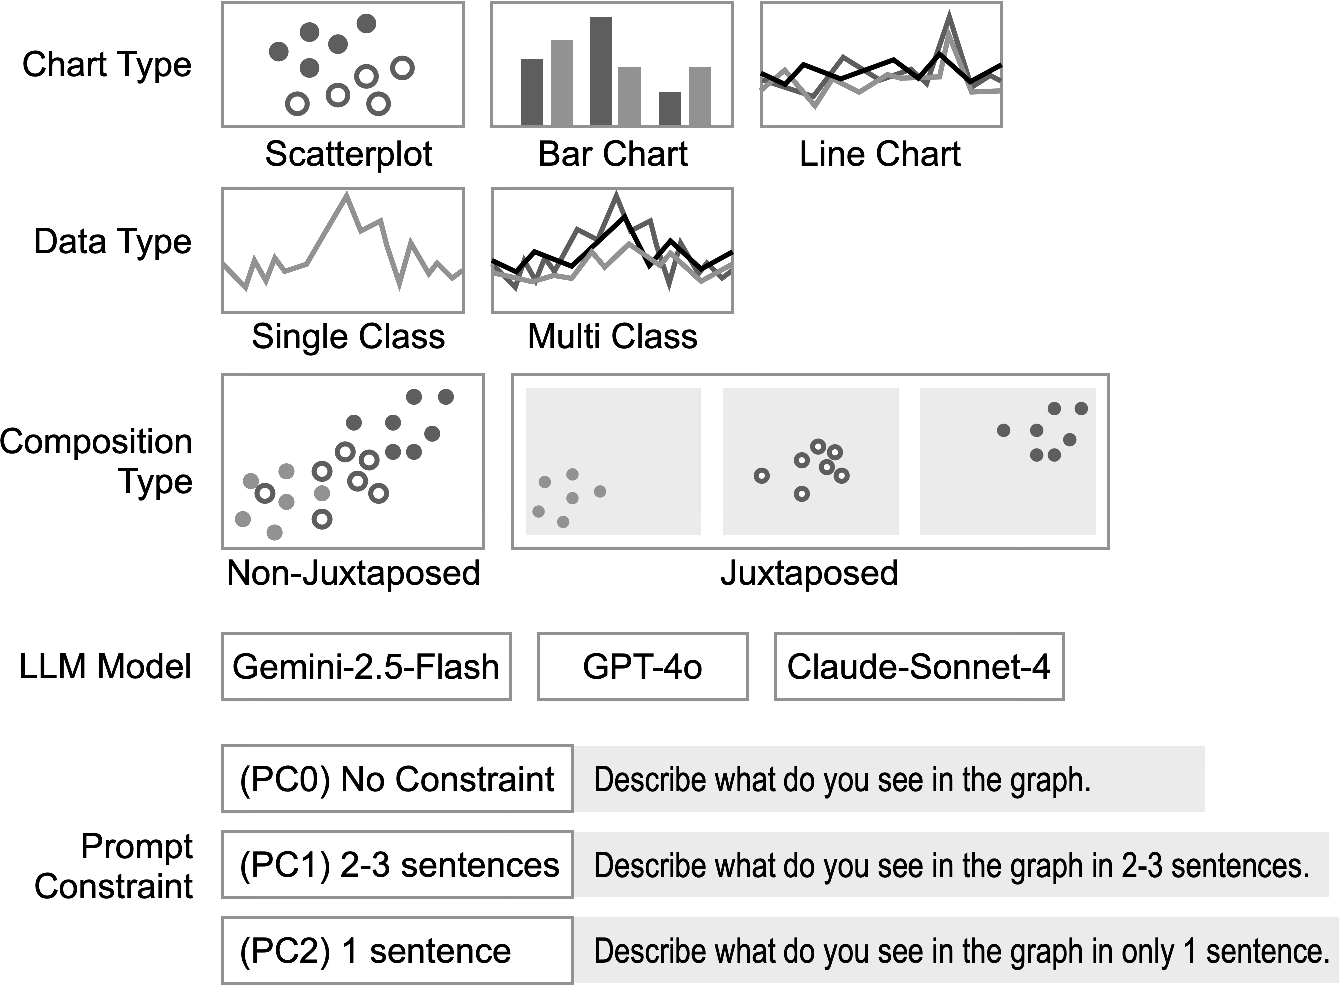
Figure 1: Study design dimensions for the comparative analysis: three chart types, two data typologies, two composition layouts, three LLM families, and three prompt constraints.
Methodology
The core of the methodology lies in eliciting unconstrained and constrained natural-language descriptions of 60 curated visualizations—spanning bar, line, and scatterplot charts, each with systematic manipulation of data class and composition (single/multi-class, juxtaposed/non-juxtaposed). Human responses are procured from a demographically diverse pool, while LLM outputs are generated under three prompt regimes: unconstrained, short (2-3 sentences), and one-sentence summaries.
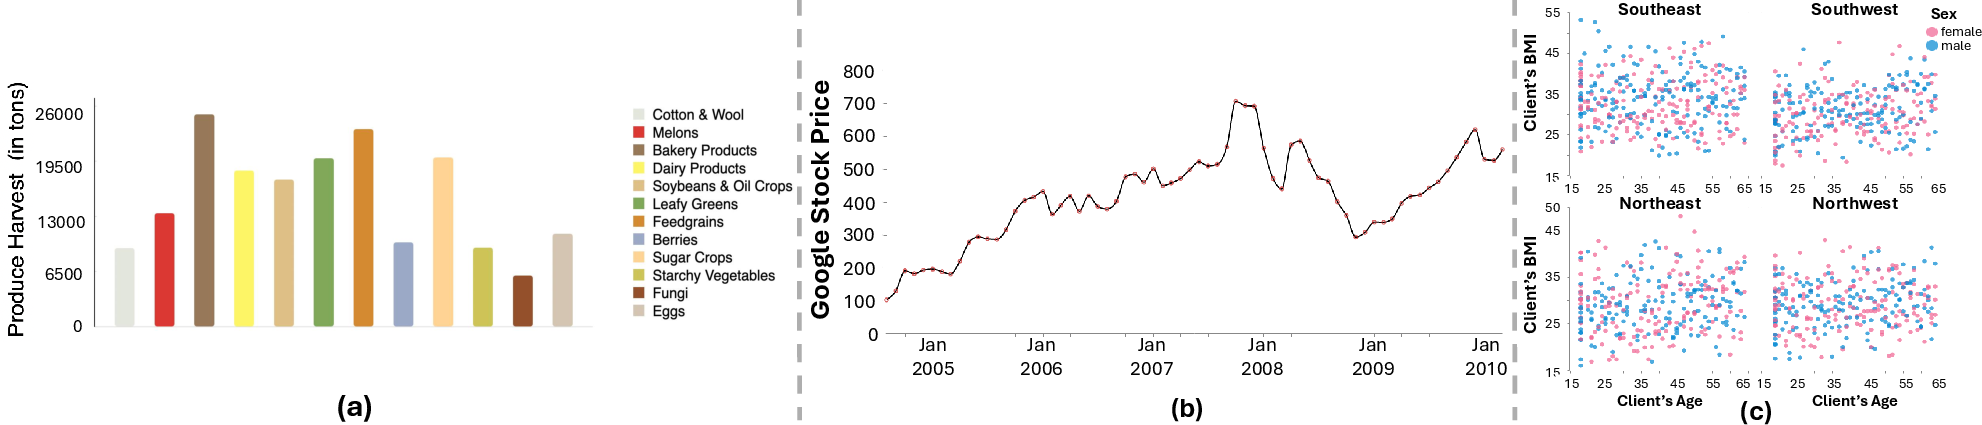
Figure 3: Representative visual stimuli. (a) Multi-class bar chart, (b) line chart of stock time series, (c) multi-class juxtaposed scatterplot.
Descriptions are then coded along three analytic axes:
- Statistical task taxonomy (nine analytic primitives)
- Cognitive complexity via Bloom's Taxonomy (Knowledge, Comprehension, Analysis, etc.)
- Groundedness and intent alignment (visual faithfulness, match to designer goals)
Coding is performed collaboratively using human raters and LLM-as-a-Judge (GPT-5), ensuring robust interrater reliability.
Consistency of LLM Reasoning Across Constraints and Chart Types
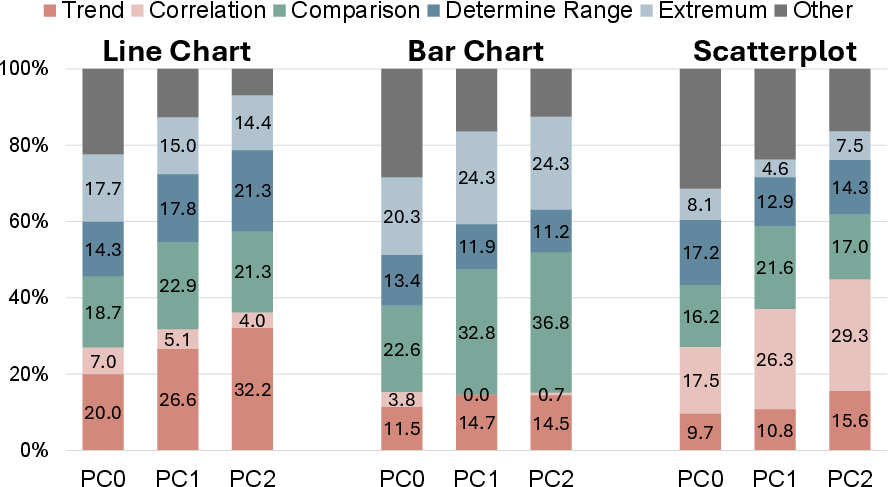
The study finds LLMs exhibit highly stable interpretive mechanisms. Regardless of chart structure or prompt constraint, LLMs consistently employ a structural data enumeration strategy—exhaustively cataloguing chart elements (e.g., ranges, comparisons, extrema) and retaining core semantic content as measured by high inter-prompt cosine similarity (0.8–0.9 across PC0–PC2, see Appendix).
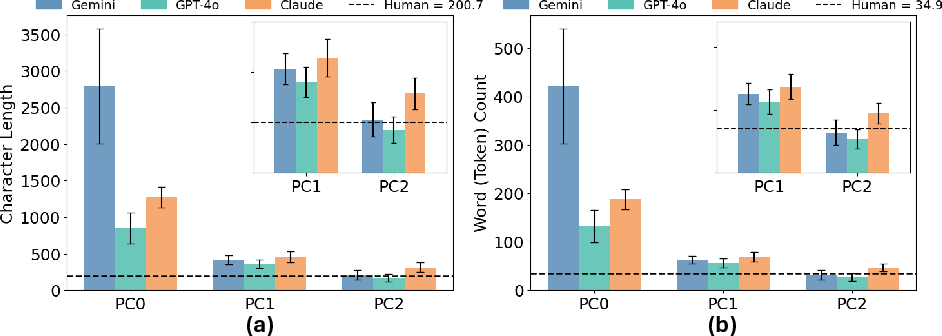
Figure 4: Distribution of response lengths (character and token count) for each prompt constraint, illustrating LLM verbosity reduction under explicit compression but not shift in interpretive essence.
Quantitative analysis affirms that, unlike humans who produce highly compressed and narrative-driven one-sentence descriptions, LLMs only match human brevity under direct constraint and still outperform humans on the number of salient statistical tasks extracted—even in the most compressed form.
Divergent Cognitive and Statistical Reasoning Patterns
Mapping responses to Bloom's Taxonomy reveals a strong divergence between human and LLM cognitive strategies:
Statistical task analysis shows that, while both LLMs and humans initiate with simple comparisons and trend statements, LLMs rapidly pivot to explicit data extraction (Determine Range, Extremum), whereas humans continue narrative synthesis or inference. Crucially, sequence analysis confirms that LLMs mirror standardized, accessibility-style descriptions found in captioning corpora, often executing deterministic (“Trend → Comparison → Extremum”) interpretive pathways.
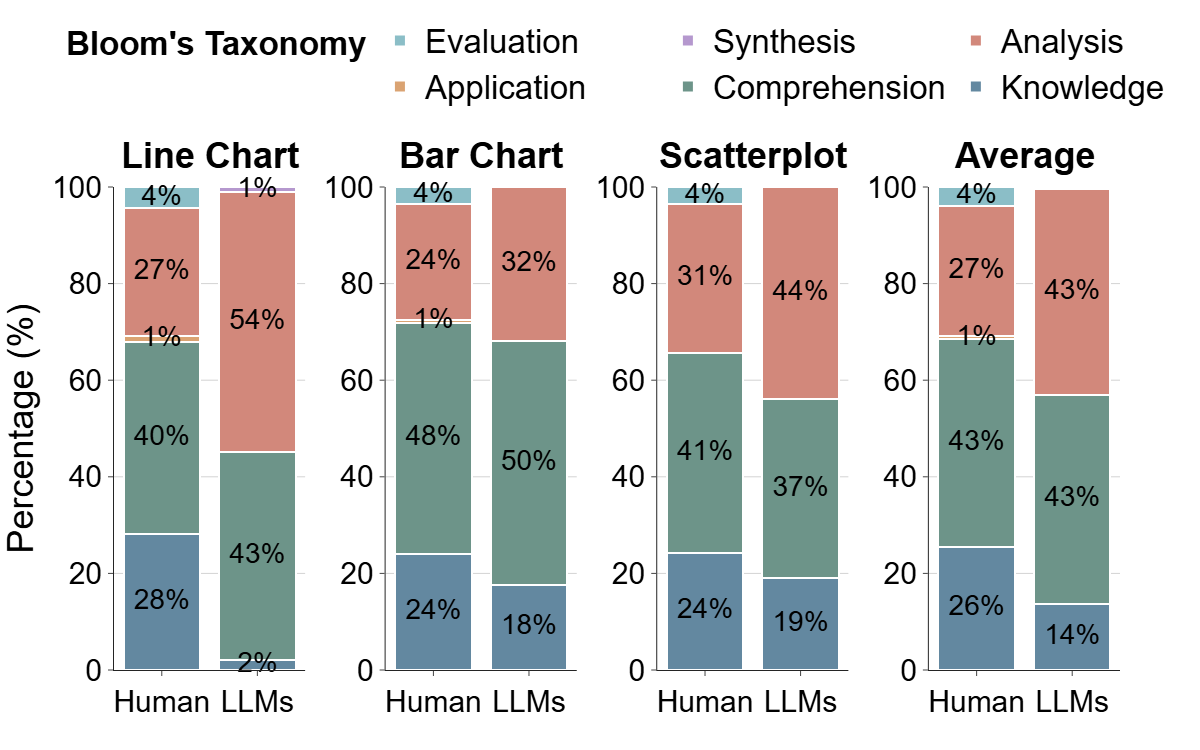
Figure 6: Task transition probability heatmaps for humans and LLMs; LLMs execute rigid sequential extraction, humans display distributed, nonlinear transitions.
Chart Layout and Composition Effects
An essential finding is the insensitivity of LLMs to composition and encoding manipulation. Human descriptions adapt dynamically to layout changes (e.g., noticing visual clutter, referencing juxtaposition), whereas LLMs remain strictly data-oriented—their outputs statistically and structurally invariant to such manipulations, supporting the hypothesis that current MLLMs decode pixel-level data structurally but lack integration with human-like visual scaffolding mechanisms.
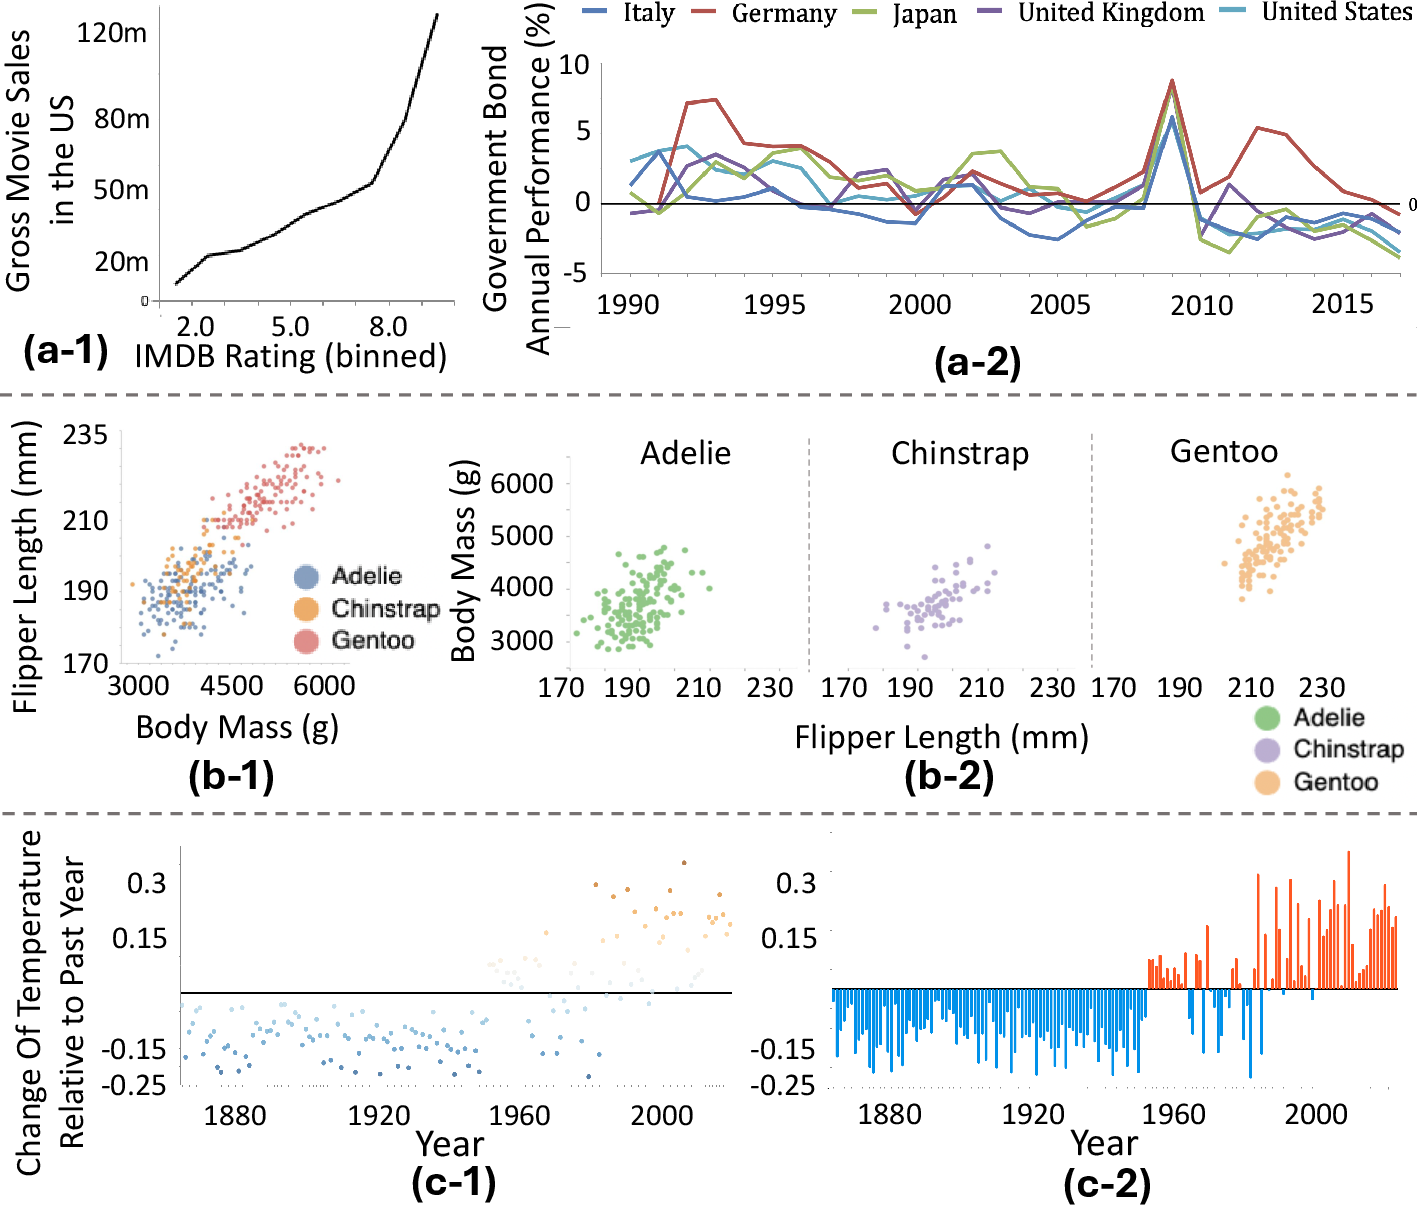
Figure 8: Visualization pairs for composition and encoding analysis, demonstrating LLM rigidity and human adaptability in response to structural affordances.
Designer Intent Alignment and its Implications
Despite strategic divergence, LLMs demonstrate superior technical alignment with designer intent. On the four-level intent-matching scale, LLMs produce complete matches in 71% of cases versus 41% for humans. Notably, humans fail primarily due to perceptual overload in visually complex, high-density, or juxtaposed visualizations, while LLMs never fully miss the designer’s intent—yet often offer only "structurally shallow" mechanical summaries when compared to human qualitative reasoning.
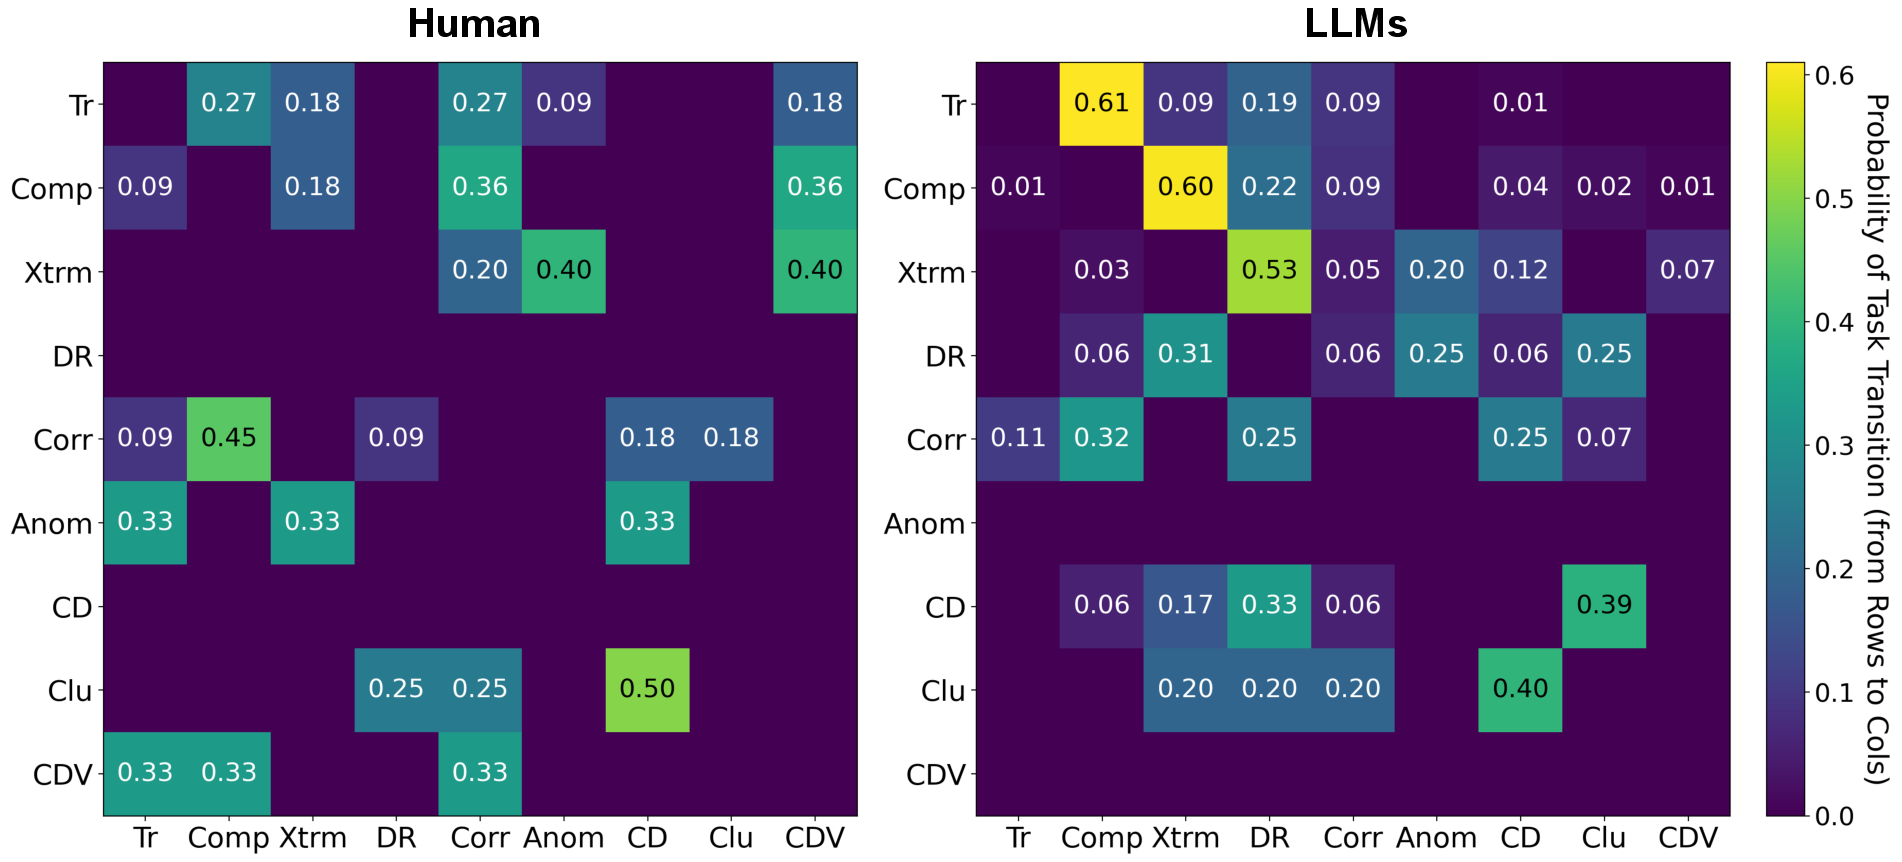
Figure 7: Representative error cases; humans falter due to visual density, LLMs mechanically enumerate but may miss holistic framing or nuanced comparison.
Thus, the results posit LLMs as effective "objective validators" for chart data encoding and technical communicative coverage, but misaligned with the perceptual and sensemaking priorities of human viewers. This supports the usage of LLMs in analytic pipelines as automated validators, but not as proxies for end-user comprehension or narrative quality assessment.
Limitations and Future Directions
The authors note several limitations. The use of Gemini 2.5 Flash (optimal for efficiency, not SOTA visual reasoning), potential bias induced by prompt length constraints, and the scope of designer intent—framed strictly in analytic (as opposed to affective or persuasive) dimensions—could all modulate generalizability. Future work should consider alternative prompting (e.g., Chain-of-Thought, multi-turn dialogue), broader operationalization of intent (e.g., affect, context), explicit modeling of visual complexity metrics, and integration with SOTA vision-LLMs.
Conclusion
This comprehensive analysis of high-level visualization comprehension establishes a clear strategic divergence between humans and LLMs. Humans synthesize visualizations into trend-centric, narrative interpretations using context and perceptual scaffolding. LLMs employ a more mechanistic, structurally deterministic algorithm, excelling at faithful numeric extraction and technical alignment with design objectives, but underperforming in mirroring human perceptual and narrative reasoning. These findings articulate both the promise and the practical constraints of deploying LLMs for visualization interpretation, advocating for their use as objective validators in analytic workflows, but warning against over-reliance as surrogates for human sensemaking evaluation.
References
- "How Do LLMs See Charts? A Comparative Study on High-Level Visualization Comprehension in Humans and LLMs" (2604.08959)