State of the Art of LLM-Enabled Interaction with Visualization
Abstract: We report on a systematic, PRISMA-guided survey of research at the intersection of LLMs and visualization, with a particular focus on visio-verbal interaction -- where verbal and visual modalities converge to support data sense-making. The emergence of LLMs has introduced new paradigms for interacting with data visualizations through natural language, leading to intuitive, multimodal, and accessible interfaces. We analyze 48 papers across six dimensions: application domain, visualization task, visualization representation, interaction modality, LLM integration, and system evaluation. Our classification framework maps LLM roles across the visualization pipeline, from data querying and transformation to visualization generation, explanation, and navigation. We highlight emerging design patterns, identify gaps in accessibility and visualization reading, and discuss the limitations of current LLMs in spatial reasoning and contextual grounding. We further reflect on evaluations of combined LLM-visualization systems, highlighting how current research projects tackle this challenge and discuss current gaps in conducting meaningful evaluations of such systems. With our survey we aim to guide future research and system design in LLM-enhanced visualization, supporting broad audiences and intelligent, conversational interfaces.

Paper Prompts
Sign up for free to create and run prompts on this paper using GPT-5.
Top Community Prompts
Explain it Like I'm 14
Overview
This paper looks at how LLMs—smart AI systems that understand and generate human language—are being used to help people interact with data visualizations (like charts, maps, and diagrams). The authors focus on “visio-verbal interaction,” which means using words (spoken or typed) together with visuals to make sense of data. They reviewed 48 research papers to understand what’s been done, what works, and what still needs improvement.
What questions does the paper ask?
The paper asks simple, practical questions:
- Where and how are LLMs used in visualization tools?
- What kinds of visual tasks do LLMs help with (for example, creating charts, explaining them, or navigating them)?
- How do people interact with these systems (text, voice, gestures, buttons)?
- What types of visuals do these systems handle (charts, maps, networks)?
- In which subject areas are these tools used (like medicine, education, or data science)?
- How well are these systems tested and evaluated?
- What technical strategies do researchers use to connect LLMs with visualization tools?
How did they do the study?
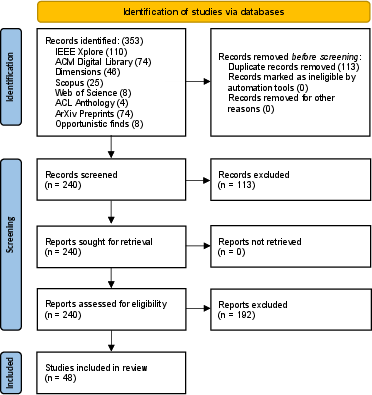
The authors used a careful, step-by-step process called PRISMA, which is like a recipe for doing fair and transparent literature reviews:
- They searched well-known research databases (like IEEE, ACM, ACL, arXiv) using the same keywords everywhere.
- They screened hundreds of papers to find ones that truly involve LLMs and visualization with user interaction.
- They ended up with 48 relevant papers and organized them using a classification framework.
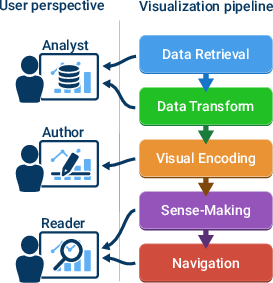
To make the review understandable, they grouped each system into categories:
- Visualization tasks: data retrieval, data transformation (sorting, filtering, etc.), visual encoding (choosing chart types and colors), sense-making (explaining insights), and navigation (zooming, filtering, moving around).
- Interaction modes: typed text (chat), spoken voice, spatial interaction (touch or hand gestures), and standard GUI widgets (buttons, sliders).
- Visual types: charts, spatial visuals (maps or 3D fields), networks (graphs), images/videos, and custom visuals.
- Application domains: data science, medicine/biology/chemistry, physics/engineering, and education/social sciences.
- Evaluation: who tested the systems, how they were measured, and whether they used benchmarks.
- LLM implementation: which models were used, how they were prompted or trained, and whether they used multimodal input (like images or audio), agents, or memory from external sources.
What did they find, and why does it matter?
Here are the main findings, explained in everyday language:
- LLMs can help across the whole visualization pipeline
- They can fetch data, help prepare it (like filtering or summarizing), pick suitable charts, explain what the charts mean, and help users explore the visuals (zoom, filter, and navigate).
- This makes visual tools feel more like a helpful assistant you can talk to, instead of just clicking lots of buttons.
- Text and voice are the most common ways to interact
- Most systems use chat or voice commands because LLMs are very good at language.
- Combining language with gestures (like pointing at a part of a chart while speaking) is promising, but not very common yet.
- Some visuals are easier for LLMs than others
- LLMs handle clearly labeled charts and tables fairly well.
- They struggle with spatial understanding—things like exactly where points are on a map, how 3D shapes relate, or positions and distances—in other words, they can be “blind” to the visual layout.
- Accessibility and helping all users read visuals needs more attention
- There are gaps in making visualizations easy to understand for beginners or for people with different abilities.
- Many tools are designed more for data experts than broad audiences (like students or casual readers).
- Evaluating these systems is hard and often incomplete
- There’s a mix of small user studies, demos, and limited benchmarks.
- The field needs clearer, fairer ways to test whether these tools actually help people understand data better.
- LLMs have limits that affect trust and practicality
- They can “hallucinate” (make things up), show bias, be expensive to run, and have delays.
- These issues are especially risky when explaining data, where accuracy really matters.
- How systems are built varies a lot
- Researchers use different LLMs, prompting tricks, and sometimes multimodal models that can look at images or listen to audio.
- Some systems use multiple AI agents that specialize in different tasks.
- Others connect to outside knowledge (like databases) to improve accuracy and reduce hallucinations.
What’s the impact?
This survey gives a clear map of the current landscape. It shows what’s promising (conversational, accessible, multimodal visualization tools) and what needs work (better spatial understanding, stronger evaluations, more support for beginners and accessibility).
In simple terms:
- For designers and researchers: build systems that combine talking and visuals, but test them well and make them reliable.
- For teachers and students: expect more tools that can explain charts like a tutor—answering questions, guiding exploration, and tailoring explanations.
- For the future: aim for trustworthy, inclusive, and truly multimodal systems where you can point, speak, and explore, and the AI understands both your words and the visual context.
Key takeaway
LLMs are turning visualization tools into conversational helpers. They can make data exploration more natural and accessible, but they still struggle with understanding spatial layouts and sometimes get things wrong. With better design, careful evaluation, and attention to accessibility, these systems could help many more people make sense of complex data.
Knowledge Gaps
Knowledge gaps, limitations, and open questions
Below is a concise list of what remains missing, uncertain, or unexplored according to the paper’s scope, methodology, and synthesis of the field; each item is framed so future work can act on it.
- Coverage and recall of the literature search: How many relevant systems were missed by limiting queries to “visualization AND interact* AND (LLM OR GPT OR transformer)” in titles/abstracts/keywords, excluding synonyms (e.g., “conversational,” “agent,” “voice,” “natural language”), variant spellings (e.g., “visualisation”), and domain-specific terms?
- Temporal fragility of findings: How robust are the conclusions to the rapid pace of LLM releases and preprints, given the limited inclusion of arXiv work (3/78) and no rolling update mechanism?
- Scope constraints: What important insights are lost by excluding non-system contributions (e.g., datasets, benchmarks, theory/position papers) and by focusing on LLM4Vis while omitting Vis4LLM (using visualization to analyze/explain LLMs)?
- Coarse domain taxonomy: Does collapsing Elsevier’s taxonomy to five broad domains obscure domain-specific constraints (e.g., clinical vs. surgical vs. radiology; K–12 vs. informal learning vs. professional training)?
- Task taxonomy coverage: Are crucial tasks missing (provenance tracking, uncertainty communication, trust calibration, collaboration/coordination, security/privacy, reproducibility) that matter for LLM-enabled visualization?
- Output modality gap: The survey primarily classifies input modalities; what standards and best practices should guide output modalities (text, visual highlights/overlays, audio descriptions, haptics) for effective comprehension and accessibility?
- Underexplored multimodal grounding: How can systems robustly fuse deictic gestures, gaze, touch, and speech with visual context to resolve references (this/that/there) and maintain shared situational awareness?
- Spatial reasoning limitations: What concrete model adaptations, representations, or toolchains (e.g., chart parsers, scene graphs, geometric tokens) best mitigate VLMs’ weaknesses in spatial, temporal, and relational reasoning over charts, maps, and 3D scenes?
- Navigation in 3D and complex views: What interaction designs and agent strategies reliably support camera control, viewpoint planning, and multiscale navigation via natural language and gestures?
- Accessibility and visualization reading: How should we design, generate, and validate high-quality alt text, audio descriptions, and structured summaries for complex charts and multiview dashboards with and without screen readers?
- Multilingual and cross-cultural interaction: How well do current systems support non-English languages, code-switching, domain terminology, localized visual conventions, and sign-language interfaces?
- Personalization and memory: What privacy-preserving, auditable memory mechanisms enable LLMs to learn user preferences, vocabulary, and workflows over time without data leakage (e.g., RAG, explicit memory, federated updates)?
- Reliability and error recovery: What UI patterns, verification pipelines, and constraint-checking methods most effectively detect hallucinations, validate LLM actions against data/visual state, and support user-driven correction loops?
- Safety and security: How to prevent prompt injection via embedded chart text, malicious data captions, or UI strings, and how to sandbox tool use and API calls within visualization systems?
- Cost, latency, and deployment: What are acceptable latency thresholds for interactive analysis, and which caching, streaming, or on-device strategies meet them while balancing cost, privacy, and environmental footprint?
- Standardized evaluation protocols: The field lacks shared, reproducible benchmarks for interactive visio-verbal tasks. What standardized tasks, datasets, and metrics (dialog turns, correction success, grounding accuracy, navigation efficacy, uncertainty handling) should be adopted?
- Ground-truth datasets: Where are open, diverse corpora of multimodal vis-dialog interactions with aligned visual states, deictic annotations, and gold-standard corrections to train and evaluate systems end-to-end?
- Cognitive and affective impacts: Do LLM-mediated interactions reduce or increase cognitive load, split attention, or overtrust? Which measures (beyond NASA-TLX) and study designs capture these effects rigorously?
- External validity and longitudinal use: Most evaluations are small-N lab studies. What do longitudinal, in-the-wild deployments reveal about learning effects, sustained trust, breakdowns, and real-world productivity?
- Collaboration and multi-user settings: How should systems handle shared context, role-based permissions, turn-taking, and conflict resolution when multiple users (and possibly multiple agents) co-analyze a visualization?
- Integration with mainstream tools: What generalizable, vendor-agnostic interfaces (e.g., Vega-Lite, VTK, D3, Tableau/Power BI/Notebooks APIs) enable reliable LLM tool-use and minimize brittle prompt-API bindings?
- Reporting and reproducibility: A community guideline is missing for disclosing prompts, toolchains, model versions, hyperparameters, datasets, and evaluation scripts to enable replication and fair comparison.
- Ethical and legal considerations: How should systems manage consent for voice/gesture capture, data provenance, bias/fairness in explanations, and regulatory compliance (e.g., HIPAA/GDPR) in domain-specific deployments?
- Custom/novel visualizations: How can LLMs be grounded on bespoke visual encodings with little to no training data (schema induction, programmatic semantics extraction, hybrid symbolic pipelines)?
- Robustness to input noise: How resilient are systems to ASR errors, accents, speech disfluencies, gesture tracking noise, and ambiguous references, and what error-tolerant dialog strategies work best?
- Agent architectures: What design patterns and evaluation criteria guide reliable multi-agent orchestration (planning, tool selection, conflict resolution, failure recovery) for complex visualization workflows?
- Environmental impact: How can we measure and minimize the energy/carbon costs of LLM-enabled visualization interactions at scale, and what on-device or distillation approaches are viable?
- Community consensus on taxonomies: How can the proposed classification be stress-tested, expanded (e.g., to include provenance/uncertainty/collaboration), and ratified by the community to support cumulative research?
Practical Applications
Immediate Applications
Based on the survey’s mapping of LLM roles across the visualization pipeline (data retrieval, transformation, visual encoding, sense‑making, navigation), interaction modalities (text, speech, spatial, GUI), and representations (charts, spatial/3D, networks), the following applications can be deployed today with guardrails and human‑in‑the‑loop design.
- Conversational BI and dashboard copilots (software, finance, energy, retail)
- What: Text chat to filter, aggregate, and visualize enterprise data, translate NL to SQL and to chart specs (e.g., Vega‑Lite), and summarize insights; refinement via follow‑up prompts.
- Tools/workflows: Plug‑ins for Tableau/Power BI/Looker; a “chat‑to‑Vega-Lite” service; RAG over warehouse schema docs; pattern similar to NL4DV‑LLM, ChartGPT, Data Formulator.
- Assumptions/dependencies: Clean metadata/schema grounding; secure data access; JSON/constrained chart generation; provenance display; latency/cost budgeting; human validation for critical use.
- Notebook assistants for exploratory data analysis (industry and academia)
- What: In‑notebook agent that generates code and plots from NL requests, performs basic data transformation and quick checks.
- Tools/workflows: Jupyter/VS Code extensions; “explain this plot” and “refactor to reusable function” helpers; few‑shot prompt libraries.
- Assumptions/dependencies: Sandboxed code execution; reproducibility logs; org‑specific style guides.
- Natural‑language authoring of charts for newsroom and marketing teams (media, communications)
- What: Rapid generation of publishable charts from briefs and CSVs, auto‑generated captions, with iterative NL edits.
- Tools/workflows: Chart authoring copilots; newsroom templates; integration with CMS; patterns akin to ChartGPT/Data Formulator.
- Assumptions/dependencies: Editorial review; bias/hallucination checks; brand style constraints.
- Accessible visualization layers for blind/low‑vision users (education, policy portals, daily life)
- What: Auto alt‑text, conversational Q&A about charts, verbal descriptions of trends/extrema, simple “what if I change the range?” interactions.
- Tools/workflows: Screen‑reader‑aware chart semantics extraction; Q&A overlay like VizAbility/VizChat; TTS integration.
- Assumptions/dependencies: Accurate chart semantics; safe handling of uncertainty; human review for high‑stakes content.
- In‑app explanation coaches for visualization literacy (education, enterprise training)
- What: On‑demand explanations of encodings, tasks (“find anomalies”), and step‑by‑step guides for reading a chart.
- Tools/workflows: Tutoring overlays; adaptive hinting similar to InsightLens; embedded micro‑lessons.
- Assumptions/dependencies: Calibration to user literacy; robust prompt design; avoid overconfident claims.
- Voice control for hands‑busy or sterile environments (healthcare, manufacturing, AR)
- What: Voice commands to pan/zoom, toggle layers, step through slices, and annotate—useful in operating rooms and on shop floors.
- Tools/workflows: ASR+LLM command interpreter; limited, verifiable command sets; noise‑robust microphones; patterns like ARAS.
- Assumptions/dependencies: Safety interlocks; confirmation prompts; offline/on‑prem models for privacy.
- Conversational GIS for planners and citizens (public sector, urban planning)
- What: Ask for “schools within 1 km of bus stops,” generate/adjust thematic layers, and request simple spatial summaries.
- Tools/workflows: NL‑to‑GIS operator chains; map layer toggling; systems akin to Autonomous GIS, CityGPT, MapIO.
- Assumptions/dependencies: Accurate geocoding; access to authoritative geodata; compute for spatial ops.
- Knowledge‑graph exploration with NL (biomed, cybersecurity, R&D)
- What: Query and traverse KGs to surface paths, clusters, and related entities with contextualized subgraph highlights.
- Tools/workflows: KG+RAG assistance; explainer panels that cite nodes/edges; patterns similar to KnowNet/Tailor‑Mind.
- Assumptions/dependencies: Curated ontologies; entity disambiguation; explanation faithfulness.
- Collaborative analysis summarization and rationale capture (enterprise analytics, research teams)
- What: Summarize conversational analysis threads, extract decisions and open questions, and link them to views/filters.
- Tools/workflows: Chat summarizers (e.g., InterChat‑like) + session logs; “meeting minutes from dashboard exploration.”
- Assumptions/dependencies: Privacy controls; attribution to specific views/queries; user approval before record.
- Citizen‑facing open‑data portals with chat+viz (policy, civic tech)
- What: Citizens ask questions (“crime trends by neighborhood”), receive charts and plain‑language explanations with downloadable data.
- Tools/workflows: Safe defaults; curated datasets; data dictionary grounding; red‑team prompts for safety.
- Assumptions/dependencies: Guardrails against misinterpretation; rate limits; accessibility compliance.
- Light‑weight graph/network viewers with NL controls (IT operations, org charts, supply chains)
- What: “Highlight shortest path between A and B,” “filter nodes with degree > 10,” “color by community.”
- Tools/workflows: NL‑to‑graph queries; explain/preview transformations before apply; reversible changes.
- Assumptions/dependencies: Clear graph schema; command preview/undo; performance on large graphs.
- Low‑code whiteboard‑to‑chart/diagram helpers (product/design teams)
- What: From a sketched chart or bullet list, produce a clean visualization and iterate via NL edits.
- Tools/workflows: Image understanding + chart synthesis for simple cases; Smartboard‑style flows.
- Assumptions/dependencies: Works best for standard charts; human review of mappings.
Long‑Term Applications
As identified by the survey, further progress is needed in spatial reasoning, grounding, evaluation, and reliable autonomy. The following applications require advances in models, tooling, standards, or scale.
- Point‑and‑talk multimodal interaction with precise spatial grounding (software/UI, AR/VR)
- What: Robust deictic gestures + speech (“make these bars log‑scaled,” “compare this cluster to that one”) across charts and complex views.
- Tools/workflows: VLMs with fine‑grained grounding to chart grammar; gaze/gesture fusion; error‑aware confirmations.
- Assumptions/dependencies: Better spatial reasoning and alignment with visualization semantics; sensor fusion; latency constraints.
- Autonomous “data‑to‑insight” agents with verifiable reasoning (executive analytics, consulting)
- What: From a high‑level prompt, fetch data, validate, construct dashboards, run statistical tests, craft narratives, and track provenance.
- Tools/workflows: Multi‑agent orchestration (retrieval, analysis, viz, verification); chain‑of‑verification; provenance overlays.
- Assumptions/dependencies: Reliability benchmarks; auditable pipelines; organizational governance.
- Advanced 3D scientific visualization copilots (healthcare imaging, engineering simulation)
- What: Natural‑language camera planning, view suggestions, and explanation over volumetric/3D data; semantic linking to domain structures.
- Tools/workflows: 3D‑aware VLMs (e.g., 3D‑LLaVA‑like) trained on labeled volumetric scenes; physics‑/anatomy‑aware grounding.
- Assumptions/dependencies: Large, domain‑specific 3D datasets; regulatory/safety validation.
- Automated detector and fixer of misleading or low‑quality visualizations (media, policy, education)
- What: Identify chartjunk, misleading encodings, or cherry‑picked ranges; propose improved encodings and quantify uncertainty.
- Tools/workflows: Static/dynamic chart parsers + critique LLM; style/ethics checks; suggestion UI with rationales.
- Assumptions/dependencies: Standards for visualization quality; ground‑truth evaluation corpora.
- Personalized visualization tutors with learner models (education at scale)
- What: Adaptive scaffolding, Socratic Q&A, and progression based on student misconceptions and performance with interactive charts.
- Tools/workflows: Student model + content sequencing; integration into LMS; rich assessment alignment.
- Assumptions/dependencies: Privacy/security; efficacy trials; curricular standards.
- Real‑time conversational control in mission‑critical operations (energy grid, transportation, defense)
- What: Voice/NL to query telemetry, run what‑if analyses, and adjust views with strict safety bounds and approvals.
- Tools/workflows: On‑prem models; deterministic tool invocation; dual‑channel confirmations; fail‑safe modes.
- Assumptions/dependencies: Certification; latency SLAs; incident forensics.
- On‑prem domain‑secure LLMs integrated with analytics stacks (finance, healthcare)
- What: Organization‑fine‑tuned models for NL‑to‑viz and explanations without data egress; continuous learning from safe logs.
- Tools/workflows: Private model serving; data catalog grounding; MLOps for prompt/policy updates.
- Assumptions/dependencies: Hardware budgets; compliance audits; model lifecycle management.
- Multisensory accessibility for data (public services, assistive tech)
- What: Haptic/vibrotactile maps and chart encodings, ASL avatar explanations, and adaptive auditory displays guided by LLMs.
- Tools/workflows: Device APIs for haptics; semantic‑to‑haptic mapping standards; user personalization.
- Assumptions/dependencies: Hardware availability; usability research; standardization.
- Multi‑agent analysis orchestrators across tools (R, Python, GIS, simulation, viz)
- What: Agents that delegate to specialized tools (stats tests, geospatial ops, simulations) and integrate results into coherent visual narratives.
- Tools/workflows: Toolformer‑style function calling; agentic schedulers; verification layers and sandboxing.
- Assumptions/dependencies: Robust tool APIs; error handling; cost control.
- Embedded evaluation and benchmarking frameworks for LLM+viz systems (academia, vendors)
- What: Standard tasks, datasets, and logs to measure accuracy, usability, trust, and spatial grounding; in‑product telemetry for iterative improvement.
- Tools/workflows: Shared benchmarks for chart understanding and NL‑to‑viz; reproducible task suites; privacy‑preserving logging.
- Assumptions/dependencies: Community consensus; de‑identification methods; continuous evaluation pipelines.
Notes on Cross‑Cutting Dependencies
- Reliability and trust: Hallucination risks, especially for spatial reasoning and contextual grounding, require constrained generation, tool use, provenance displays, and human oversight in high‑stakes settings.
- Data governance: Secure connectors, role‑based access control, and on‑prem deployment may be necessary for regulated data.
- Latency and cost: Real‑time interactions (voice, AR/VR) demand low‑latency inference and possibly edge/on‑device models.
- Domain grounding: Performance improves with curated schemas, ontologies, and exemplars (RAG, few‑shot libraries).
- Accessibility and inclusivity: Interfaces should support screen readers, multiple languages, and multimodal inputs to reach broader audiences.
- Evaluation: Meaningful user and system evaluations (task success, error rates, satisfaction) are necessary to assess LLM+viz systems in practice.
Glossary
- Agent-based architectures: System designs that decompose functionality across multiple interacting software agents (often specialized LLM components). "from prompting and fine-tuning to multimodal and agent-based architectures"
- Chain-of-shot: A prompting strategy (akin to chain-of-thought) that elicits intermediate reasoning steps by providing stepwise examples. "Prompt engineering : Structure of system prompts, use of few-shot, chain-of-shot"
- Conditioning: Supplying constraints, context, or examples to steer a model’s outputs toward desired formats or behaviors. "With appropriate conditioning, LLMs are also proficient at generating code or structured data"
- Contextual grounding: Anchoring a model’s responses in the specific data, visualization, or task context to ensure relevance and correctness. "limitations of current LLMs in spatial reasoning and contextual grounding"
- Data State Reference Model: A conceptual model describing how information progresses from raw data through transformations to visual representation and perception. "the data state reference model"
- Deictic gestures: Pointing or indicating gestures that reference objects or locations in a shared visual space. "deictic gestures and speech (pointing and talking)"
- Elsevier's three-tiered disciplines taxonomy: A hierarchical classification scheme for academic disciplines used to code application domains. "we coded papers using the Elsevier's three-tiered disciplines taxonomy"
- Exploratory Data Analysis (EDA): An iterative, visual and statistical approach to discovering patterns, anomalies, and insights in data. "Exploratory Data Analysis (EDA)"
- Explicit memory modules: External memory components that LLMs can query to retrieve stored knowledge or prior interactions. "explicit memory modules"
- Few-shot: Prompting with a small number of examples to condition an LLM to perform a task. "use of few-shot, chain-of-shot"
- Knowledge Base Question Answering (KBQA): Answering user queries by retrieving facts from a structured knowledge base. "Natural Language Knowledge Base Question Answering (KBQA)"
- Knowledge generation model (visual analytics): A framework describing how insights are formed through interactions between users, data, and analytic/visual tools. "knowledge generation model in visual analytics"
- Knowledge graphs: Structured representations of entities and their relationships, typically used for semantic querying and reasoning. "representing networks (social networks, knowledge graphs)"
- Long-term memory: Mechanisms that allow systems to retain and retrieve information across sessions, enabling adaptation over time. "long-term memory, i.e. means of retrieving of knowledge and data from external storage sources"
- Mid-air gestures: Freehand movements detected without contact (e.g., in front of a sensor) for spatial interaction. "mid-air gestures"
- Multi-agent systems: Architectures where multiple specialized agents (often LLMs) collaborate to execute complex tasks. "Multi-agent capabilities: Architecture of systems involving multiple specialized agents"
- Multimodal: Involving multiple input/output channels (e.g., text, speech, images) for interaction or learning. "intuitive, multimodal, and accessible interfaces"
- NASA-TLX: A standardized instrument for assessing perceived workload across multiple dimensions. "NASA-TLX"
- Natural Language Interfaces to Data (NLID): Systems that translate natural language queries into formal data operations (e.g., SQL). "Natural Language Interfaces to Data (NLID)"
- NLP: The field focused on computational handling and understanding of human language. "NLP"
- PRISMA-2020: A set of guidelines for transparent, rigorous reporting in systematic literature reviews. "PRISMA-2020 guidelines"
- Prompt engineering: Crafting and structuring inputs to guide LLM behavior effectively. "Prompt engineering : Structure of system prompts, use of few-shot, chain-of-shot"
- Retrieval-Augmented Generation (RAG): Augmenting LLM outputs by first retrieving relevant documents or facts for grounding. "Retrieval-Augmented Generation (RAG)"
- Sense-making: The process of interpreting and organizing information to derive meaning and insights. "support data sense-making"
- Spatial interaction: Interaction techniques that leverage spatial input (e.g., touch, gestures) in relation to on-screen or physical space. "Spatial interaction. \textcite{besancon_spatial_interfaces_2021} identify four spatial interaction paradigms"
- Spatial reasoning: The ability to understand and manipulate spatial relationships among objects. "limitations of current LLMs in spatial reasoning and contextual grounding"
- SUS (System Usability Scale): A widely used questionnaire for assessing perceived usability of systems. "SUS usability scales"
- Transformer architecture: A neural network architecture using self-attention mechanisms, foundational to modern LLMs. "based on the transformer architecture"
- Vega-Lite: A high-level, declarative grammar for creating interactive data visualizations. "Vega-Lite"
- VLMs (Vision-LLMs): Models trained to jointly process visual and textual inputs for multimodal tasks. "VLMs \cite{kamath_spatial_reasoning_2023}"
- View transformation: Adjusting the viewpoint or visible extent of a visualization (e.g., zoom, pan) without altering data mappings. "view transformation"
- Visio-verbal interaction: Interaction that combines visual and verbal (language) modalities to support understanding. "visio-verbal interaction---where verbal and visual modalities converge to support data sense-making."
- Visual analytics: The integration of interactive visual interfaces with analytic techniques to support insight generation. "visual analytics"
- Visual encoding: Mapping data attributes to visual channels (e.g., position, color, size) in a visualization. "Visual encoding. This step maps data fields to visual representations."
- Visual mapping: The assignment of data to visual structures and channels within a chosen representation. "visual mapping"
- Visualization pipeline: The end-to-end process from data acquisition and transformation to visual mapping and interaction. "across the visualization pipeline"
- Visualization Recommendation Systems (VisRec): Systems that automatically suggest suitable visualizations based on data and tasks. "Natural Language Visualization Recommendation Systems (VisRec)"
- V-NLI (Natural Language Interaction for visualization): Using natural language to interact with and manipulate existing visualizations. "Natural Language Interaction for visualization (V-NLI)"
- Volumetric representations: 3D visualizations that depict values throughout a volume (e.g., medical scans). "volumetric representations"
Collections
Sign up for free to add this paper to one or more collections.

