- The paper introduces Charts-of-Thought, a novel structured prompting method that significantly boosts LLM visualization literacy scores.
- Its experimental analysis using a modified VLAT shows marked performance improvements across various state-of-the-art models and visualization challenges.
- Results indicate that structured analytical guidance can elevate LLMs to outperform human baselines in complex visual data interpretation tasks.
Enhancing LLM Visualization Literacy
The paper "Charts-of-Thought: Enhancing LLM Visualization Literacy Through Structured Data Extraction" explores the visualization literacy capabilities of LLMs and introduces a novel prompting method called Charts-of-Thought. This work involved testing multiple state-of-the-art models using the Visualization Literacy Assessment Test (VLAT) and developing techniques to guide these models through structured analytic processes. The results present significant performance improvements, establishing a new benchmark for visualization tasks.
Introduction
Visualization literacy, defined as the skill to understand and interpret visual representations, is critical as data visualizations become more widespread. Existing assessments like the VLAT have revealed limitations in current LLM capabilities compared to human performance. The paper hypothesizes that these deficiencies are due not to intrinsic model limitations but rather to the lack of structured analysis guidance. Inspired by human cognitive strategies and the Chain-of-Thought prompting technique, the researchers propose the Charts-of-Thought approach. This method systematically guides LLMs through data extraction, verification, and answer formulation phases, mirroring human visual interpretation processes.
Methodology
LLMs Evaluated
Three advanced multimodal LLMs were selected due to their capabilities and availability:
- Claude-3.7-sonnet: Latest from Anthropic, excelling in multimodal tasks.
- GPT-4.5-preview: OpenAI's leading model, notable for its reasoning capabilities.
- Gemini-2.0-pro: Google's latest product, praised for its versatility.
Experimental Design
The VLAT was chosen to evaluate these models through both the original and modified setups. Modifications included new data points to prevent memorization bias, ensuring the validity of assessments. The prompting was categorized as Generic Prompting and Charts-of-Thought Prompting, where the latter involved a multi-step process guiding LLMs through data analysis akin to human reasoning. The series of tasks required models to engage systematically, extracting and sorting data, verifying, and providing answers based on structured data tables.
Prompting Approaches
Two approaches were compared:
- Generic Prompt: Simplistic instructions similar to past studies.
- Charts-of-Thought Prompt: Elaborate step-by-step guidance for systematic data extraction and analysis intended to address previous limitations.
Experiments and Results
Modified VLAT
Overall Performance
The study demonstrated clear improvements across all models with Charts-of-Thought prompting. Claude-3.7-sonnet achieved remarkably higher scores, surpassing human baselines, while other models also showed significant gains compared to standard prompting methods.
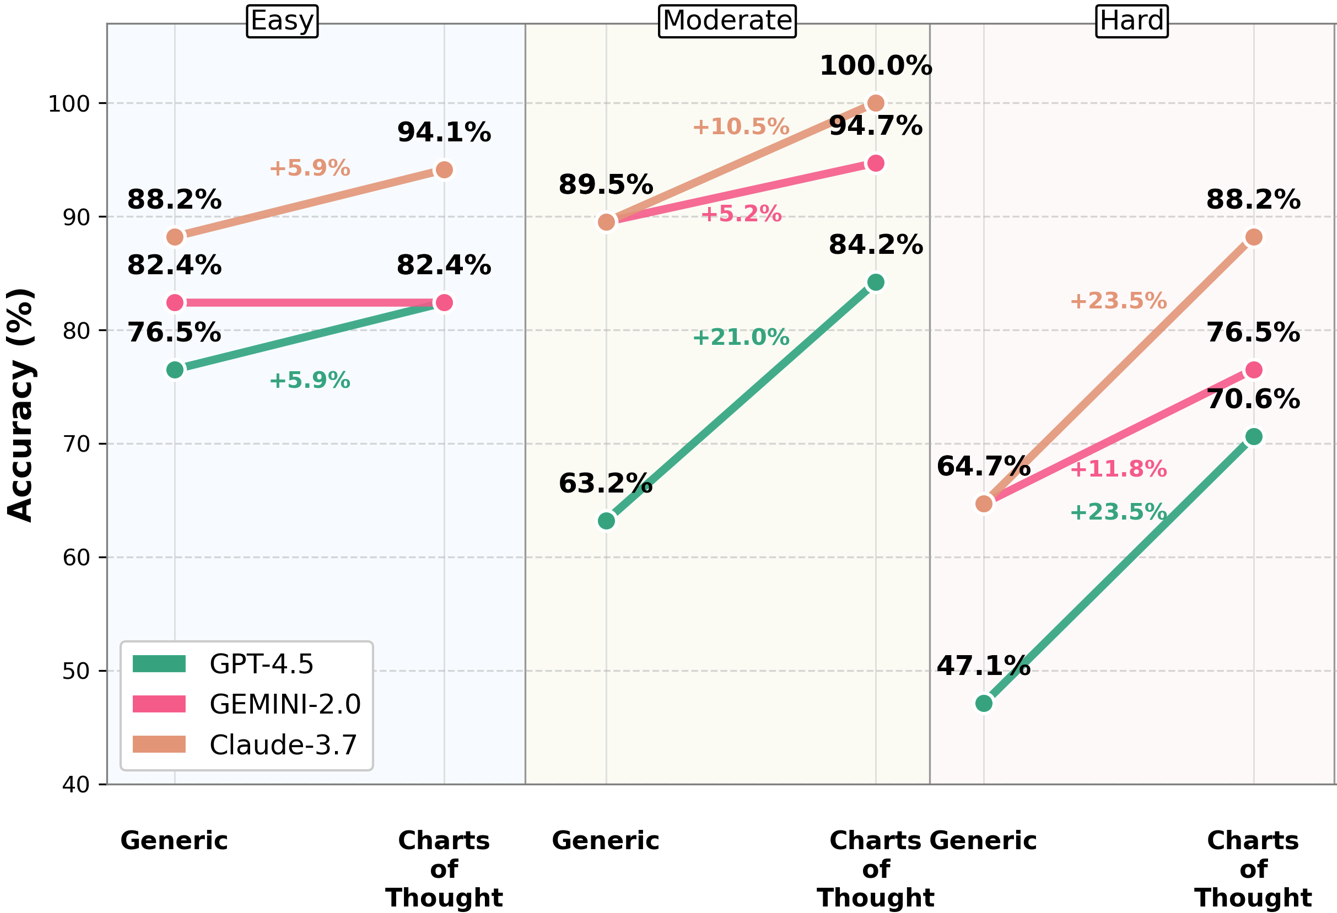
Figure 1: Modified VLAT results by question difficulty showing improvements across Easy, Moderate, and Hard questions for all three LLM models.
The structured prompting benefited harder questions substantially, with Claude-3.7-sonnet achieving near-perfect scores on previously challenging tasks.
The analysis reveals consistent improvements in complex analytical tasks such as value retrieval and trend identification using structured prompting, contrary to earlier beliefs that these were inherent weaknesses in LLM performance.
Original VLAT Results
Testing on the original VLAT showed that Charts-of-Thought prompting led to outstanding performance improvements compared to previous generations of LLMs, including a significant leap in comparison to human baselines.
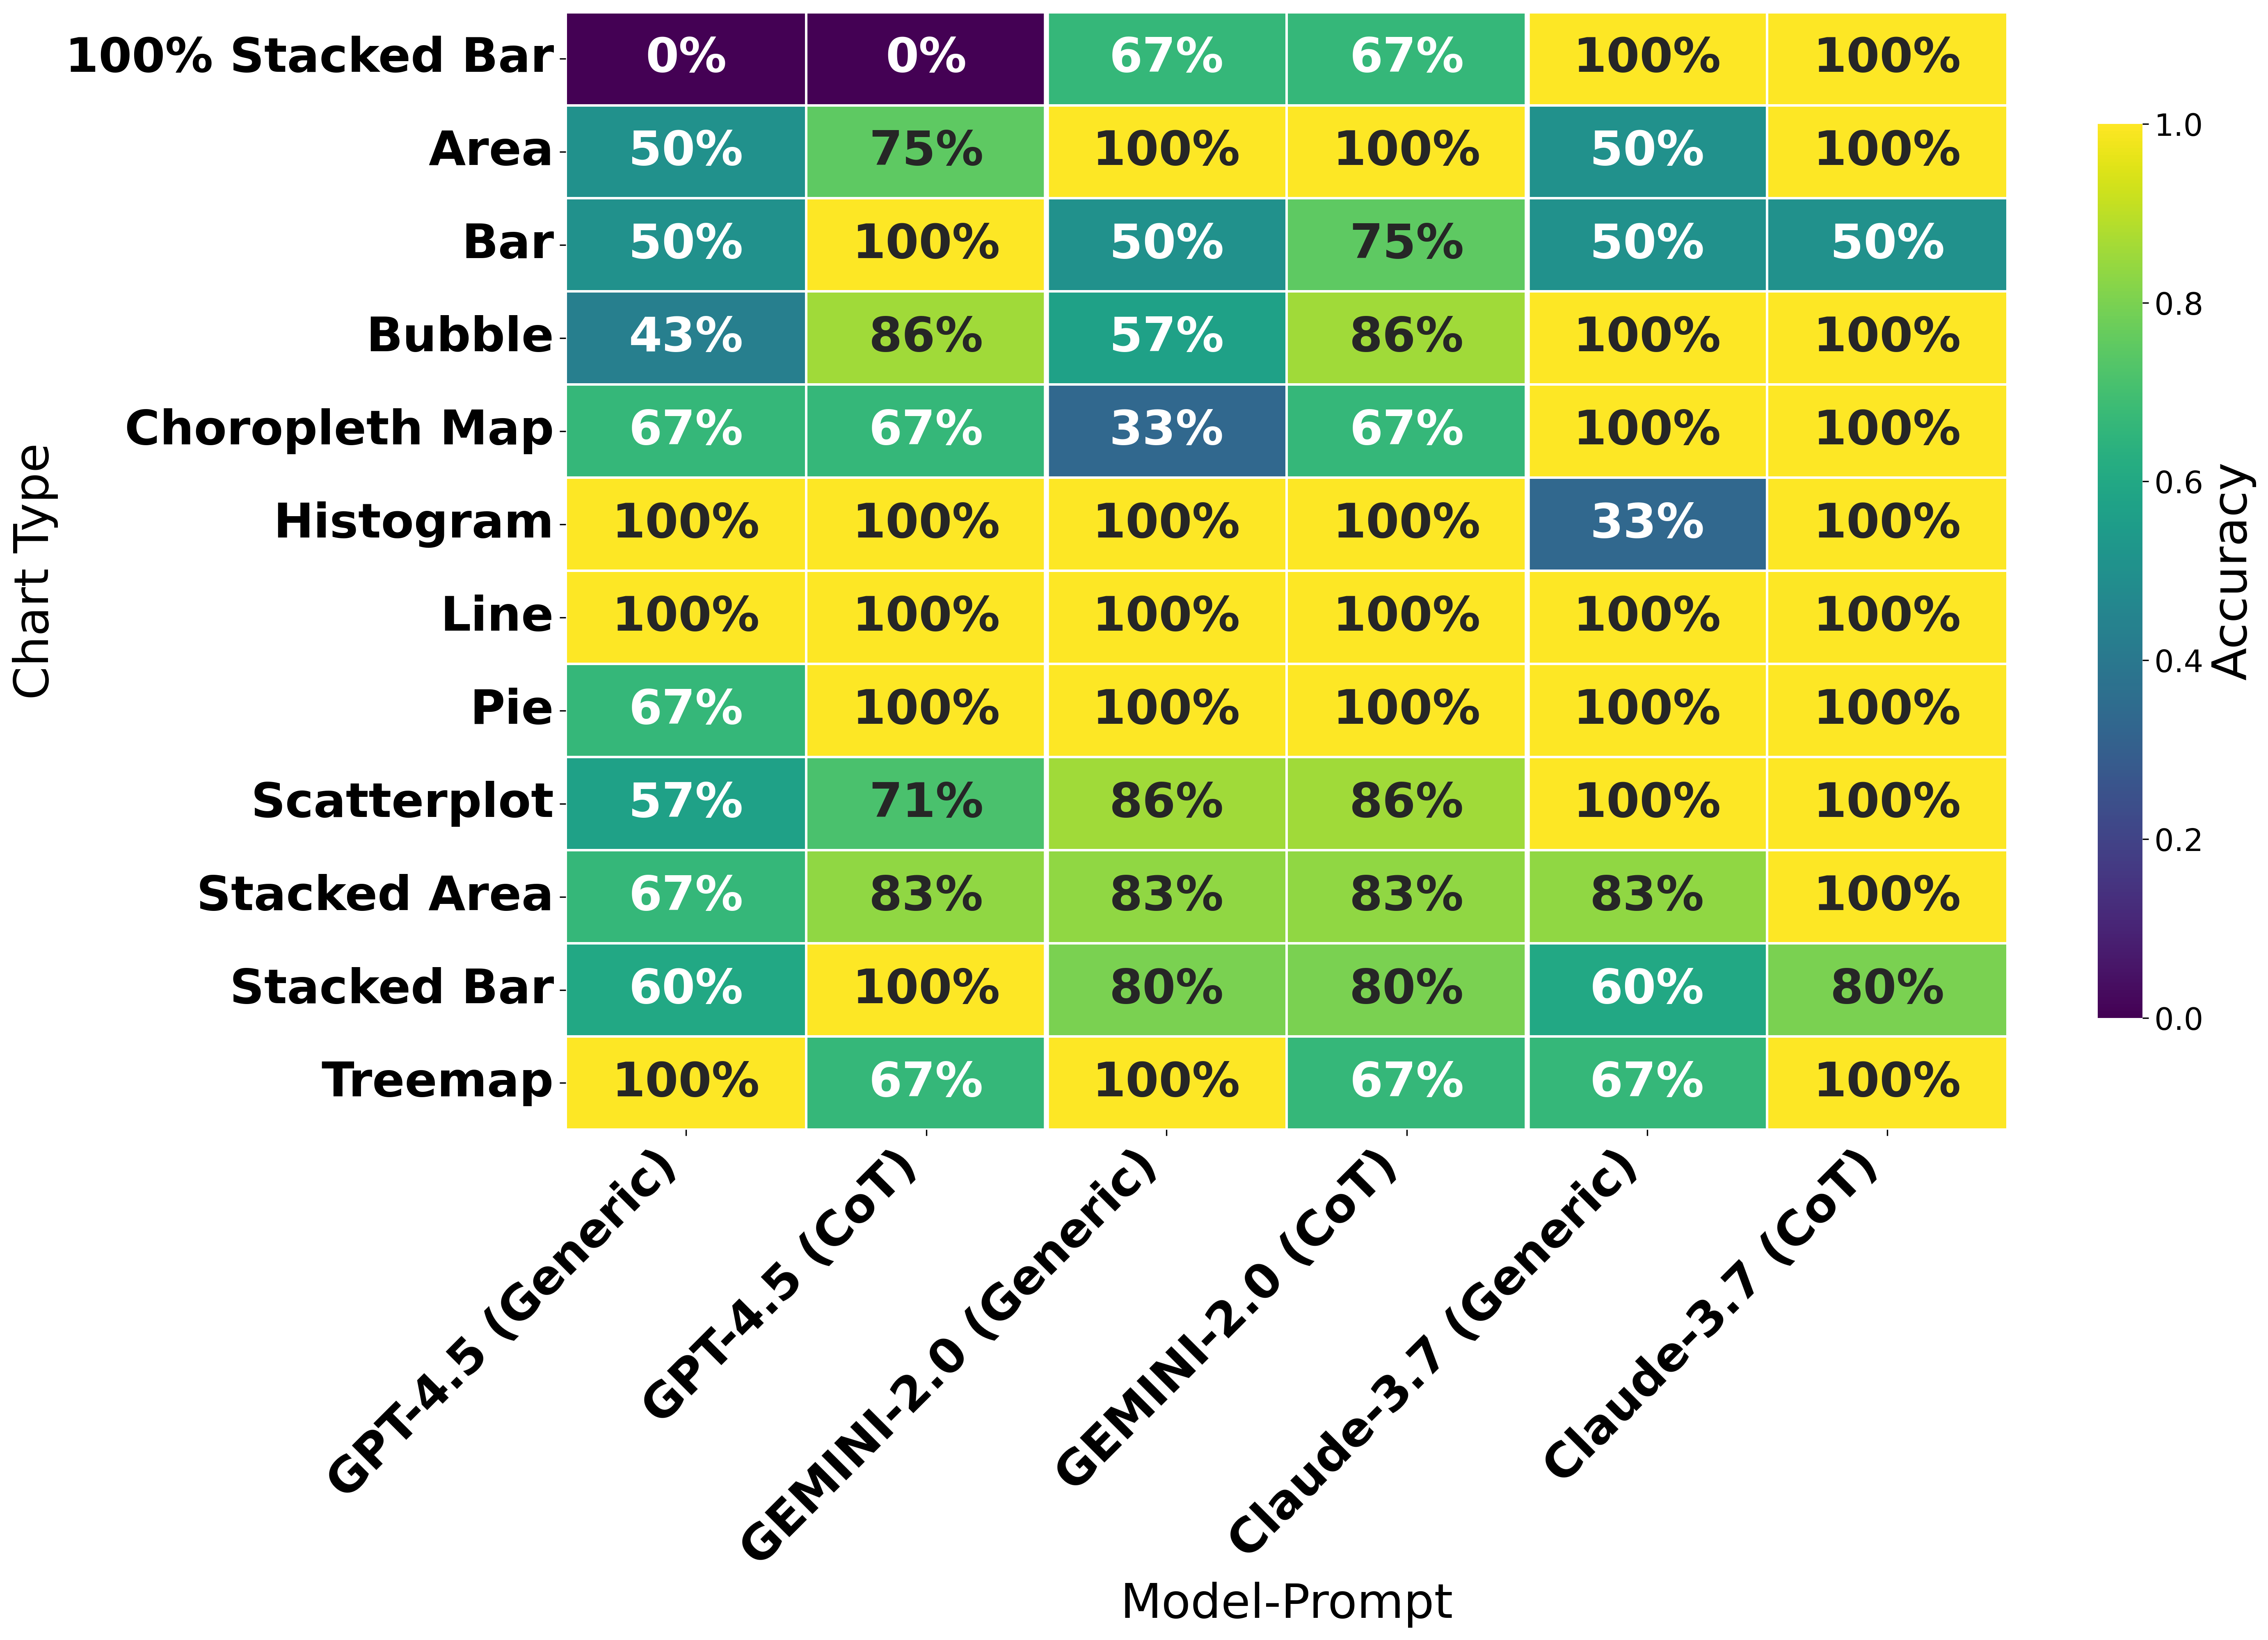
Figure 2: Original VLAT results by chart type showing performance differences between prompting strategies across 12 visualization types.
Conclusion
The investigation underscores the potential of structured prompting in enhancing LLM capabilities far beyond their traditional limits. This advancement not only sets a new standard for LLM visualization literacy but also hints at future integration possibilities in automated visualization tasks and human-machine interactive systems. However, challenges such as complex visualizations, and color interpretation remain, suggesting avenues for further enhancement and specialized developments.
The findings advocate for the integration of structured prompts like Charts-of-Thought in diverse applications to improve accessibility and comprehensibility of visual data, pointing to significant implications across research, education, and professional data analysis sectors. Future exploration could focus on modifying this approach for specific visualization styles and expanding to other complex areas of model interpretation.

