- The paper introduces CharTool, a tool-integrated framework that augments multimodal reasoning with image cropping and code computation for detailed chart analysis.
- It leverages the DuoChart dataset, combining synthetic and real-world charts to capture diverse visual layouts and improve training fidelity.
- Experimental results demonstrate that CharTool outperforms leading models on multiple benchmarks and generalizes to out-of-domain visual-mathematical tasks.
Motivation and Problem Setting
Chart understanding poses persistent challenges for multimodal LLMs (MLLMs) due to the dual necessity of fine-grained visual grounding and precise numerical reasoning. Conventional approaches, often based on synthetic template-driven data, lack the visual diversity and complexity encountered in real-world scientific and financial charts. Furthermore, typical MLLM architectures relying purely on internal textual reasoning exhibit limited capacity for localized perceptual analysis and explicit computation, resulting in poor generalization to complex chart layouts and dense multi-subplot figures.
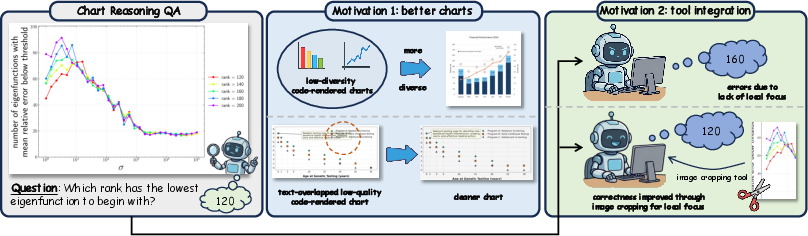
Figure 1: Chart reasoning mandates both localized visual perception and intricate numerical analysis; synthetic datasets often lack chart diversity, and text-only reasoning produces errors on complex charts, in contrast to tool-grounded approaches.
DuoChart: Dual-Source Chart Data Synthesis
The paper introduces DuoChart, a data engine leveraging both synthesizable and real-world chart distributions to construct training datasets for chart reasoning. Synthetic charts, generated via an LLM-based code synthesis pipeline, provide controllable data fidelity and label precision, while mined real-world arXiv figures contribute essential visual richness and diverse spatial/structural configurations otherwise absent from code-driven methods. After an LLM-assisted, multi-stage filtering and alignment process, the authors construct a high-entropy data resource combining both chart types.
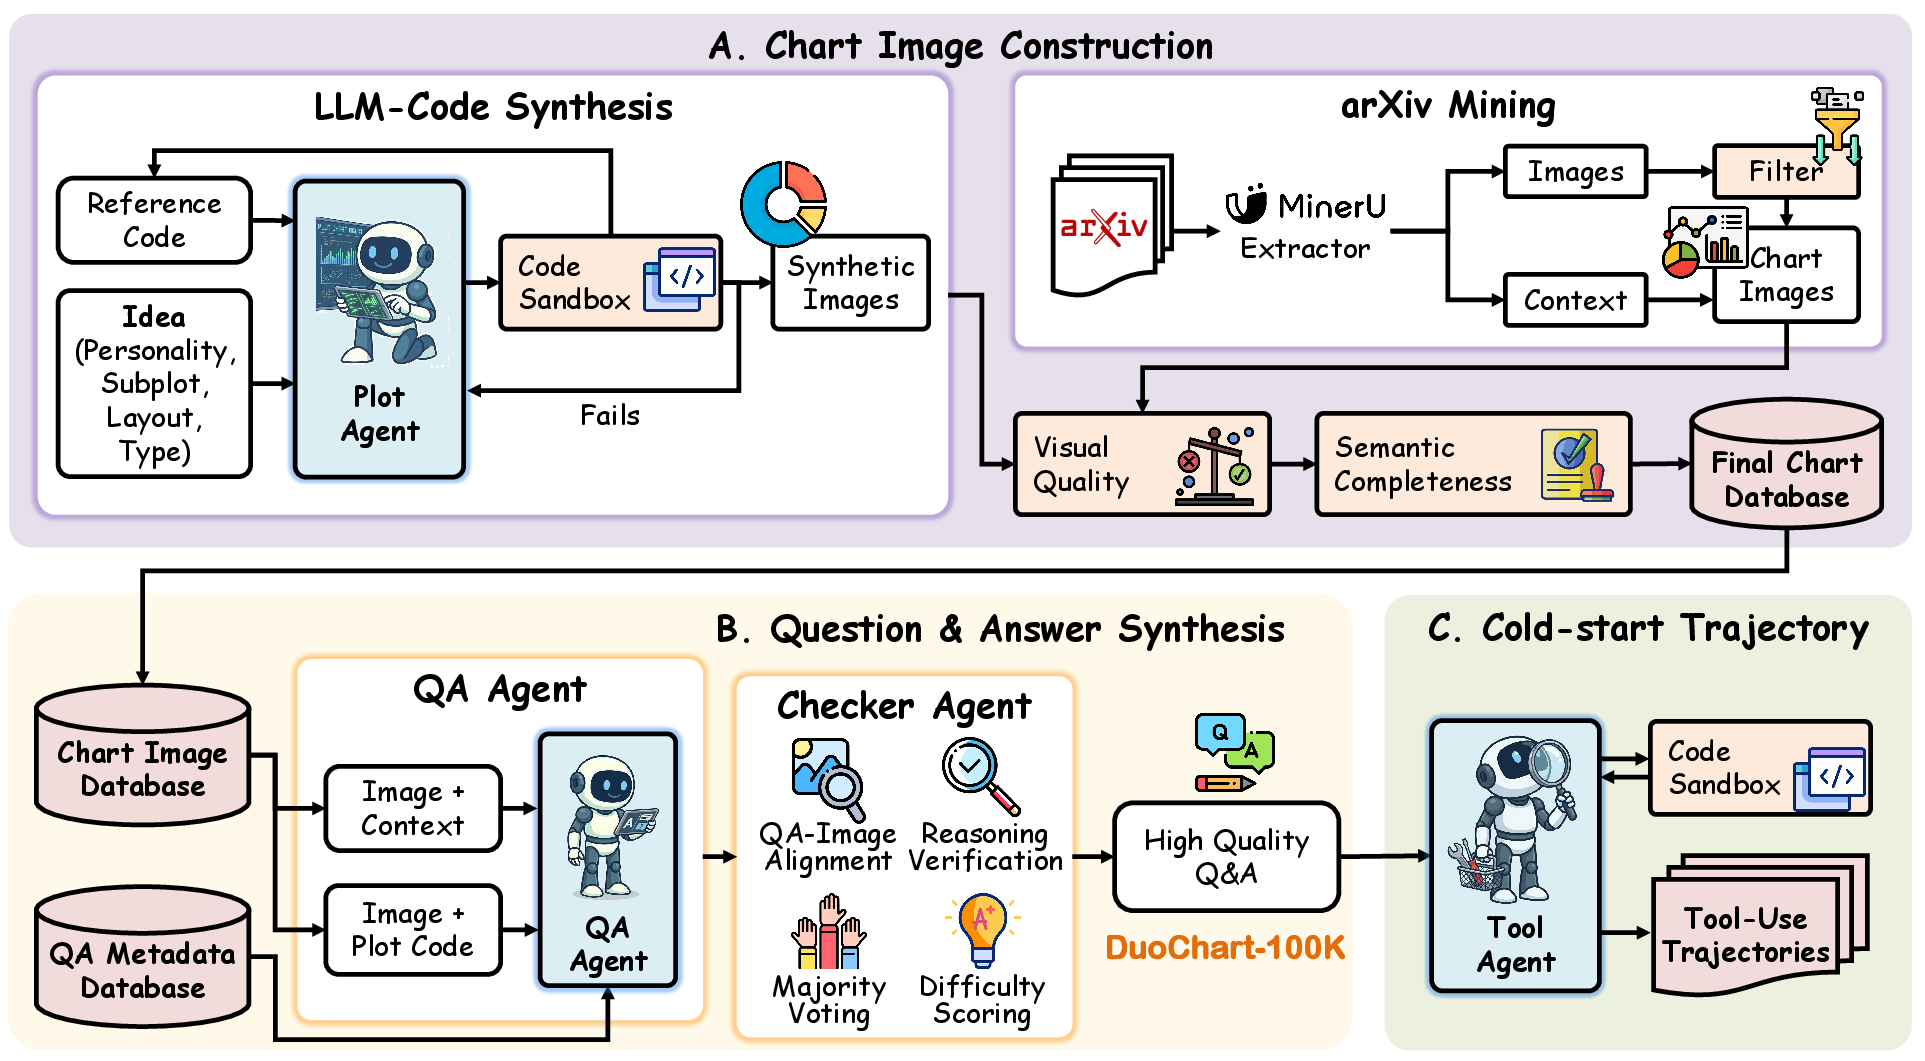
Figure 2: The DuoChart pipeline constructs charts through (A) dual-source synthesis/mining, (B) guided QA generation with multi-stage filtering, and (C) synthesis of demonstration trajectories for cold-start training.
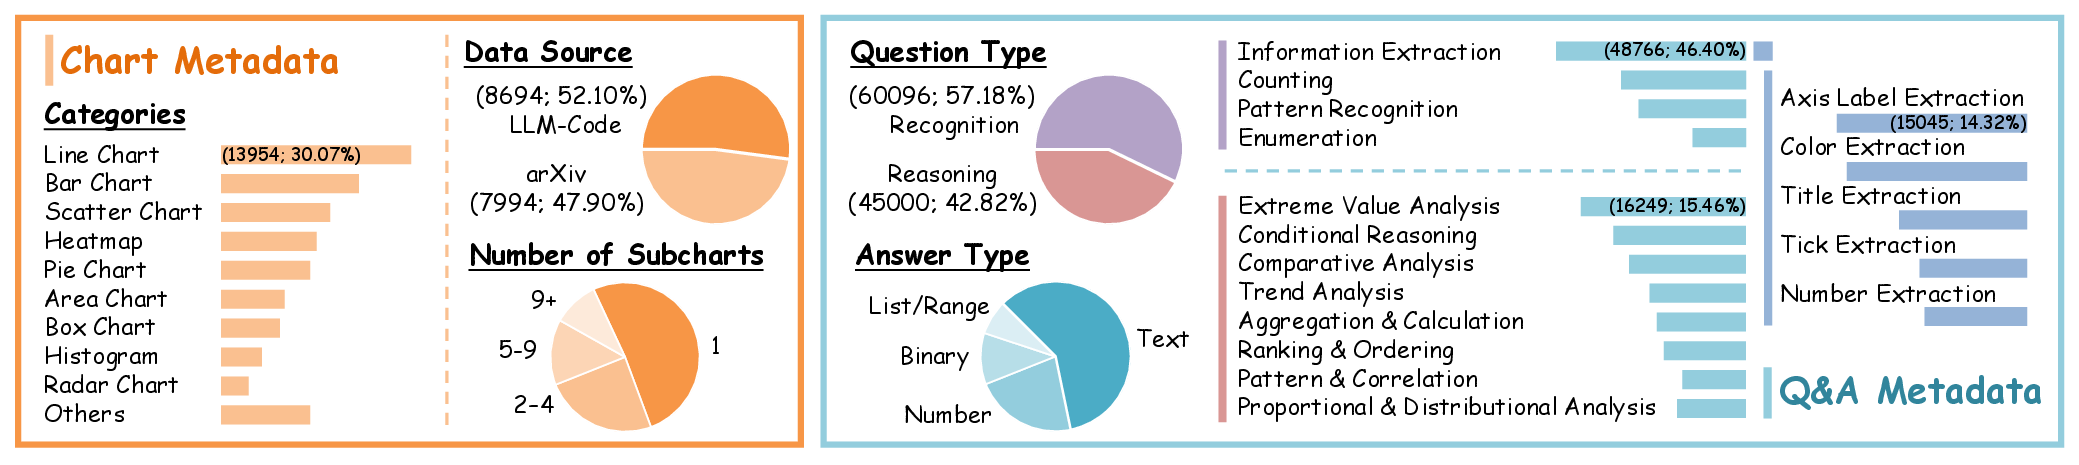
Figure 3: DuoChart achieves substantial coverage in chart type and question diversity, supporting broad generalization.
This hybrid construction yields DuoChart-100k, a dataset with challenging QA grounded in both synthetic and authentic figures. Evaluation metrics (e.g., GPT-5.2 judgment for visual quality, answer validity, and reasoning complexity) demonstrate superior fidelity and harder visual/numerical tasks relative to prior synthetic chart datasets.
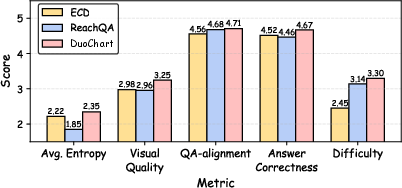
Figure 4: DuoChart outperforms previous datasets in visual quality, chart entropy, answer correctness, and reasoning complexity.
CharTool enables MLLMs to invoke external tools for explicit, symbolic manipulation during chart question answering. Two core tool modalities are employed:
- Image Cropping Tool: Enables fine-grained perceptual grounding by extracting contextually relevant subregions of the chart, supporting localized question answering and disambiguation in multi-subplot/multi-panel situations.
- Code Computation Tool: Provides executable, programmatic interfaces for precise numerical manipulation, supporting aggregation, statistical calculation, and structured data parsing from chart content.
Interaction between internal MLLM states and external tool responses is cast as a multi-turn trajectory optimized by agentic reinforcement learning. The policy πθ alternates internal reasoning steps with tool invocation, receiving trajectory-level rewards based on answer correctness, structural compliance, and productive tool use.
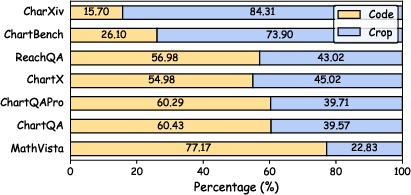
Figure 5: Distribution of tool calls by benchmark shows adaptive use—perception-dominant tasks trigger cropping, while computation-heavy benchmarks favor code-based execution.
Exemplar tool use trajectories further demonstrate CharTool’s strategic invocation of cropping and calculation tools for complex multi-step reasoning.
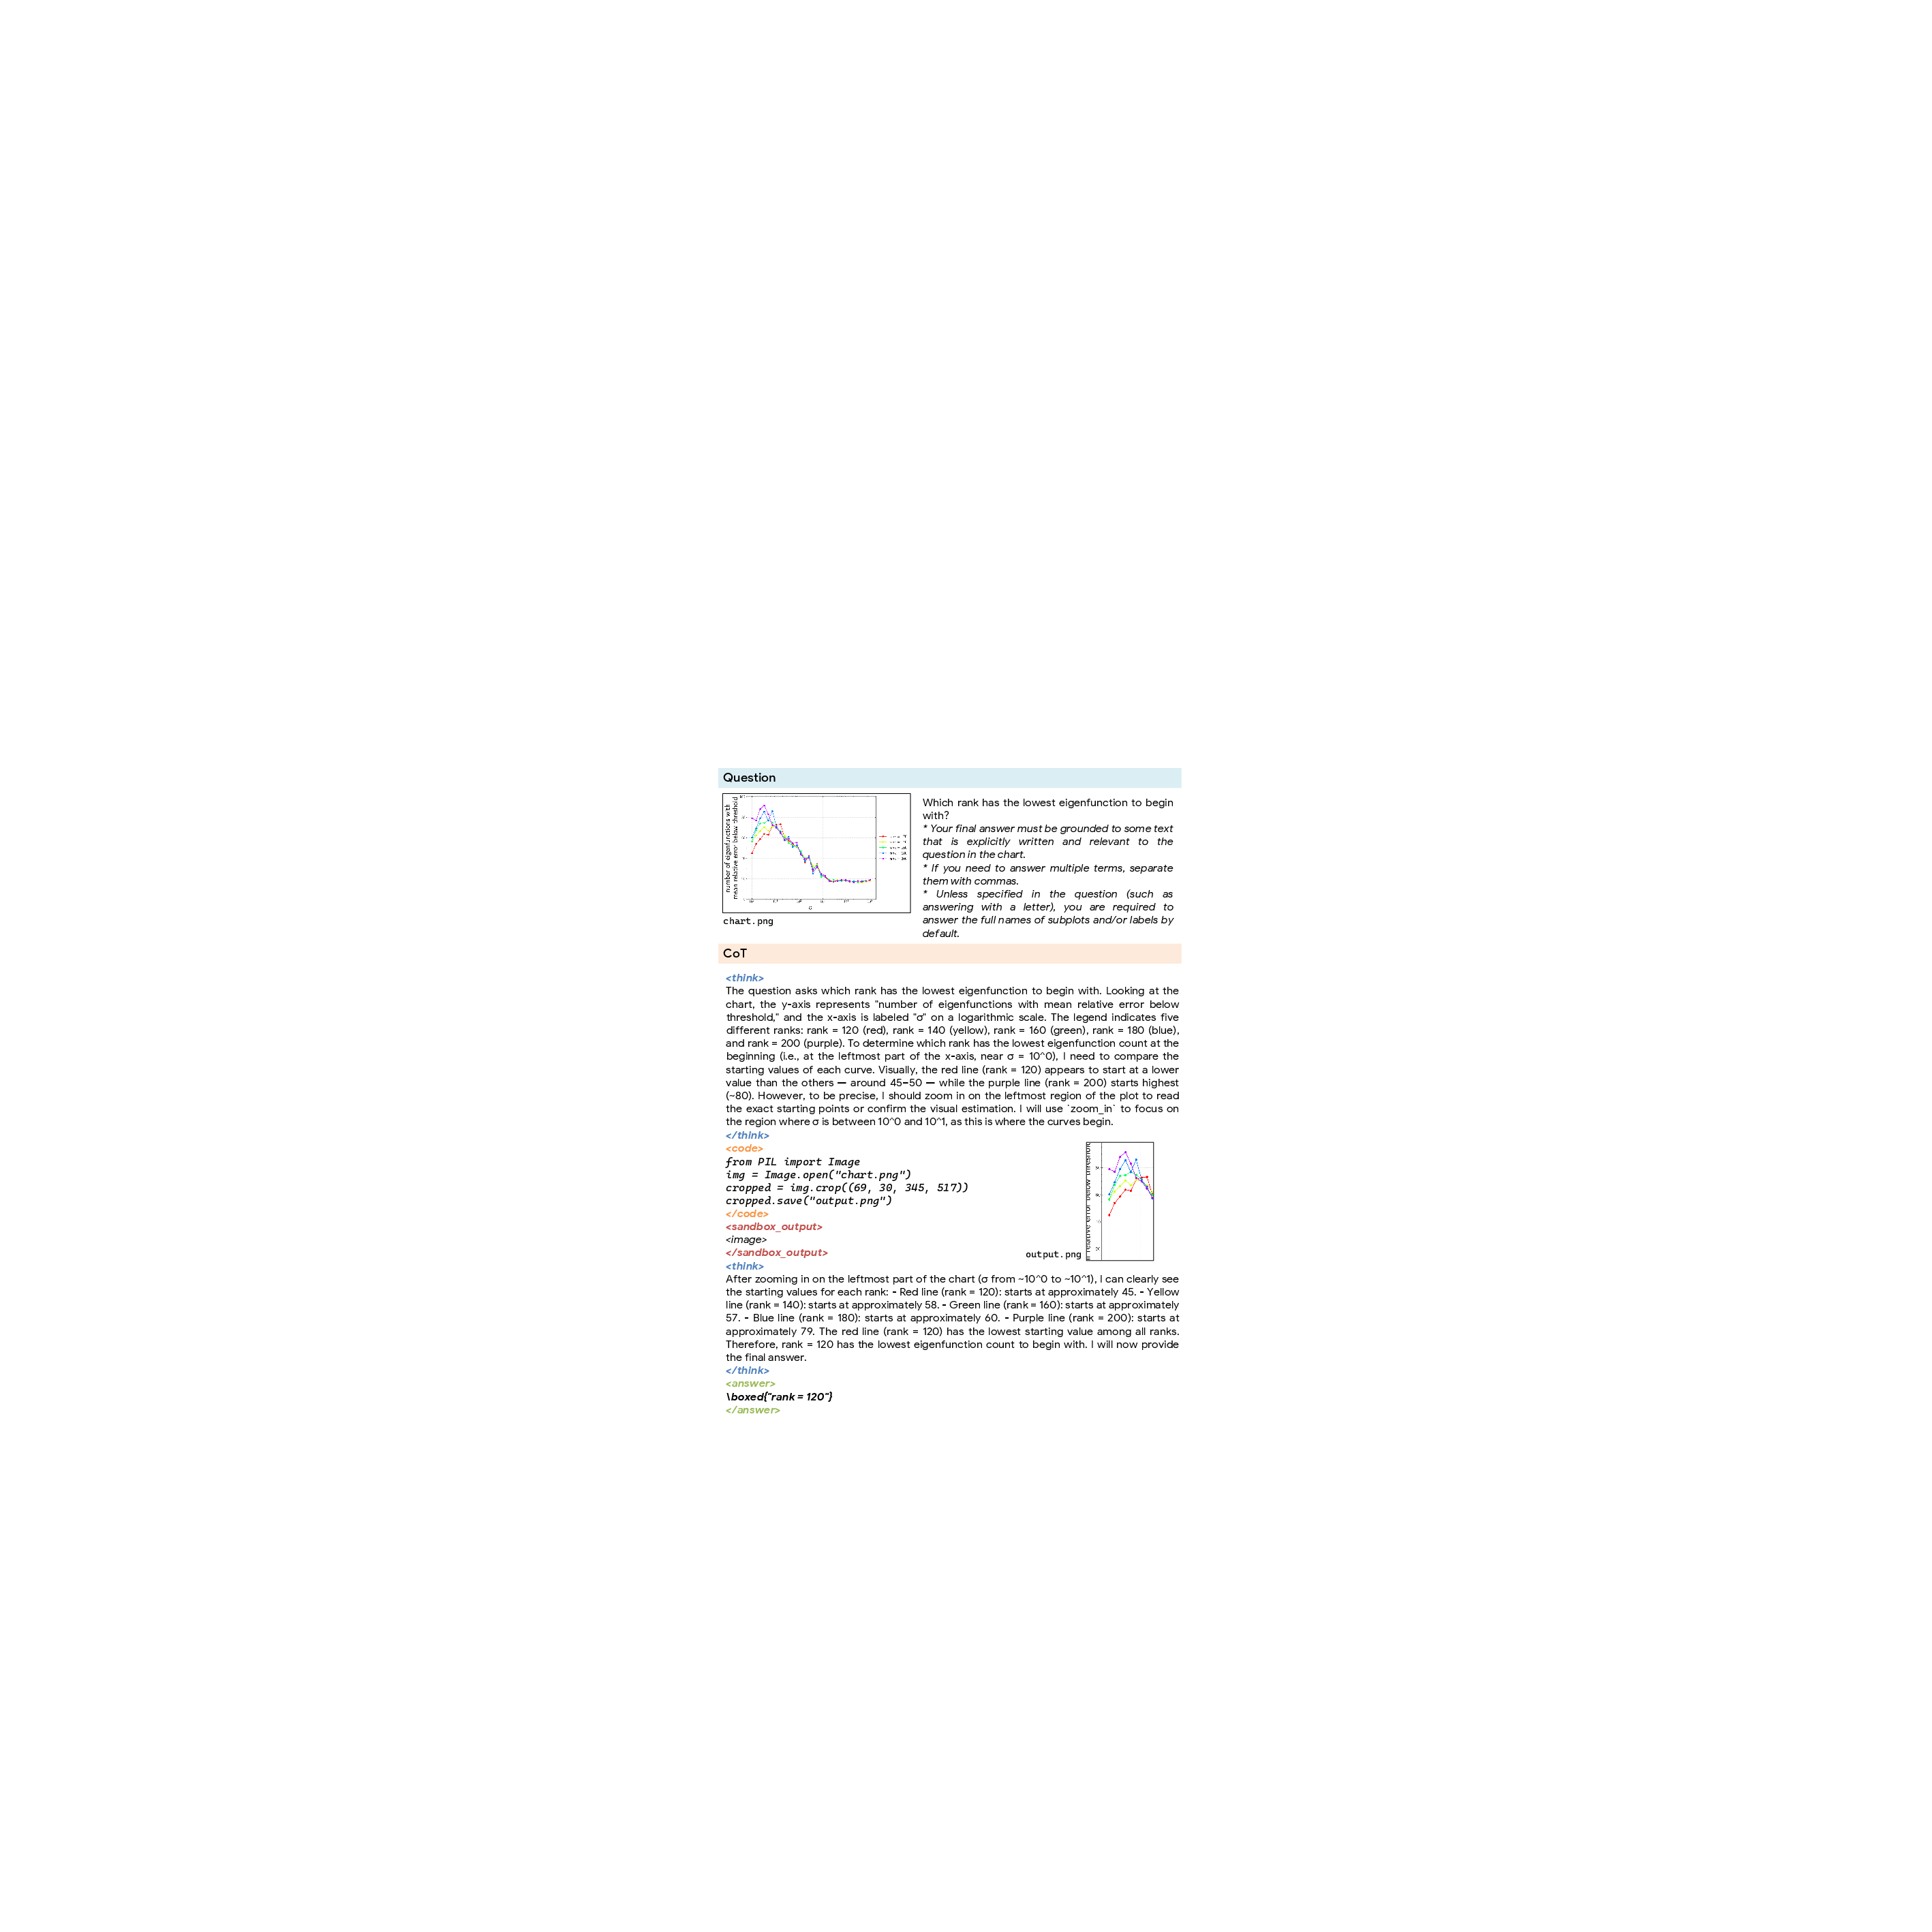
Figure 6: Example of CharTool using the Crop Tool for precise visual localization in a chart.
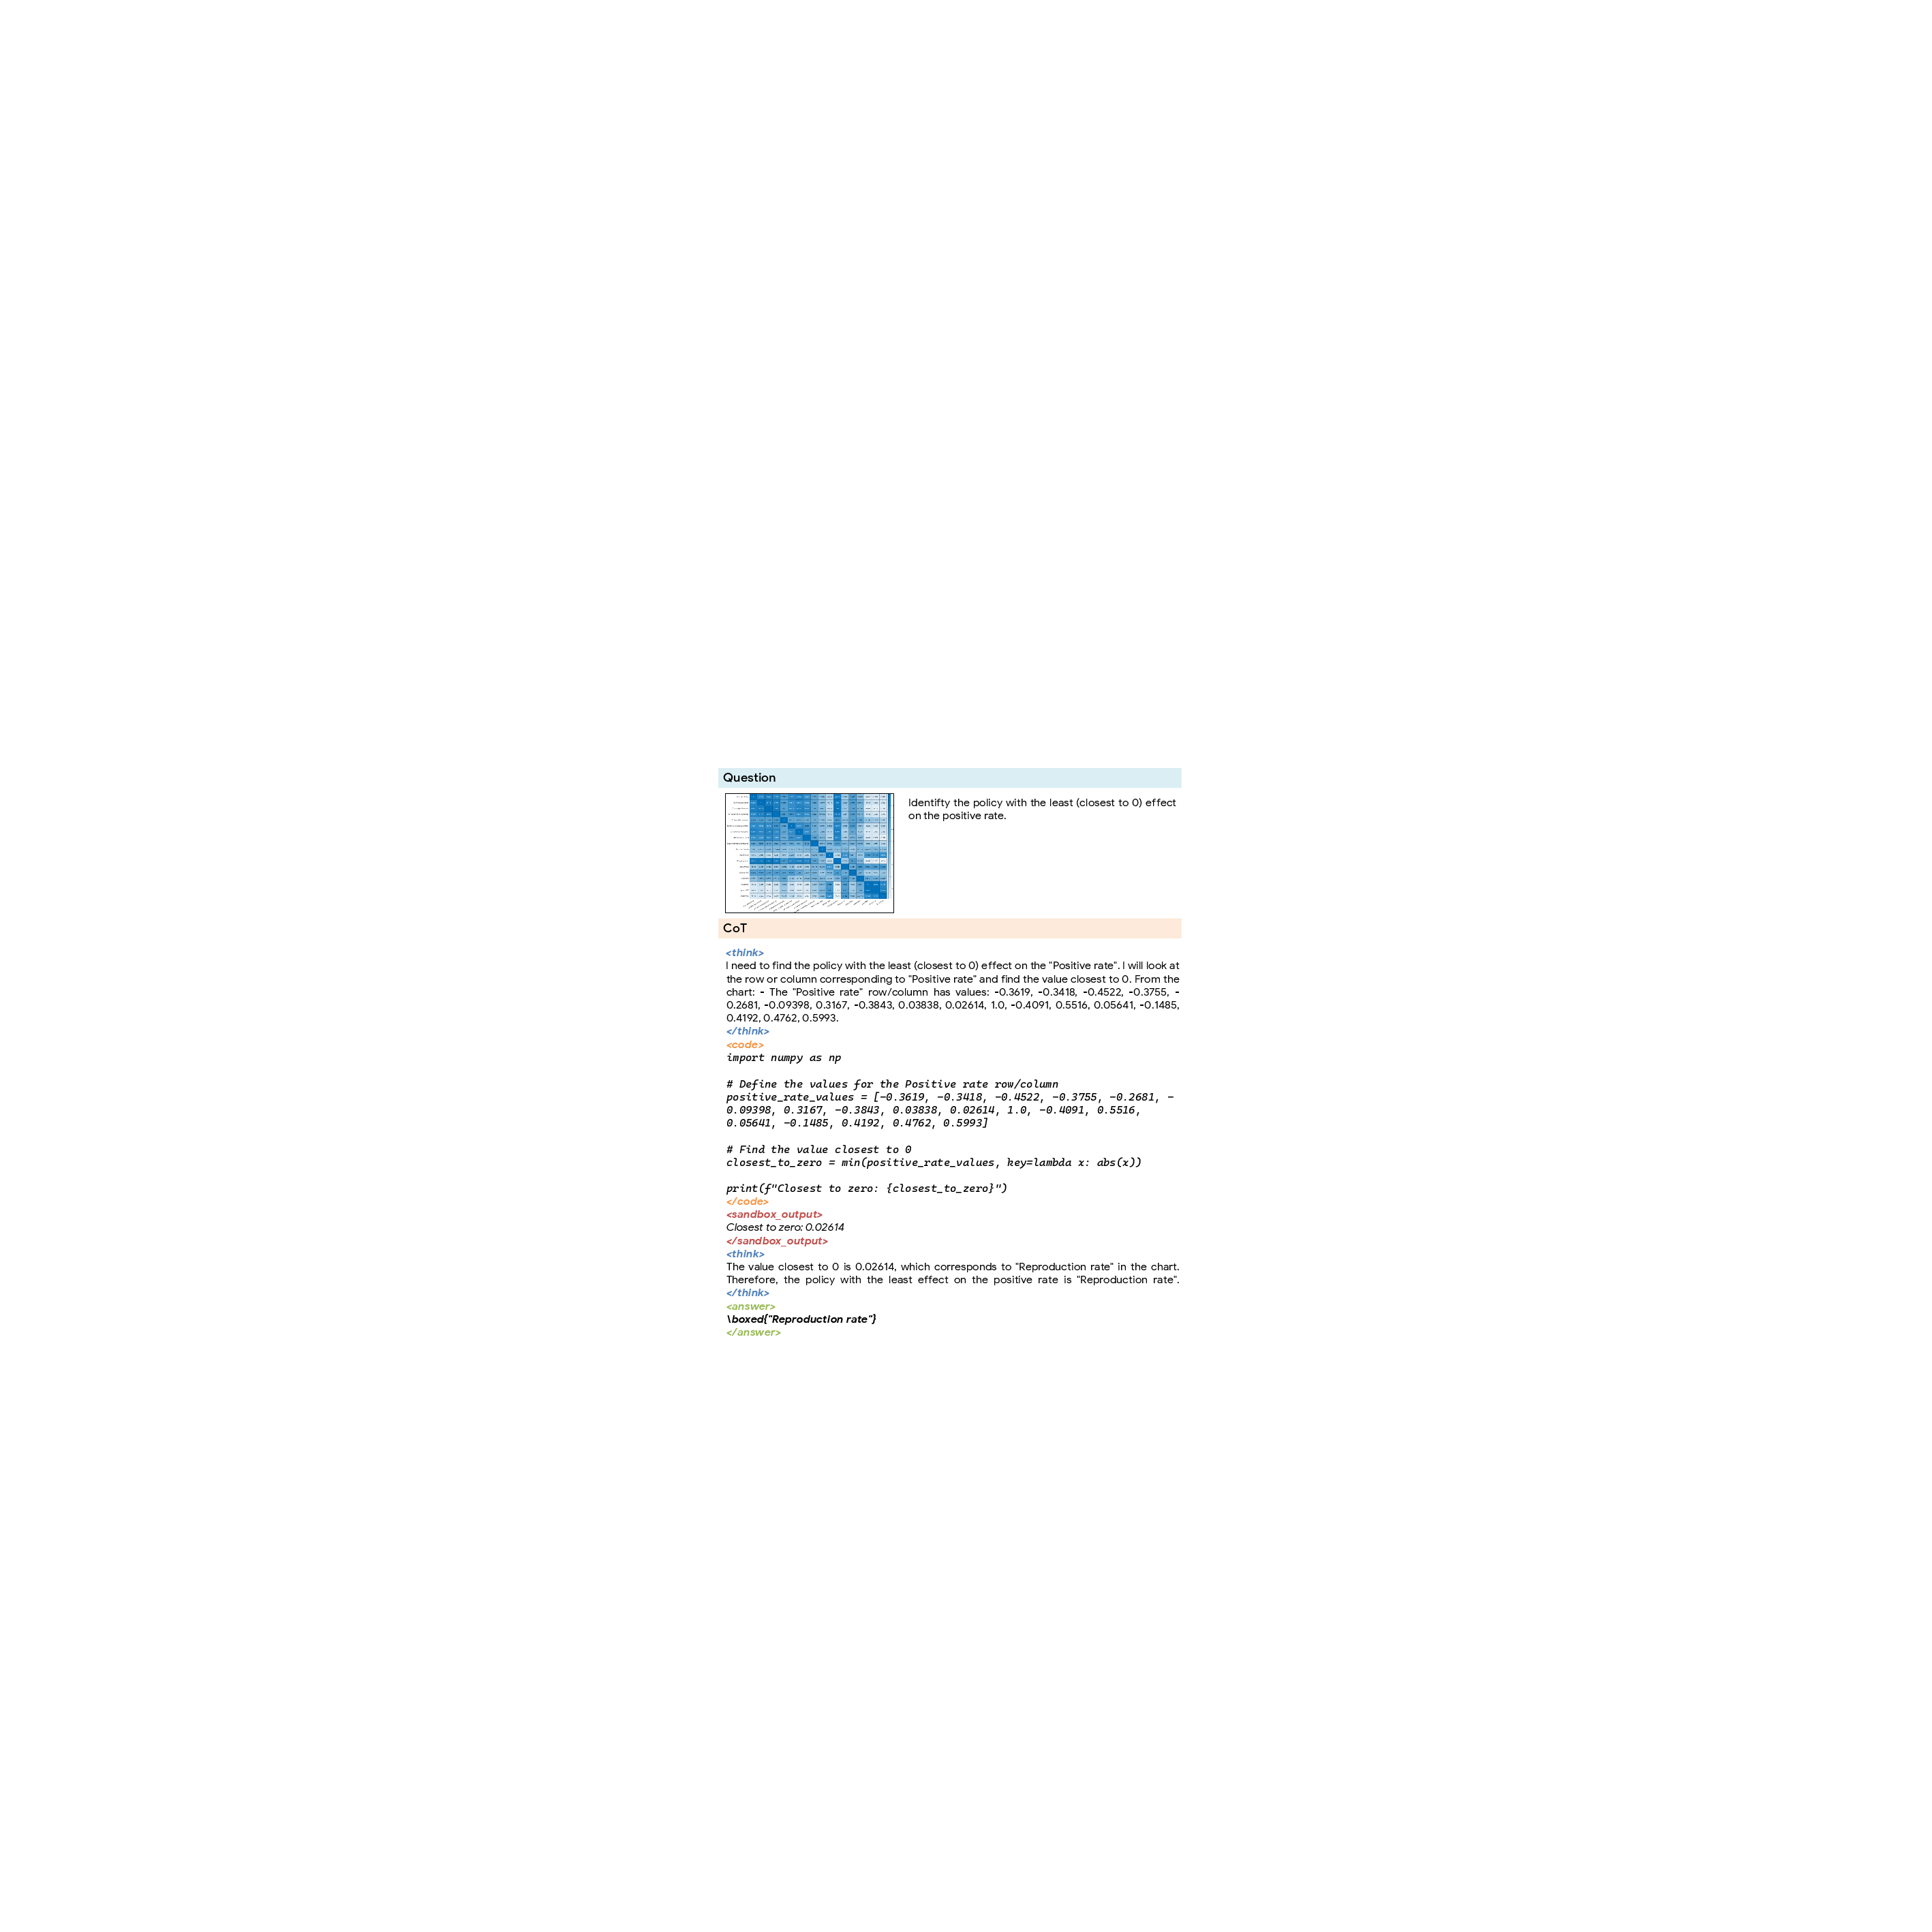
Figure 7: Example of CharTool using the Code Computation Tool for explicit numerical reasoning.
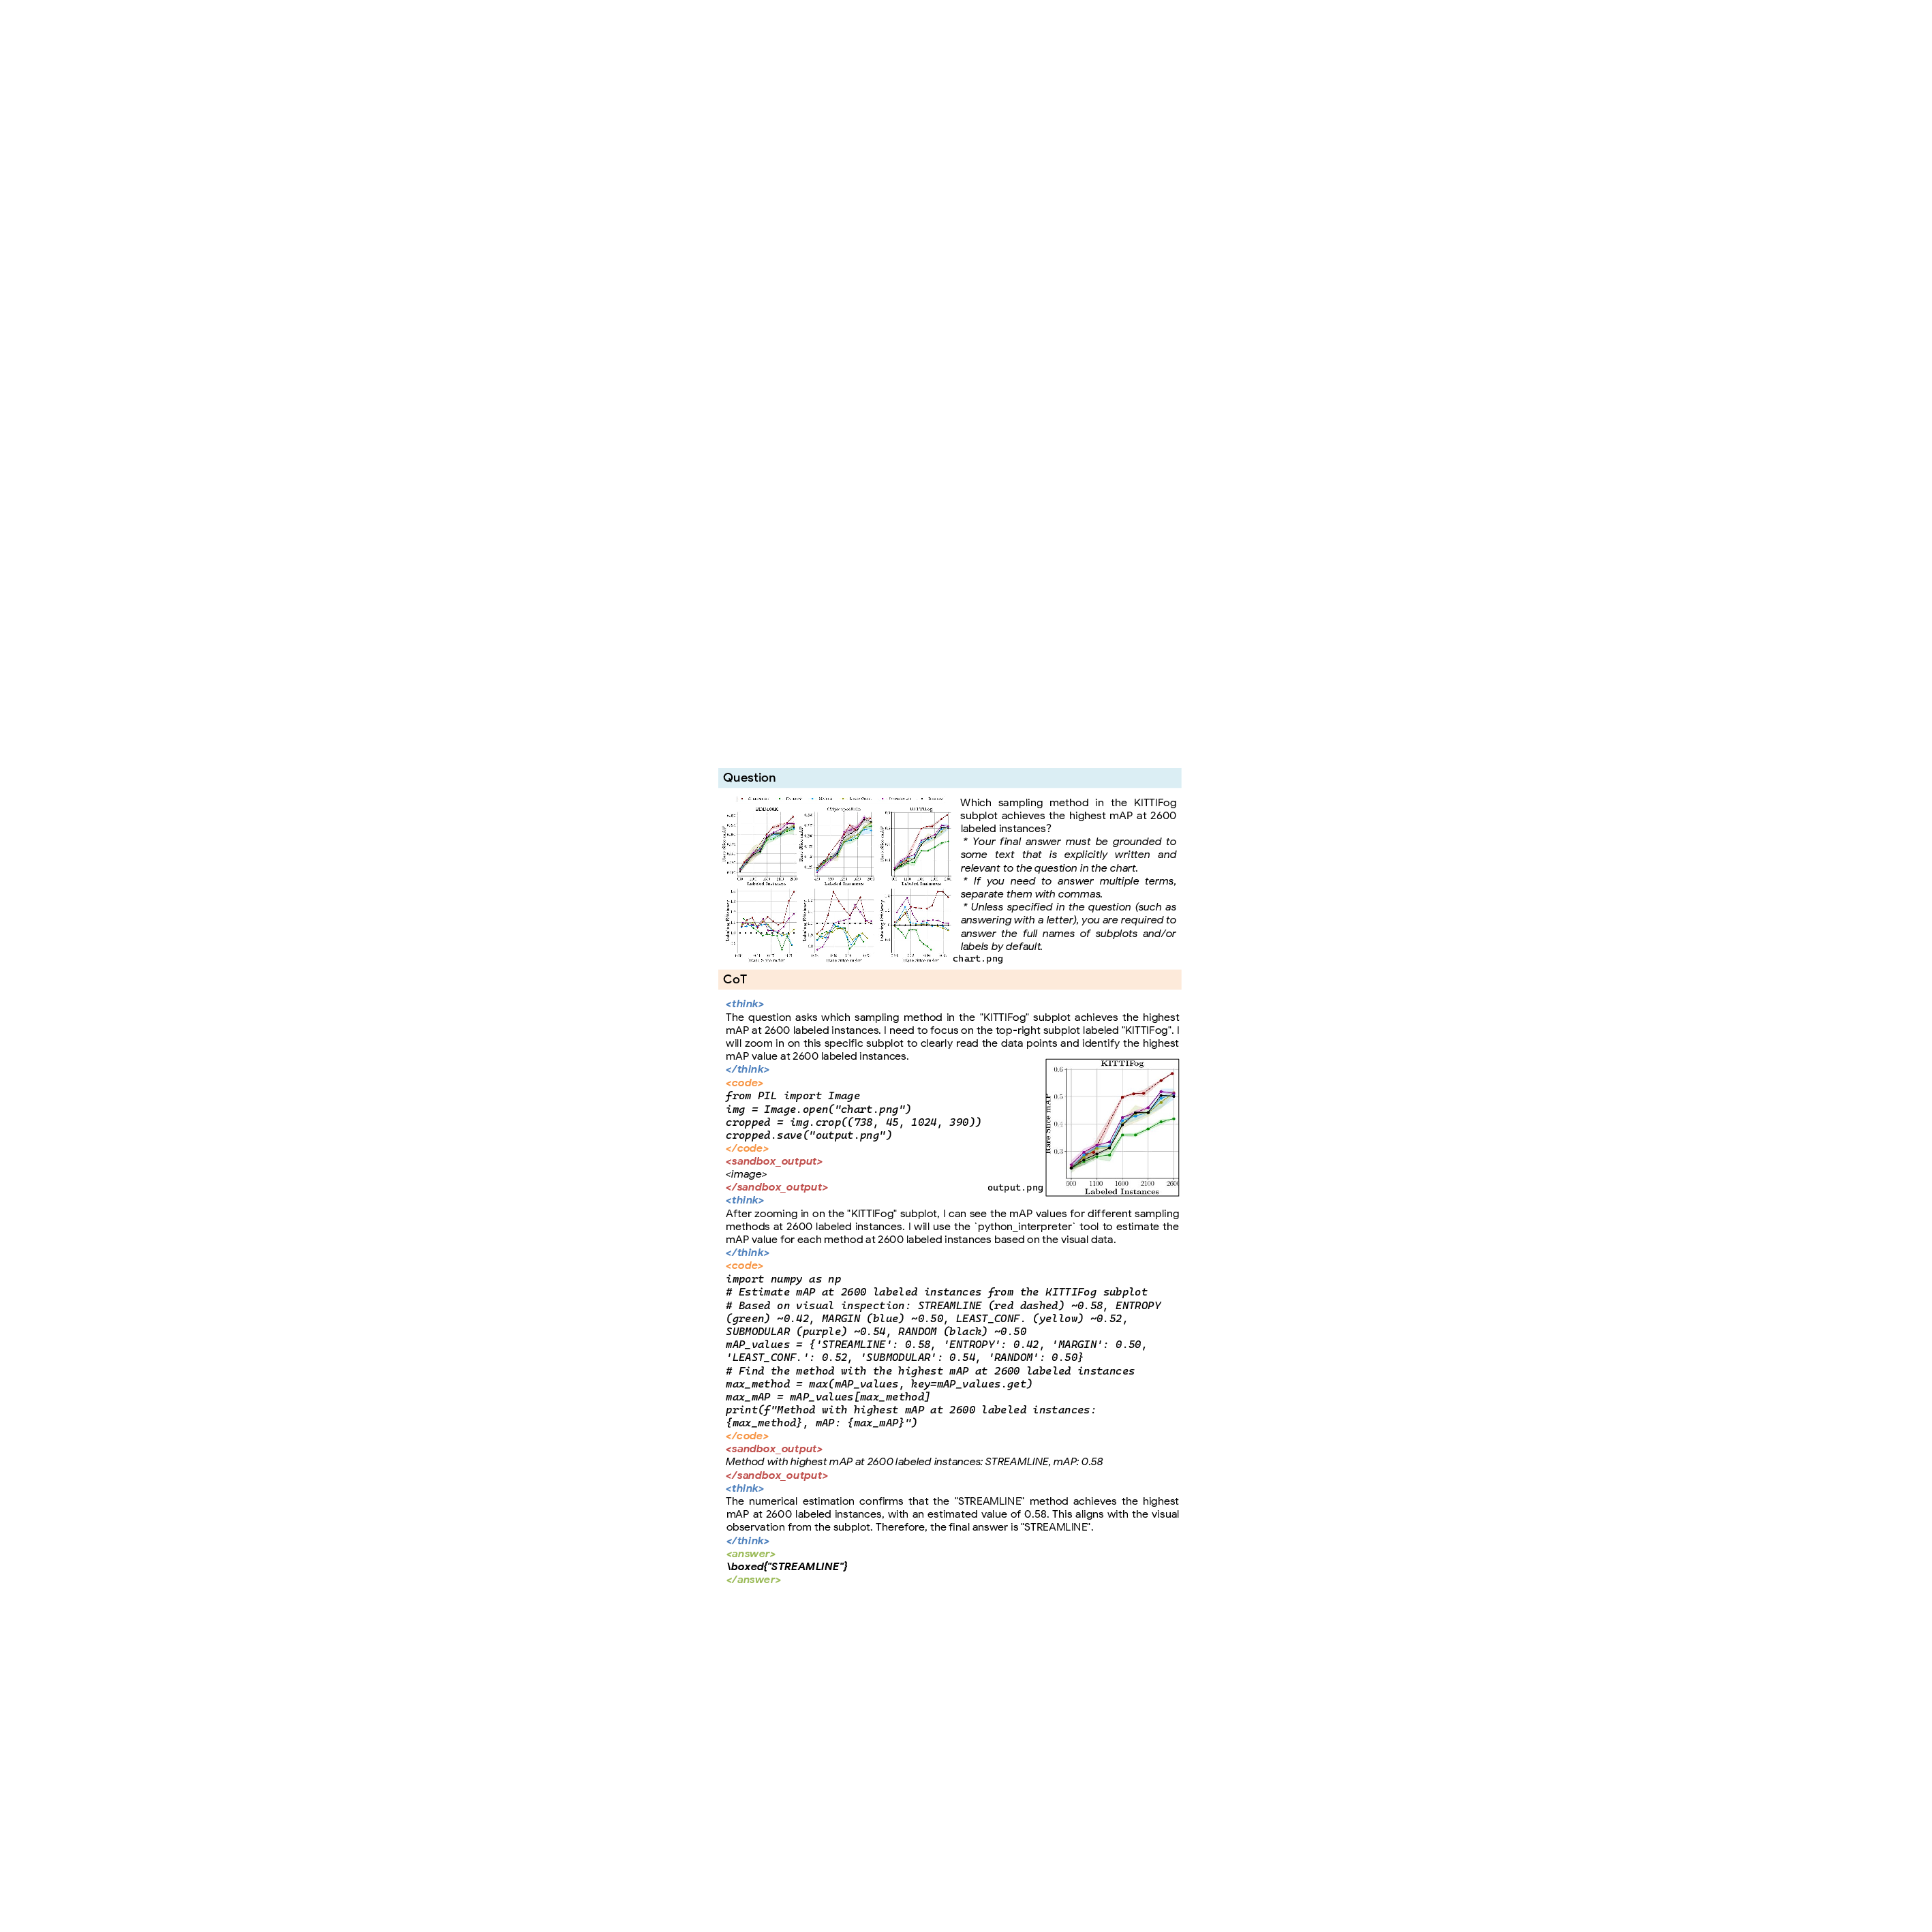
Figure 8: CharTool example with both Crop Tool and Code Computation Tool in tandem for a multi-step analysis.
Experimental Evaluation
CharTool is benchmarked on six chart QA datasets—spanning both challenging real-world tasks (e.g., CharXiv, ChartQAPro) and synthetic environments (e.g., ReachQA, ChartBench)—as well as on out-of-domain visual math reasoning tasks (MathVista, WeMath, MathVerse).
Key results:
- On CharXiv (Reasoning), CharTool-7B outperforms the Qwen2.5-VL-7B backbone by +8.0% absolute accuracy, and on ChartQAPro by +9.78%.
- CharTool-7B (66.52 avg) matches or exceeds proprietary systems like GPT-4o (61.52) and the much larger Qwen2.5-VL-72B (66.02), demonstrating parameter efficiency.
- On out-of-domain benchmarks, tool integration generalizes to improved visual mathematical reasoning (+2.2% on WeMath, for example).
- Ablations establish that neither chain-of-thought prompting nor language-only RL approaches approach the performance gains of tool-integrated RL.
- Analysis of tool usage reveals dynamic adaptation: Crop Tool is favored in visually dense, subplot-rich settings; Code Computation dominates in tasks requiring numerical analysis.
Theoretical and Practical Implications
CharTool demonstrates that explicit external tool integration—particularly when optimized with trajectory-level RL—yields significant gains over traditional MLLM self-reasoning. This strongly supports a modular, agentic view of multimodal reasoning: rather than attempting to ground all visual and numerical reasoning implicitly within the LLM backbone, judicious division of labor between internal ‘cognitive’ states and external, executable operations produces more robust, interpretable, and generalizable systems.
Practically, such approaches facilitate reliable chart interpretation in scientific and financial settings where both localized perception and rigorous calculations are critical. Moreover, the demonstrable transfer of tool-integrated reasoning to out-of-domain tasks suggests potential for extensibility in other structured visual domains (e.g., tables, schematic diagrams).
Speculation on Future Directions
Prospective extensions include:
- Expansion of the toolset to include OCR, region-cluster detection, or formula parsing, improving reasoning over more heterogeneous vision-language tasks.
- Iterative, fine-grained reward schemes for even more agentic multi-step reasoning, potentially incorporating subgoal-level supervision.
- Porting the tool-integrated reasoning paradigm to related domains such as table-based QA, document reading, or complex instructional image understanding, with appropriate interface abstraction.
- Investigating architectures for end-to-end trainable tool parameter selection or composition, reducing hardcoded tool interfaces in favor of higher-level learning.
Conclusion
This work establishes a robust methodology for tool-integrated chart reasoning, combining dual-source high-quality data, targeted agentic training, and adaptive external tool interfaces. CharTool consistently advances performance in chart question answering and demonstrates improved generalization to broader visual reasoning tasks, evidencing the utility of explicit, agent-augmented multimodal frameworks for structured data understanding (2604.02794).