Figure It Out: Improving the Frontier of Reasoning with Active Visual Thinking
Abstract: Complex reasoning problems often involve implicit spatial, geometric, and structural relationships that are not explicitly encoded in text. While recent reasoning models have achieved strong performance across many domains, purely text-based reasoning struggles to represent global structural constraints in complex settings. In this paper, we introduce FIGR, which integrates active visual thinking into multi-turn reasoning via end-to-end reinforcement learning. FIGR externalizes intermediate structural hypotheses by constructing visual representations during problem solving. By adaptively regulating when and how visual reasoning should be invoked, FIGR enables more stable and coherent reasoning over global structural properties that are difficult to capture from text alone. Experiments on challenging mathematical reasoning benchmarks demonstrate that FIGR outperforms strong text-only chain-of-thought baselines. In particular, FIGR improves the base model by 13.12% on AIME 2025 and 11.00% on BeyondAIME, highlighting the effectiveness of figure-guided multimodal reasoning in enhancing the stability and reliability of complex reasoning.
Paper Prompts
Sign up for free to create and run prompts on this paper using GPT-5.
Top Community Prompts
Explain it Like I'm 14
Overview
This paper introduces a new way to help AI solve tricky problems, especially math and geometry. The idea is simple: when a problem is hard and involves shapes, space, or structure, people draw diagrams to understand it. The authors built an AI system called FIGR (short for “Figure It Out”) that does something similar—it “thinks” with both words and pictures by writing code to draw precise, helpful figures while it reasons.
What questions does the paper ask?
The paper focuses on a few easy-to-understand questions:
- Can AI solve tough math problems better if it actively creates and looks at diagrams while reasoning?
- When should the AI decide to draw a figure, and when should it stick to text?
- Is there a way for the AI to learn this behavior by itself (through practice and feedback) without needing a lot of hand-crafted examples?
- Does this approach actually improve results on real, hard math tests?
How does the method work?
Think of FIGR as a student who solves a problem by:
- Writing down steps in words (its “chain of thoughts”).
- Sometimes writing small pieces of code that draw a diagram to check if everything lines up correctly (like making sure angles, lines, and intersections are where they should be).
Here’s the approach in everyday terms:
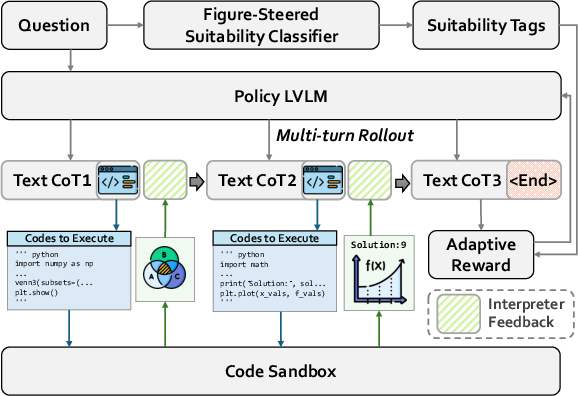
The reasoning loop (words + drawing)
- The AI goes through a problem step by step.
- At any point, it can:
- Keep explaining in text, or
- Write a short code snippet (in Python) that, when run, produces a figure (like a diagram of a geometry problem).
- The code is run in a safe “sandbox,” and the AI gets feedback: the drawn image and any text output from the code.
- It then continues reasoning, using the picture to guide the next steps, just like a human would look at a sketch and refine their plan.
Learning by practice and rewards (reinforcement learning)
- The AI learns through trial and error, like practicing for a test and earning points for good answers.
- For each problem, it tries several solution paths. The ones that do better get reinforced (boosted), and weaker ones are discouraged.
- It uses a method called GRPO (Group Relative Policy Optimization), which is a fancy name for: “Compare a bunch of attempts, reward the ones above average, and keep the model close to its original behavior for stability.”
An “adaptive reward” to use drawing wisely
- Drawing isn’t always helpful. So the system has a simple “coach” that predicts whether a problem likely benefits from visual reasoning (for example, geometry usually does).
- The AI earns extra reward for:
- Getting the final answer right,
- Using drawing on problems where drawing is helpful, and
- Producing code that runs successfully and gives a valid figure.
- If it draws when it’s not needed, it gets a smaller bonus. If the answer is wrong or the code fails, no bonus is given.
- This teaches the AI to draw figures only when it helps, not just for the sake of it.
What did they find?
The authors tested FIGR on several well-known math benchmarks (like AIME and BeyondAIME), which are hard tests designed to challenge reasoning.
Key results:
- FIGR consistently beats strong text-only models.
- On AIME 2025, it improved the base model by 13.12%.
- On BeyondAIME, it improved by 11.00%.
- Overall, it increased average accuracy across seven math benchmarks compared to the base vision-LLM and a text-only reinforcement learning baseline.
Why this matters:
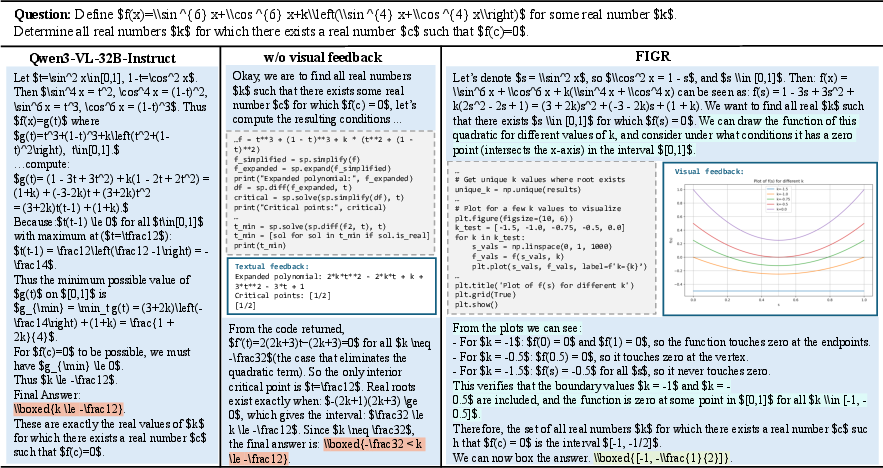
- Text-only reasoning struggles with problems where spatial relationships and precise structures matter (think geometry diagrams).
- Simply generating images without control (like a general AI painting a picture) isn’t precise enough for math.
- FIGR’s code-generated figures enforce exact geometric constraints, making the reasoning more stable and reliable.
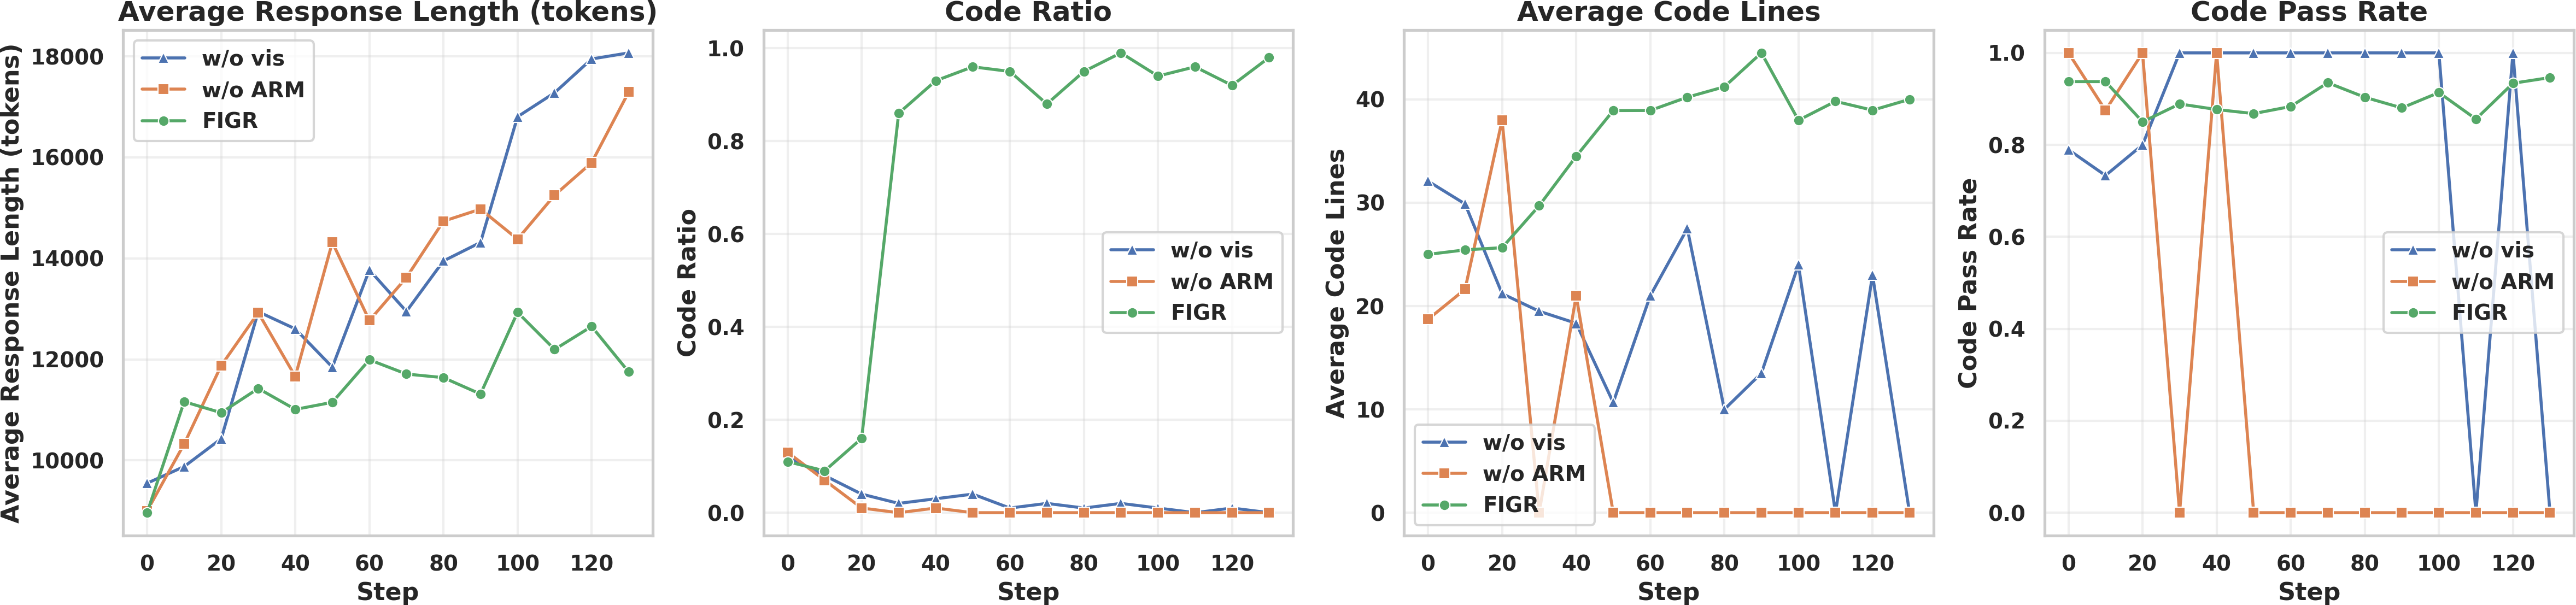
Additional insights from ablation studies (tests where parts are removed or changed):
- Just “prompt engineering” (telling the AI to behave a certain way without training) helps a bit but is unstable.
- Supervised fine-tuning (training on step-by-step solutions) can actually hurt performance on new problems.
- Injecting images from other models without active, feedback-driven drawing doesn’t help much and can add noise.
- Removing the adaptive reward or removing visual feedback both reduce performance—these parts are important for making the system reliable.
Why is this important?
This approach shows that:
- Good reasoning isn’t only about words—it’s also about building and checking visual structure when needed.
- Teaching AI to decide when and how to use diagrams can make it better at tough math and science problems.
- The figures are not random drawings—they are precise, code-generated, and interpretable. That makes the reasoning clearer, easier to check, and more trustworthy.
Big picture impact
FIGR points to a future where AI solves complex problems by:
- Switching smoothly between text and visuals,
- Using precise diagrams to keep global structure consistent,
- Learning from feedback to use the right tools at the right time.
This could help in math education, science labs, engineering design, and anywhere complex relationships are easier to understand with a diagram. It also makes AI’s thinking more transparent—since it shows both its reasoning steps and the figures it relied on.
Knowledge Gaps
Knowledge gaps, limitations, and open questions
Below is a single, concrete list of gaps that remain unresolved and could guide future research:
- Unspecified visual construction stack: the paper does not describe the drawing libraries, geometry engines, or APIs used for code-based figure rendering (e.g.,
matplotlib,shapely,geogebra), nor their capabilities (2D vs. 3D, constraints, precision). - Lack of metrics for figure fidelity: there is no quantitative evaluation of whether rendered diagrams satisfy the stated geometric/spatial constraints (e.g., angle/tangency accuracy, intersection correctness); no automated validators are used.
- No assessment of visual quality’s impact: the relationship between diagram accuracy/clarity and final reasoning correctness is not measured; it’s unclear how visual imprecision affects downstream steps.
- Reward design tied only to final correctness: the RL objective does not provide intermediate rewards for correct sub-steps or visually accurate constructions; credit assignment to visual actions is weak and unexamined.
- Fixed
R_visparameters without sensitivity analysis: the chosen visual reward values (1.0 and 0.2) are not justified; there is no ablation on alternative scalings or continuous schemes based on figure quality or utility. - External suitability classifier
sis unvalidated: the DeepSeek-V3-based tagging for “visual usefulness” is not evaluated for accuracy, bias, or consistency across problem types; the method’s sensitivity to misclassification is unknown. - Ambiguity on inference-time gating: it is unclear whether the external suitability classifier is used at inference, or if the model learns its own gating policy; no comparison of external vs. learned gating.
- Missing analysis of failure cases: the paper does not categorize problems where active visual reasoning hurts performance (e.g., the MinervaMath result lagging text-only RL) or explain why.
- Limited domain coverage: evaluations focus on math benchmarks; generalization to tasks requiring physics diagrams, circuits, graphs, kinematics, or real-world spatial reasoning remains unexplored.
- Handling input images is not studied: the approach constructs figures “from scratch”; it is unknown how the method performs on problems that provide initial diagrams or require augmenting existing visuals.
- Turn budget constraint: the system is capped at 3 interaction rounds; there is no study of how more turns, adaptive termination, or tree-of-thought branching affect performance and cost.
- Scalability and compute cost unreported: training/inference time, GPU hours, memory footprint, token usage distribution, and interpreter overhead are not quantified; practical deployment constraints remain unclear.
- Safety of code execution: while “sandboxed” execution is mentioned, there are no details on the sandbox (resource limits, syscalls, file/network isolation), attack surface, or defenses against prompt/code injection.
- Reproducibility risks from environment dependencies: the method’s sensitivity to interpreter versions, library updates, rendering determinism (seeds), and platform differences is not assessed.
- No explicit error recovery strategy: the paper does not describe how the agent handles code execution failures (syntax/runtime errors), retries, or incremental debugging strategies.
- Integration of visual feedback into the model context is opaque: the mechanism for encoding rendered images back into the LVLM’s state (resolution, encoding, compression) and its effect on token budget is unspecified.
- Baseline fairness and comparability: only subsets of UMM/TAVLM benchmarks are reported in the main text; configuration parity, prompt design parity, and tuning effort across baselines are insufficiently documented.
- Evaluation methodology inconsistencies: pass@1 is reported while generating 64 samples for AIME; the formula shown computes average correctness over multiple samples and does not match standard pass@1, complicating comparisons.
- Lack of robustness checks: variance across random seeds, sensitivity to sampling temperature, and stability under different decoding strategies are not reported.
- No category-level error analysis: the paper does not break results down by problem type (algebra, geometry, combinatorics), difficulty level, or visual necessity to identify where FIGR brings the most benefit.
- Missing human interpretability evaluation: claims of interpretability from figures are not supported by user studies assessing clarity, trust, or debugging utility.
- No explicit geometric constraint solver: figures are produced by code, but there is no integration with constraint solvers (e.g., CGAL) to guarantee exact satisfaction of geometric relations.
- Limited exploration of alternative toolchains: comparisons to more expressive programmatic visualization tools (e.g.,
Graphviz, CAD/geometry kernels) or symbolic solvers (e.g., theorem provers) are absent. - RL stability and hyperparameters are under-specified: key GRPO settings (clipping
ε, KL coefficientβ, group sizeG, rollout limits) and their effects on training stability are not analyzed. - Potential training/test contamination in base models: although the training dataset is decontaminated, base LVLM/LLM pretraining may include test benchmarks; contamination risks are not examined.
- No analysis of token efficiency: the trade-off between long reasoning sequences (32k max tokens), image generation, and accuracy gains is not measured; guidance on optimal budget allocation is lacking.
- Interaction with non-visual PoT/CoC tools: it is unclear how FIGR compares to or complements code-only reasoning (e.g., symbolic math tools) when visual construction is unnecessary.
- Absence of adaptive curriculum: the training does not incorporate a curriculum to gradually introduce visual complexity or constraint difficulty; effects of curriculum design are unknown.
- Generalization to dynamic/simulation visuals: tasks requiring time-varying visuals (e.g., trajectories, differential systems) or physics engines are not considered; suitability of the current stack is uncertain.
- Ethical and misuse considerations: beyond technical safety, broader implications of autonomous code execution (e.g., generating harmful scripts) and responsible deployment policies are not discussed.
Glossary
- Ablation study: A controlled experiment that removes or alters components to assess their contribution to overall performance. "we conduct ablation studies on two representative datasets: AIME 2025 and BeyondAIME"
- Active visual thinking: A reasoning approach where the model constructs and uses intermediate visual representations (e.g., figures) during problem solving. "integrates active visual thinking into multi-turn reasoning via end-to-end reinforcement learning."
- Adaptive Reward Mechanism: A reward design that dynamically encourages or discourages visual reasoning based on task suitability and outcomes. "we design an Adaptive Reward Mechanism that regulates when visual reasoning should be invoked"
- AIME 2025: A challenging math competition benchmark used to evaluate reasoning systems. "improves the base model by 13.12\% on AIME 2025"
- AMC: The American Mathematics Competitions, a standard benchmark for mathematical problem solving. "AMC"
- BeyondAIME: A difficult mathematical reasoning benchmark extending beyond AIME-style problems. "and 11.00\% on BeyondAIME"
- Chain-of-Code: A reasoning paradigm that interleaves natural language with executable code to offload computation. "ChainâofâCode \cite{li2023chain}"
- Chain-of-thought (CoT): A prompting and reasoning technique that elicits step-by-step intermediate reasoning. "A text-only chain-of-thought (CoT, \cite{wei2022chain}) model must implicitly track a dense network of spatial relations"
- Clipping hyperparameter: The ε parameter used to clip policy probability ratios in PPO-like objectives for training stability. " is a clipping hyperparameter;"
- Cold-start: Training without an initial supervised fine-tuning phase, relying instead on later learning signals. "eliminates the need for a supervised fine-tuning cold-start stage."
- Decontaminated dataset: A dataset curated to avoid overlap with evaluation benchmarks to prevent leakage. "a rigorously decontaminated, large-scale dataset of 103,000 challenging mathematical problems"
- DeepMath-103K: A large-scale, verified, decontaminated dataset of mathematical problems for training and evaluation. "DeepMath-103K \cite{he2025deepmath}"
- End-to-end reinforcement learning: Training where the full system is optimized via RL from inputs to final outputs. "integrates active visual thinking into multi-turn reasoning via end-to-end reinforcement learning."
- Executable code: Code produced by the model that is run to generate textual and/or visual feedback used in reasoning. "produces executable code that serves as a bridge between symbolic reasoning and visual rendering."
- Figure-guided multimodal reasoning: A reasoning process steered by generated figures that provide visual constraints and feedback. "highlighting the effectiveness of figure-guided multimodal reasoning in enhancing the stability and reliability of complex reasoning."
- Format reward: A reward component that encourages outputs to follow a required structural format. "$R_{\mathrm{fmt}$ is the format reward, granted when the modelâs output adheres to the required structural format"
- Group baseline: The mean reward across a sampled group of trajectories used as a baseline for advantage computation. "We then compute the group baseline:"
- Group Relative Policy Optimization (GRPO): An RL algorithm that optimizes policies by comparing grouped rollouts relative to their mean reward. "we adopt the Group Relative Policy Optimization (GRPO) algorithm"
- Instruction-tuned model: A model fine-tuned to follow instructions and tasks specified in natural language. "instruction-tuned model (e.g., Qwen3-VL-32B-Instruct \cite{bai2025qwen3vl})"
- KL-regularization: A regularization term using KL divergence to keep the updated policy close to a reference policy. "$\pi_{\mathrm{ref}$ is a reference policy (e.g., initial base policy) used for KL-regularization;"
- Large Vision-LLMs (LVLMs): Models that process both visual and textual inputs and typically output text. "tool-augmented large vision-LLMs (LVLMs)"
- Multimodal chain-of-thought: Chain-of-thought reasoning that interleaves or incorporates visual elements alongside text. "multimodal chain-of-thought effectively unlocks the reasoning capacity of ."
- Pass@k: An evaluation metric measuring the probability that at least one of k generated solutions is correct. "we default to pass@ evaluation \cite{chen2021evaluating}"
- Probability ratio: The ratio of current to old policy probabilities for an action, used in policy optimization. "is the probability ratio;"
- Reference policy: A fixed or prior policy used to constrain updates via KL regularization during RL training. "$\pi_{\mathrm{ref}$ is a reference policy (e.g., initial base policy) used for KL-regularization;"
- Reinforcement learning (RL): A learning paradigm optimizing policies based on reward signals from interactions or outcomes. "we employ reinforcement learning."
- Relative advantage: The difference between a trajectory’s reward and the baseline, indicating its relative merit. "and the relative advantage for each trajectory:"
- Rollout: A sampled sequence of actions and observations from a policy used to estimate rewards and update the model. "a group of candidate trajectories (rollouts) under the current policy"
- Sandboxed interpreter: A secure execution environment that runs model-generated code and returns outputs and figures. "executes it via a sandboxed interpreter"
- Surrogate objective: The optimized proxy objective in policy gradient methods that balances reward improvement and stability. "maximizing the following surrogate objective"
- Tool-Augmented Vision-LLMs (TAVLMs): LVLMs enhanced with predefined external tools or APIs for visual processing during reasoning. "Tool-Augmented Vision-LLMs (TAVLMs)."
- Trajectory: The sequence of states, actions, and rewards constituting a single run of the policy. "For each trajectory, we compute ."
- Tree-of-Thought (ToT): A reasoning framework that explores branching solution paths rather than a single chain. "TreeâofâThought (ToT) \cite{yao2023tree}"
- Unified Multimodal Models (UMMs): Models that both accept multimodal inputs and can generate multimodal outputs (e.g., images). "Unified Multimodal Models (UMMs)."
- VeRL: A framework for efficient RLHF and multi-turn rollouts used to implement the training procedure. "a multi-turn rollout framework implemented in VeRL \cite{sheng2024hybridflow}"
- Visual grounding: The precise alignment of textual references or reasoning steps with visual elements in an image or figure. "Unified multimodal CoT often suffers from imprecise visual grounding."
- Visual-invocation reward: A reward signal that encourages appropriate invocation of visual reasoning and successful code execution. "the visual-invocation reward is defined by jointly considering (i) whether the final answer is correct, (ii) whether the problem is suitable for visual reasoning, and (iii) whether the generated code is successfully executed."
Practical Applications
Overview
Below is a structured set of practical applications that leverage the paper’s core innovations: active visual thinking embedded in multi-turn reasoning via reinforcement learning (RL), executable figure construction (code-to-visual rendering), and an adaptive reward mechanism that regulates when visual reasoning should be invoked. Applications are grouped by deployment horizon and annotated with sectors, potential tools/products/workflows, and key assumptions or dependencies.
Immediate Applications
The following applications can be piloted or deployed now using current LLM/LVLM infrastructure, sandboxed interpreters, and math/STEM datasets similar to DeepMath-103K.
- Math and STEM tutoring assistants (Education)
- Description: Interactive tutors that construct precise, executable diagrams during problem-solving (e.g., geometry, physics kinematics, trigonometry), improving correctness and interpretability of chain-of-thought.
- Tools/products/workflows:
- “Geometry Copilot” integrated into LMS platforms, homework apps, or classroom whiteboards.
- Jupyter/Colab extensions that render code-generated figures alongside reasoning steps.
- Assumptions/dependencies: Availability of a secure
sandboxed interpreter, drawing libraries (e.g., Matplotlib/Shapely), and vetted content; teacher oversight for assessments.
- Assessment authoring and grading (Education, Publishing)
- Description: Automatic generation of geometrically consistent diagrams and verified solution steps for exams (AMC/AIME), homework, and textbooks.
- Tools/products/workflows:
- Item-authoring tool that outputs both final figures and reproducible code-to-figure scripts for auditing.
- Assumptions/dependencies: Ground-truth answer availability; QA pipelines for diagram accuracy; alignment with curriculum standards.
- Research and teaching assistants for STEM courses (Academia)
- Description: Figure-steered reasoning companions for university problem sets in calculus/physics/engineering, producing interpretable visuals that reflect global constraints.
- Tools/products/workflows:
- Course-specific “FIGR Notebooks” that unify text, code, and figures with multi-turn reasoning.
- Assumptions/dependencies: Domain extensions to physics/engineering symbols; secure compute in university environments.
- Computational geometry and algorithm debugging (Software)
- Description: Developer assistants that auto-render geometry inputs/outputs and verify constraints during algorithm design (e.g., intersection tests, convex hulls).
- Tools/products/workflows:
- VSCode plugin that triggers “figure-steered checks” for geometry routines and data structures; CI jobs that run executable diagrams to catch layout errors.
- Assumptions/dependencies: Access to codebases, unit tests, and plotting backends; careful sandboxing to prevent code execution risks.
- Design validation in architecture/engineering (AEC)
- Description: Pre-checks for parametric designs where constraints (angles, tangencies, distances) must be satisfied; the assistant generates figures from specs and flags inconsistencies.
- Tools/products/workflows:
- “Constraint Checker” that ingests CAD parameters and outputs verifiable figure scripts and visual diagnostics.
- Assumptions/dependencies: Interfaces to CAD exports (DXF/JSON); tolerance handling; human-in-the-loop review.
- Operations research visualization for scheduling and routing (Enterprise analytics)
- Description: Construct diagrams for resource allocation, timetables, and graph-based routes, anchoring optimization steps in clear visuals during multi-turn reasoning.
- Tools/products/workflows:
- Dashboards where the agent renders network diagrams and validates global feasibility constraints while explaining solution changes.
- Assumptions/dependencies: Structured data connectors; domain adaptation for OR models; interpretability requirements.
- Agent/tool orchestration with adaptive reward gating (Software platforms)
- Description: Reuse of the Adaptive Reward Mechanism to regulate tool invocation (not only drawing), improving reliability in agent frameworks (e.g., deciding when to call a code interpreter or search).
- Tools/products/workflows:
- “Adaptive Tool-Use SDK” integrated into LLM orchestration frameworks to curb spurious tool calls and improve outcome-driven behavior.
- Assumptions/dependencies: Access to RLHF/GRPO training loops (e.g., VeRL/HybridFlow), reference policy for KL regularization, suitable reward signals.
- Technical documentation and reproducible graphics (Publishing, Data journalism)
- Description: Generate reproducible figures and accompanying code for reports and articles—ensuring geometric consistency and auditability.
- Tools/products/workflows:
- “Reproducible Figure Packs” embedded in articles; code attachments that re-render the exact diagram.
- Assumptions/dependencies: Publishing workflows that accept code artifacts; governance for executable attachments.
- Interior layout and DIY planning assistants (Daily life)
- Description: Consumer tools that produce scale-accurate room/furniture diagrams from textual constraints, enabling better spatial decisions.
- Tools/products/workflows:
- Home planning apps that reason over dimensions and render precise layouts step-by-step.
- Assumptions/dependencies: Simple geometry libraries; accurate measurements; user-friendly interfaces.
Long-Term Applications
These applications require further domain data, safety certification, scaling, or integration with specialized tools and real-time systems.
- Real-time planning and safety in robotics/autonomous systems (Robotics)
- Description: Agents that actively construct geometric/semantic maps and invoke visual reasoning adaptively to plan safe trajectories under global constraints.
- Tools/products/workflows:
- “Figure-steered planners” integrated with ROS and simulation; visual verification layers that accompany path decisions.
- Assumptions/dependencies: Robust perception pipelines; real-time guarantees; safety validation; domain-specific benchmarks beyond math.
- CAD/EDA constraint proving and automated layout verification (Manufacturing, Semiconductor)
- Description: Formalized figure-grounded reasoning to check PCB/IC layout constraints (clearances, connectivity) and architectural blueprints.
- Tools/products/workflows:
- EDA plugins that generate proof-like visualizations linked to rule decks; AEC viewers with executable constraint scripts.
- Assumptions/dependencies: Deep domain schemas; interoperability with proprietary CAD/EDA formats; certification processes.
- Clinical planning and medical physics (Healthcare)
- Description: Radiation therapy dose planning, surgical pathway visualization, and orthopedic templating with figure-steered reasoning over anatomical constraints.
- Tools/products/workflows:
- Clinical decision support that renders constraint-verified plans and explanations; sandboxed execution in regulated environments.
- Assumptions/dependencies: Medical imaging integration; rigorous validation and FDA/CE approval; bias and safety audits.
- GIS-informed urban planning and policy analysis (Public sector)
- Description: Scenario analysis tools that reason over zoning setbacks, sightlines, traffic flows, and infrastructure constraints with adaptive visual invocation.
- Tools/products/workflows:
- City dashboards that produce reproducible scenario figures and code, aiding transparent stakeholder engagement.
- Assumptions/dependencies: GIS data licensing, domain reward shaping (beyond binary correctness), participatory governance requirements.
- Scientific discovery assistants for physics/chemistry/biology (Academia, R&D)
- Description: Agents that construct and iterate on experimental diagrams (optics setups, reaction pathways, mechanical systems) within a figure-steered reasoning loop.
- Tools/products/workflows:
- Lab notebooks that tie hypotheses to executable visualizations; simulation coupling (COMSOL, OpenFOAM).
- Assumptions/dependencies: Domain simulators; rich reward signals (matching empirical results); extensive dataset curation.
- Enterprise decision support for supply chains and networks (Finance, Operations)
- Description: Constraint-aware visual reasoning over multi-echelon supply networks, credit risk graphs, and resource flows.
- Tools/products/workflows:
- “Network Reasoner” that visualizes trade-offs and validates global feasibility across scenarios.
- Assumptions/dependencies: Access to proprietary data; privacy-preserving training; explainability standards.
- Interactive textbooks and assessment at scale (Education)
- Description: Next-generation curricula where every problem includes interactive, code-backed diagrams and adaptive reasoning paths.
- Tools/products/workflows:
- Standards-compliant content platforms with embedded figure code; auto-auditing for consistency and fairness.
- Assumptions/dependencies: Content authoring standards; educator training; accessibility compliance.
- Multimodal agent platforms with figure-grounded verification (Software ecosystems)
- Description: General-purpose agents that decide when to visualize, simulate, or prove constraints, using adaptive reward signals to stabilize tool use across tasks.
- Tools/products/workflows:
- Platform-level “Visual Chain-of-Thought Engine” with plug-in interpreters (vision, math, GIS, CAD).
- Assumptions/dependencies: Modular tool APIs; robust RL infrastructure; governance for code execution security.
- Auditable, reproducible scientific publishing and review (Publishing)
- Description: Journals mandate executable figure artifacts for methods sections—improving transparency and reusability.
- Tools/products/workflows:
- Reproducibility badges tied to figure code and environment manifests.
- Assumptions/dependencies: Community norms; artifact review capacity; long-term archival infrastructure.
- Risk modeling with constraint graphs and interpretable visuals (Finance/Insurance)
- Description: Figure-steered reasoning for complex dependency structures (counterparty risk, portfolio hedging) to improve transparency of model decisions.
- Tools/products/workflows:
- Analyst workbenches that render constraint graphs and scenario outcomes with executable artifacts.
- Assumptions/dependencies: Domain data, compliance and audit requirements; strong governance around model risk.
- Safety-certified adaptive tool-use policies (Cross-sector)
- Description: Formalization of the Adaptive Reward Mechanism for regulated environments, ensuring agents only invoke tools (including drawing) when justified.
- Tools/products/workflows:
- Policy engines that log visual/tool invocations with justification traces and outcomes.
- Assumptions/dependencies: Policy verification; standardized telemetry; external audits and certifications.
Cross-cutting assumptions and dependencies
- Model and training: Access to instruction-tuned multimodal bases (e.g., Qwen3-VL-32B-Instruct), RL infrastructure (e.g., GRPO, VeRL/HybridFlow), and domain-appropriate datasets beyond math (physics, CAD, GIS, healthcare).
- Execution security: Strong sandboxing for code execution, dependency pinning, and reproducibility (containerized environments).
- Visual libraries: Stable, precise rendering backends (e.g., Matplotlib, Shapely, SVG engines) and domain-specific interpreters (CAD/GIS/medical).
- Reward design: Extension of correctness/formats to domain-appropriate signals (metrics beyond binary answer correctness).
- Human oversight and compliance: Expert review for high-stakes domains; governance for data privacy, bias, and safety.
- Integration: APIs to existing tools (CAD/EDA/GIS/ROS), enterprise data connectors, and documentation/publishing platforms.
Collections
Sign up for free to add this paper to one or more collections.