Drag the zeros and poles of a complex function and count them with a loop.
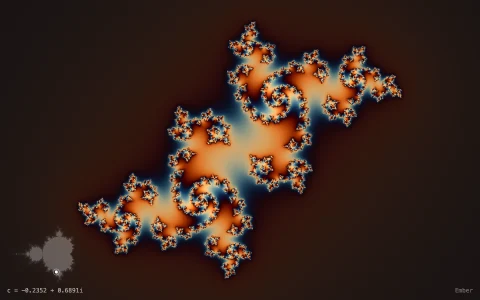
Every pixel is a complex number z, colored by the phase of f(z): zeros are points where the whole color wheel meets counterclockwise and poles turn it the other way. Following Wegert's enhanced phase portraits, sawtooth bands of log|f| and of arg f with equal widths form a conformal grid of little squares, and contrast fades wherever the bands get finer than a pixel (the Cauchy-Riemann equations make both gradients the same size). Rational functions and Blaschke products are evaluated exactly per pixel at adaptive resolution; Gamma (Lanczos with reflection) and zeta (Borwein's accelerated eta series plus the functional equation) are cached as the entire functions 1/Gamma and (s - 1) zeta(s) on a half-resolution grid, interpolated, and their poles restored exactly. Drawing a loop runs the argument principle: arg f is summed along the loop with adaptive subdivision, and its winding, also traced as the image curve in a w-plane inset, equals the zeros minus the poles inside.
Try it. Drag any zero (dark dot) or pole (white square). Draw a loop anywhere to count what it encloses, and watch the count change live as handles cross it. Buttons or keys 1 to 5 switch between rational, Blaschke, Gamma, zeta and exp(1/z); M cycles phase, modulus, conformal grid and tiles; Z and P add a zero or pole at the cursor, X removes the nearest, F sets the phase flowing, the wheel or plus and minus zoom, and the arrows pan.
Paste this into Claude Code, Codex or any coding agent to get a simple version running, then take it wherever you like.
Build a domain coloring explorer for complex functions with JavaScript and the HTML canvas element. Put everything in a single index.html file with no libraries or build step, so I can open it directly in a browser.

Start simple:
- Make a canvas that fills the window and resizes with it. Map each pixel to a complex number z, with the origin in the middle and about 5 units across the screen.
- Write a few tiny complex helpers yourself (add, multiply, divide) using plain objects with re and im fields or pairs of numbers.
- Define f(z) = (z - a)(z - b)(z - c) / (z - d) for four points you choose. For each pixel compute w = f(z), then color it by the angle of w: hue = atan2(w.im, w.re) mapped onto a color wheel. Render into a smaller ImageData buffer (half the screen size) and draw it scaled up so it stays fast.
- Draw the zeros as small dark circles and the pole as a white square, and let the mouse drag them. Recompute the image whenever something moves.

Once that works, make it beautiful:
- Add modulus contours: compute L = log|w| and darken each pixel by the fractional part of L / (2 pi / 16), so rings of constant size appear around zeros and poles.
- Add the same sawtooth on the angle with the same band width. Where both families cross they form small squares, a conformal grid, because analytic functions preserve angles.
- Fade the bands out where they get denser than the pixels, using the difference between neighboring L values.
- Let me draw a loop with the mouse. Walk along it, add up the change in the angle of f (wrapped into -pi to pi at each small step), and show the total divided by 2 pi. That is the argument principle: zeros minus poles inside the loop.

Explain the key ideas in short code comments. When you're done, tell me how to open it and suggest three directions I could take it next, such as adding exp, sin or the Gamma function, animating the phase by multiplying f by e^(it), or showing the image of the loop in a second w-plane view.