A mountain range inked stroke by stroke, with exact floating-horizon hidden lines.
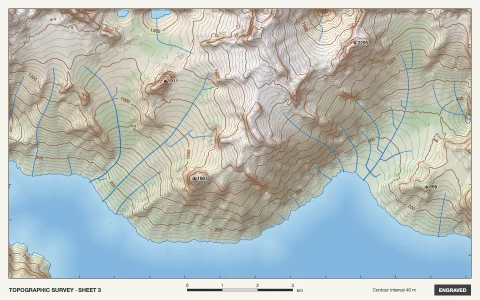
A domain-warped ridged-noise range is cut into slices at constant depth and drawn front to back, the way a pen plotter would draw it. A floating horizon, the highest point inked so far in every screen column, decides what is hidden: a slice is drawn only where it rises above that horizon, and each crossing is found by bisection, so strokes stop cleanly where they pass behind a ridge. The same horizon clips marching-squares contours and hachures drawn down the fall line and shaded by Lambert lighting. Every stroke goes to a simulated pen with a slight wobble and a dot of ink at each touch-down, and a red sun is set into the lowest notch of the finished skyline.
Try it. Drag to change the view angle (a quick proof plots while you drag). Scroll or use the minus and plus buttons to change the line density, and pick Ridgelines, Contours or Hachures. Click the sheet or press N for a new range. Keys 1 to 3 (or Space) switch plates, the left and right arrows turn the view, and up and down change the density.
Paste this into Claude Code, Codex or any coding agent to get a simple version running, then take it wherever you like.
Build a pen-plotter style mountain landscape with JavaScript and the HTML canvas element, using the floating horizon algorithm for hidden line removal. Put everything in a single index.html file with no libraries or build step, so I can open it directly in a browser.

Start simple:
- Make a canvas that fills the window, stays sharp on high-DPI screens (scale by devicePixelRatio), and resizes with the window. Paint it an off-white paper color.
- Write a small 2D Perlin or value noise function yourself, and a height function that adds a few octaves of it to make hills.
- Draw about 80 horizontal profile lines, front to back. Line i samples the height along x at depth z_i and is drawn at screen y = baseline(z_i) minus height times a scale, with the baseline rising for lines further away.
- Hidden line removal: keep an array with one number per pixel column, the highest point (smallest y) drawn so far. Draw each new line only where it is above that value, then update the array with the line. Because you draw front to back, everything behind a ridge disappears.
- Draw with thin dark strokes and no fill.

Once that works, make it beautiful:
- Use a perspective projection so distant lines crowd toward a horizon, and ridged noise so the far range has sharp peaks.
- Where a line crosses the horizon between two columns, find the exact crossing point so strokes end cleanly at ridges.
- Plot the lines over time instead of all at once, a few hundred pixels of ink per frame, with a tiny wobble, so you can watch it draw like a real plotter.
- Add a red sun of concentric circles behind the range, clipped by the same horizon.

Explain the key ideas in short code comments. When you're done, tell me how to open it and suggest three directions I could take it next, such as contour lines instead of profiles, hachure shading down the slopes, or exporting the strokes as SVG for a real plotter.