Hilbert, Peano, Gosper and friends fold smoothly from one order to the next.
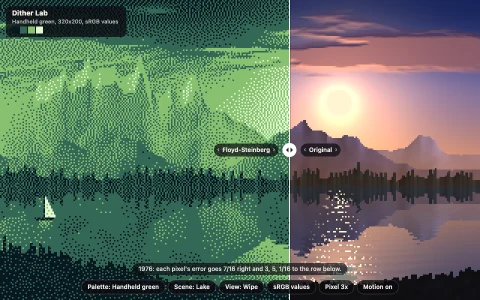
Six classic curves (Hilbert, Moore, Peano, Sierpinski, Gosper's flowsnake and the Z-order used by databases) are built as refinements: each order visits the children of every cell of the previous order consecutively. That lets both orders share one parameter u, so every point of order n+1 is morphed from where order n was at the same u, and the order becomes a real number you can scrub while cells split and fold into their children and the length doubles toward infinity. Color runs along the curve, so the smooth gradients are locality made visible, and hovering shows how a short stretch of the 1D line covers a compact 2D patch. The dither mode reads a procedural painting along the curve into one long line of memory and error-diffuses it along that line (Riemersma dithering), revealed pixel by pixel as the curve sweeps the square.
Try it. Drag across the square or the order slider to scrub the order continuously, or use the arrow keys to step it. Pick a curve with the chips or keys 1 to 6, hover to see locality, press D for the dither mode and Space to pause.
Paste this into Claude Code, Codex or any coding agent to get a simple version running, then take it wherever you like.
Build an animated Hilbert curve explorer with JavaScript and the HTML canvas element. Put everything in a single index.html file with no libraries or build step, so I can open it directly in a browser.

Start simple:
- Make a canvas that fills the window, stays sharp on high-DPI screens, and resizes with the window. Paint it a dark background and center a square drawing area in it.
- Write a recursive function hilbert(x0, y0, xi, xj, yi, yj, n) that, at depth zero, outputs the center of the cell spanned by the vectors (xi, xj) and (yi, yj), and otherwise calls itself four times with the classic half-size, swapped and flipped vectors. Call it for orders 1 to 7 and keep each order's list of points.
- Draw one order as a polyline with round joins, line width about half the cell size, and color each segment by its position along the curve (a hue that goes once around the color wheel).
- Let the arrow keys change the order.

Once that works, make it beautiful:
- Morph between orders. Order n+1 has four times as many points and visits the four children of each order n cell in a row, so point i of order n+1 can start at the order n curve sampled at the same fraction along its length. Interpolate every point from there to its real position with a smoothstep, and let a slider or a horizontal drag set the order as a real number.
- Interpolate the line width between the two orders too, and slowly cycle the colors along the curve.
- Add a second mode that reads a procedurally drawn picture along the curve and dithers it to a few colors by carrying the quantization error forward to the next points on the curve.

Explain the key ideas in short code comments. When you're done, tell me how to open it and suggest three directions I could take it next, such as adding the Peano or Gosper curves, highlighting how a short stretch of the line covers a compact patch, or comparing it with the Z-order curve that jumps.