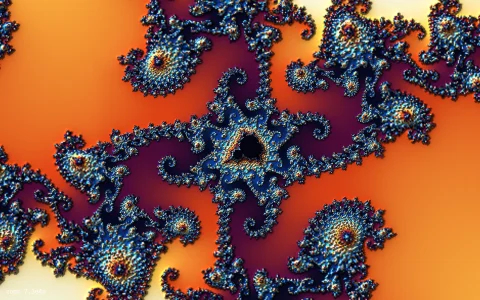
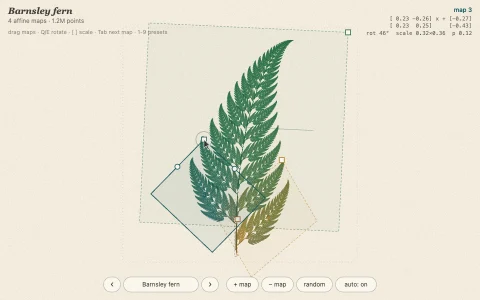
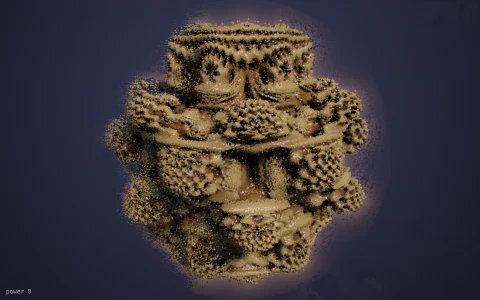
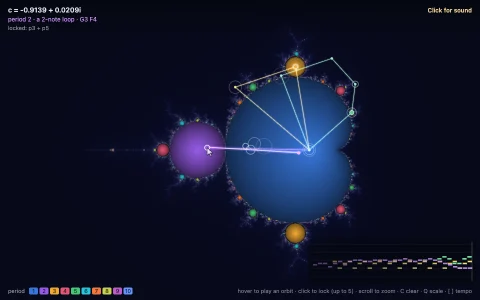
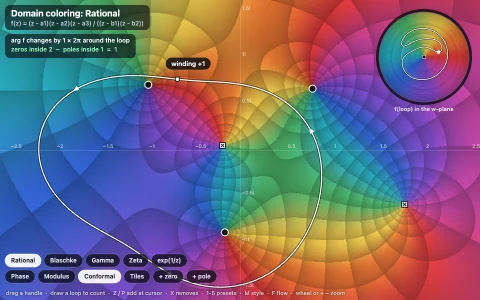
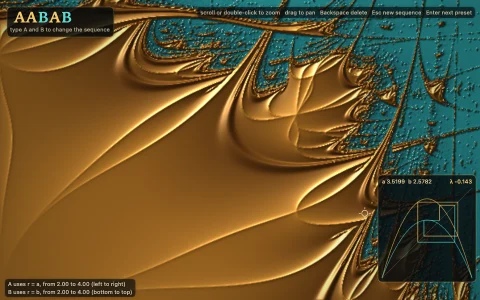
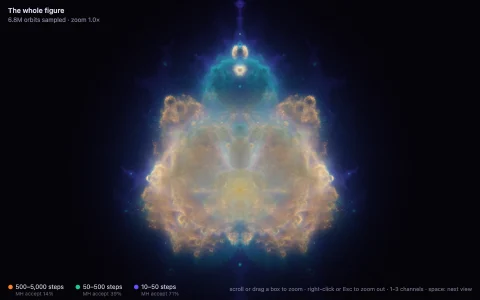
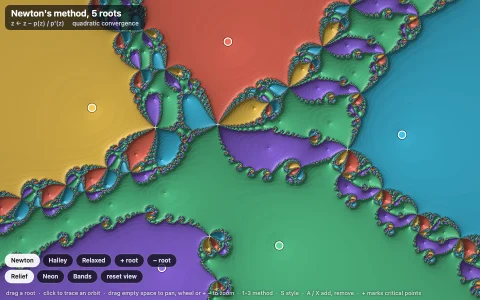
A fractal that reshapes itself as its complex constant wanders.
Each pixel is a complex number z, repeatedly squared and offset by a constant c until it escapes or a limit is hit. The escape count, smoothed with a logarithm so the bands blend, picks a color from a cosine palette. Every frame is computed directly into an ImageData buffer, and c traces a slow loop so the fractal continuously morphs between dust, dendrites and spirals.
Try it. Move the pointer to choose the constant c. Click to cycle color palettes. Hold still and it sharpens to full resolution.
Paste this into Claude Code, Codex or any coding agent to get a simple version running, then take it wherever you like.
Build an animated Julia set fractal with JavaScript and the HTML canvas element. Put everything in a single index.html file with no libraries or build step, so I can open it directly in a browser.

Start simple:
- Make a canvas that fills the window and resizes with it. Do the fractal math in a smaller offscreen canvas (about half the window size) and draw it scaled up with drawImage, so it stays fast.
- For each pixel, map it to a complex number z, roughly -1.7 to 1.7 across and -1 to 1 down. Repeat z = z * z + c up to 150 times, stopping when |z| grows past 2 (compare x*x + y*y against 4 to skip the square root).
- Write the colors straight into an ImageData buffer with putImageData. Pixels that never escape are near-black.
- Start with c = -0.8 + 0.156i, then let the mouse position choose c (map the canvas to about -1.6 to 0.6 across and -1 to 1 down) so the fractal reshapes as you move.

Once that works, make it beautiful:
- Use smooth coloring instead of hard bands: escape with a larger radius (like 256), then compute n + 1 - log2(log|z|) and use that continuous value to pick a color.
- Color with a cosine palette: color(t) = a + b * cos(2 * PI * (c * t + d)), with a, b, c, d as RGB triples. Precompute it into a lookup table and let a click cycle between three or four palettes.
- When the mouse is idle, animate c slowly around the edge of the Mandelbrot set's main cardioid, c = e^(it)/2 - e^(2it)/4, where the most intricate shapes live.
- Use the set's symmetry (z and -z behave the same) to compute only half the pixels.

Explain the key ideas in short code comments. When you're done, tell me how to open it and suggest three directions I could take it next, such as adaptive resolution while moving, a small Mandelbrot map showing where c is, or deep zooming with a mouse wheel.