Detecting unusual trading patterns on cryptocurrency exchanges by means of complexity measures
Abstract: Artificial transaction generation remains an important source of potential market manipulation on cryptocurrency exchanges, as it may distort reported liquidity and reduce market transparency. This study proposes a diagnostic framework for detecting unusual trading patterns based on complexity and statistical-structure measures derived from high-frequency trade-level data. The analysis considers log-returns, trading volume, and transaction counts, using tail distributions, autocorrelation functions, multifractal characteristics, approximate entropy, and detrended cross-correlations. The methodology is applied to BTC, ETH, and XRP traded on Binance, Bitget, KuCoin, and Kraken over the period from April 1 to June 30, 2025. The results reveal a pronounced anomaly on Bitget for BTC and ETH after mid-May 2025. The number of transactions increases sharply, but there is no proportional increase in traded volume or return fluctuations. This regime is characterised by numerous low-volume trades, weaker autocorrelations, reduced multifractal organisation, higher short-pattern irregularity, and weaker cross-correlations involving the transaction-count series. These features are consistent with a noise-like component in trading activity and may indicate artificially increased transaction counts, although they do not provide direct proof of wash trading. The findings show that complexity-based indicators can be useful for detecting exchange-specific trading anomalies that remain hidden in price-based measures.
Paper Prompts
Sign up for free to create and run prompts on this paper.
Top Community Prompts
Explain it Like I'm 14
Detecting Unusual Trading on Crypto Exchanges: A Simple Guide
What is this paper about?
This paper looks for unusual trading behavior on big cryptocurrency exchanges. The authors don’t try to catch single fake trades. Instead, they check whether the overall “shape” and “rhythm” of trading looks normal or odd. They do this using tools that measure complexity and patterns in fast, minute-by-minute data.
In short: they ask, “Does trading on a given exchange look like healthy, natural market activity—or does something feel artificially boosted?”
The main questions the paper asks
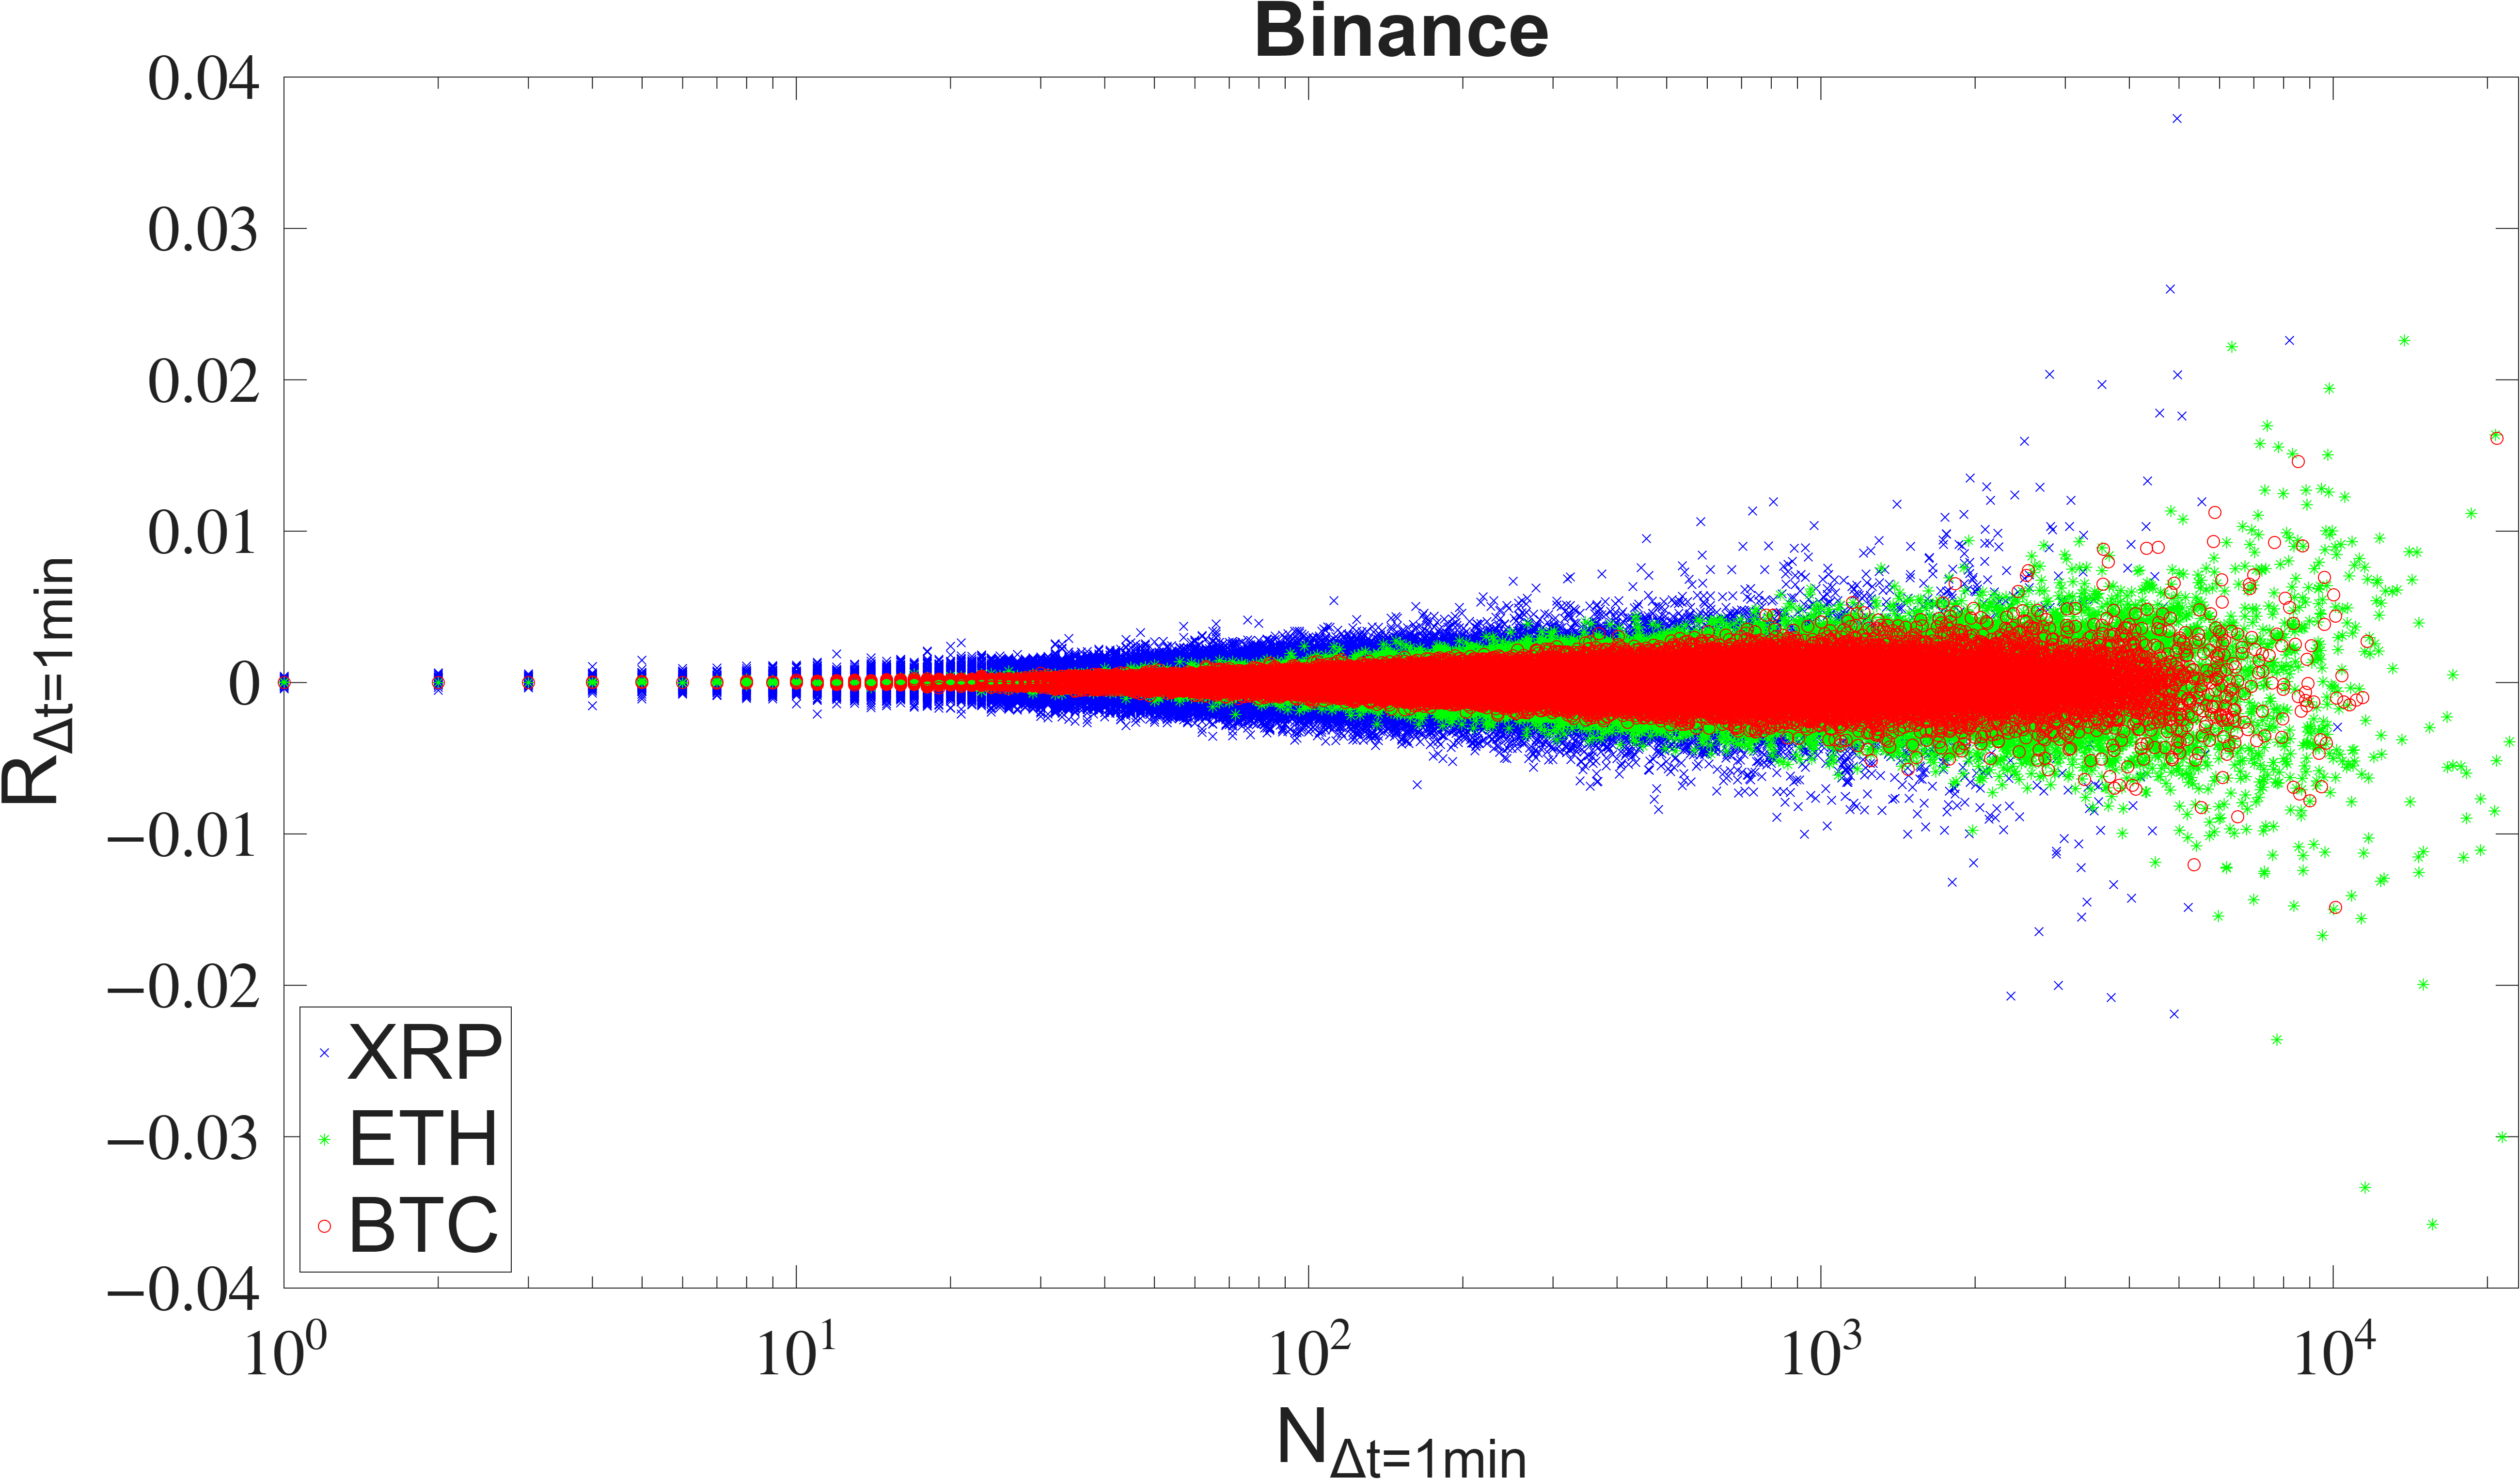
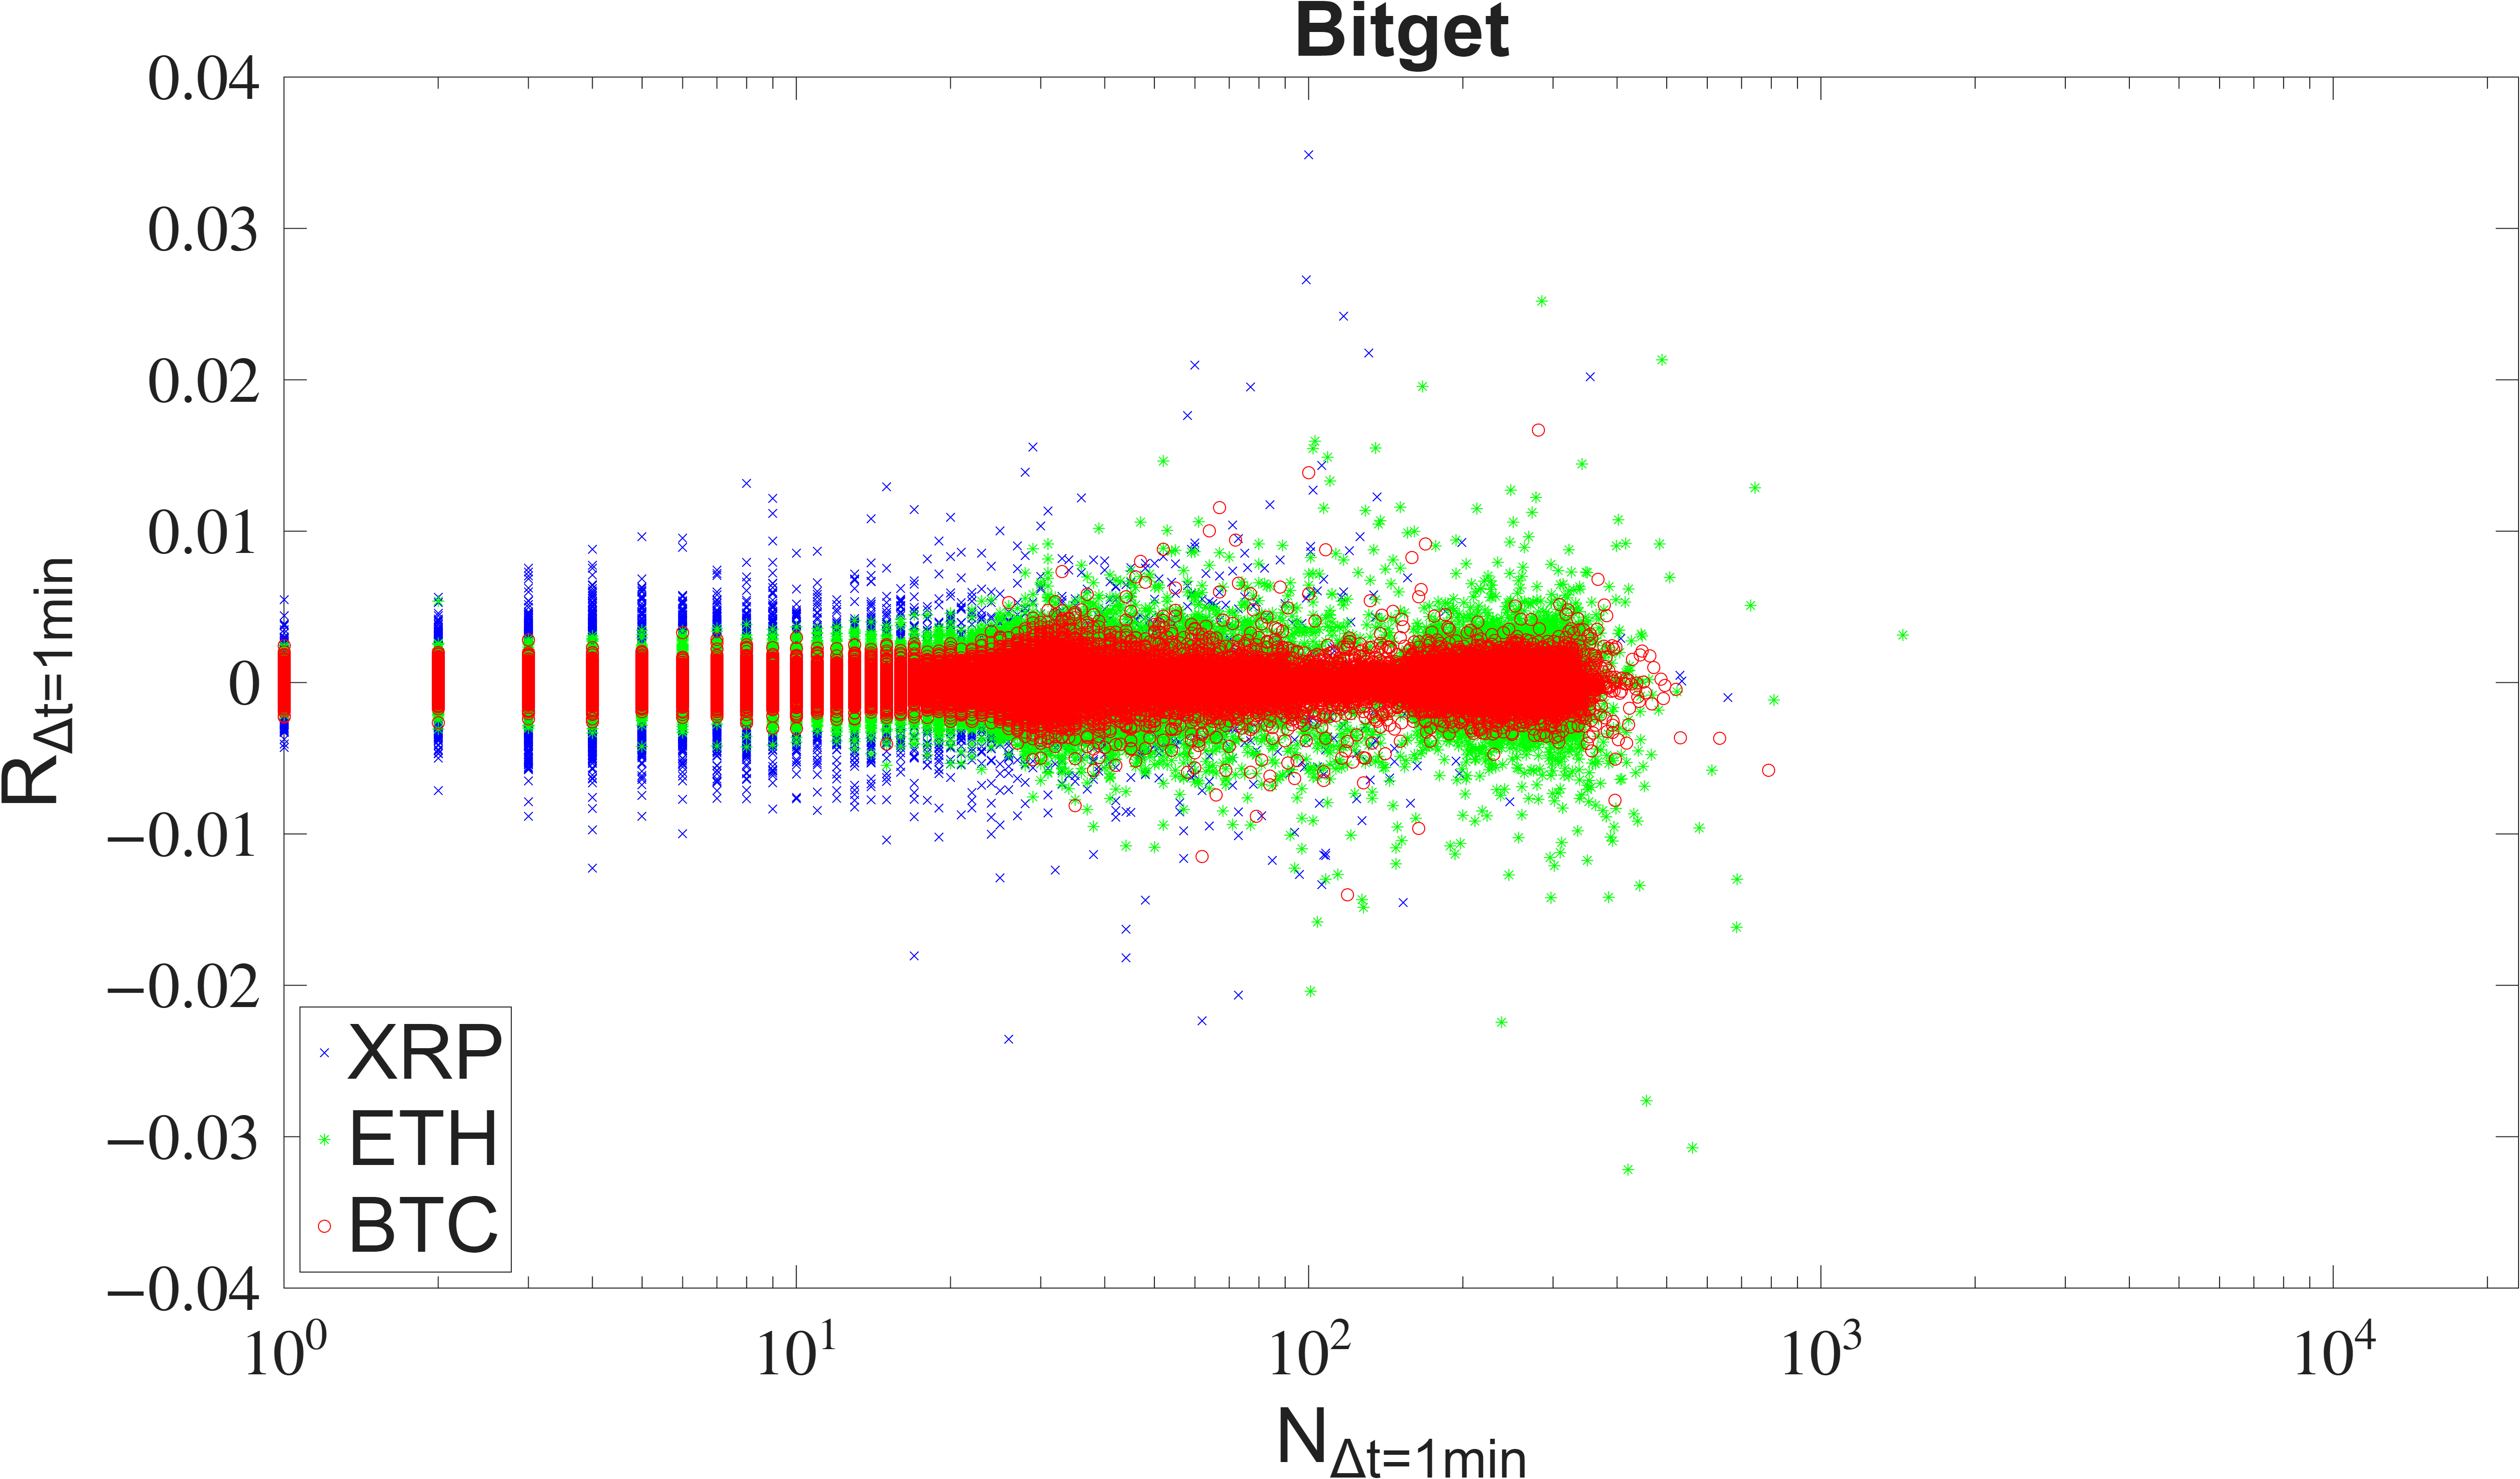
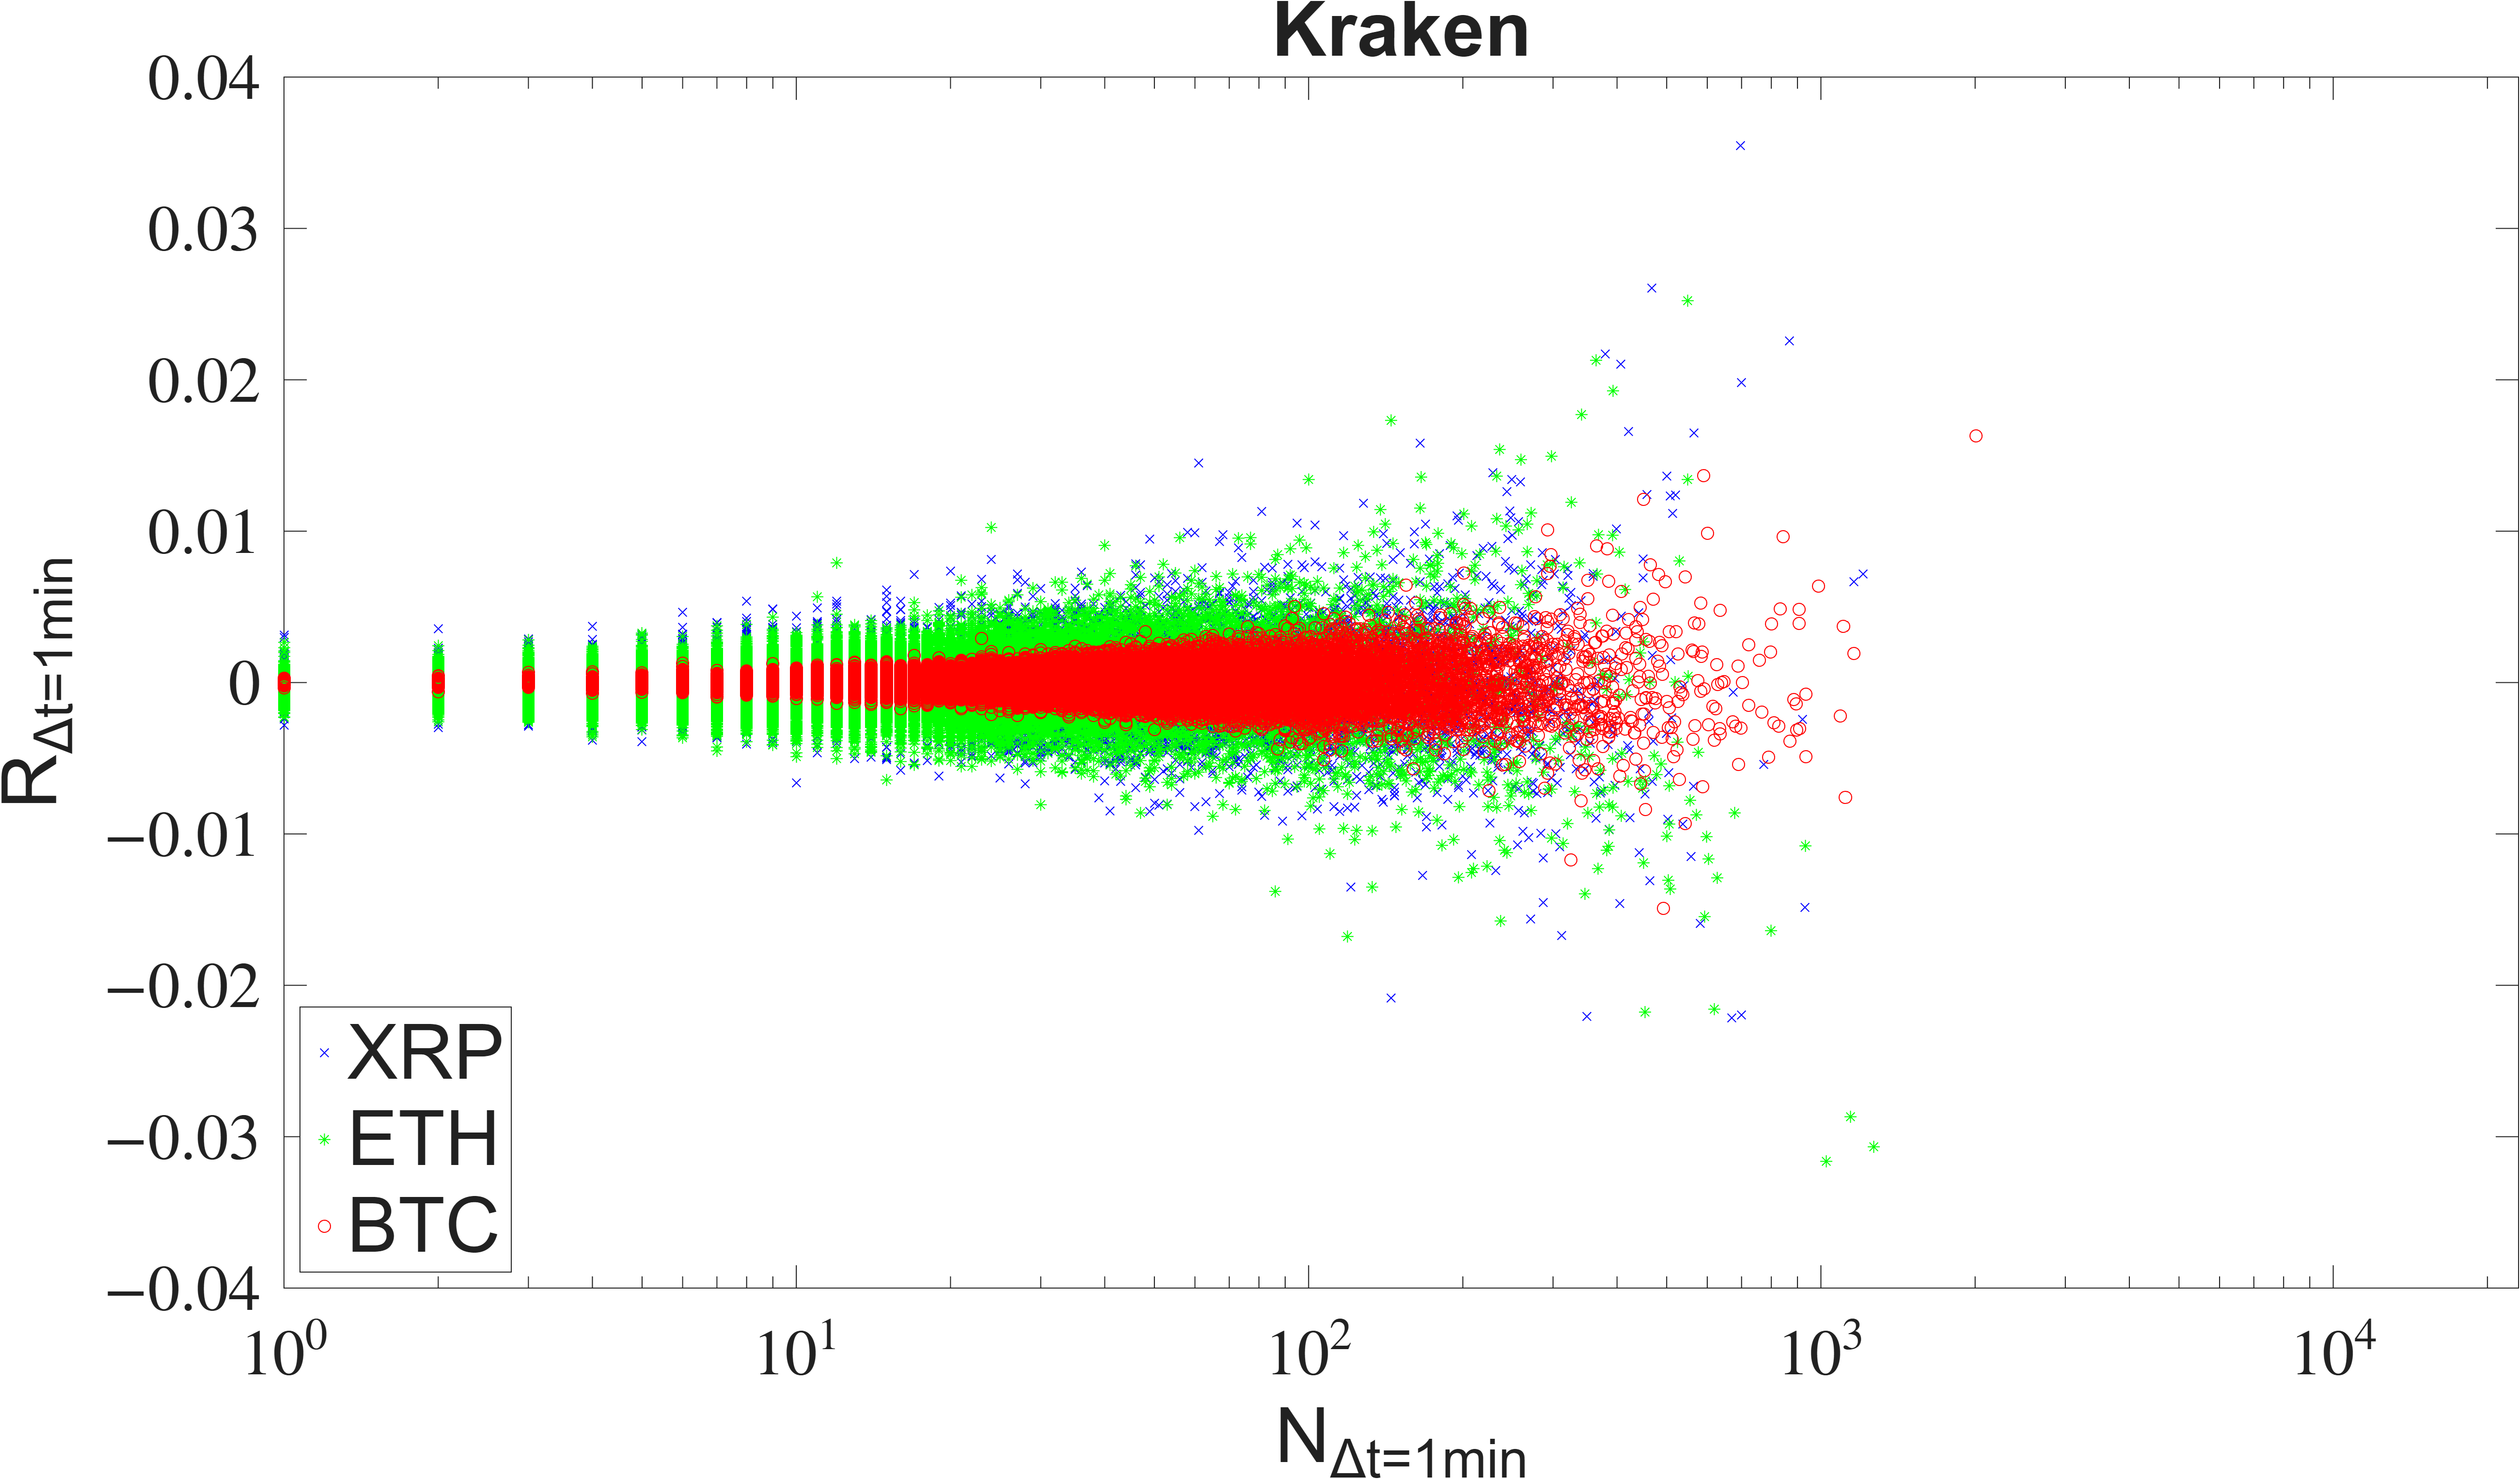
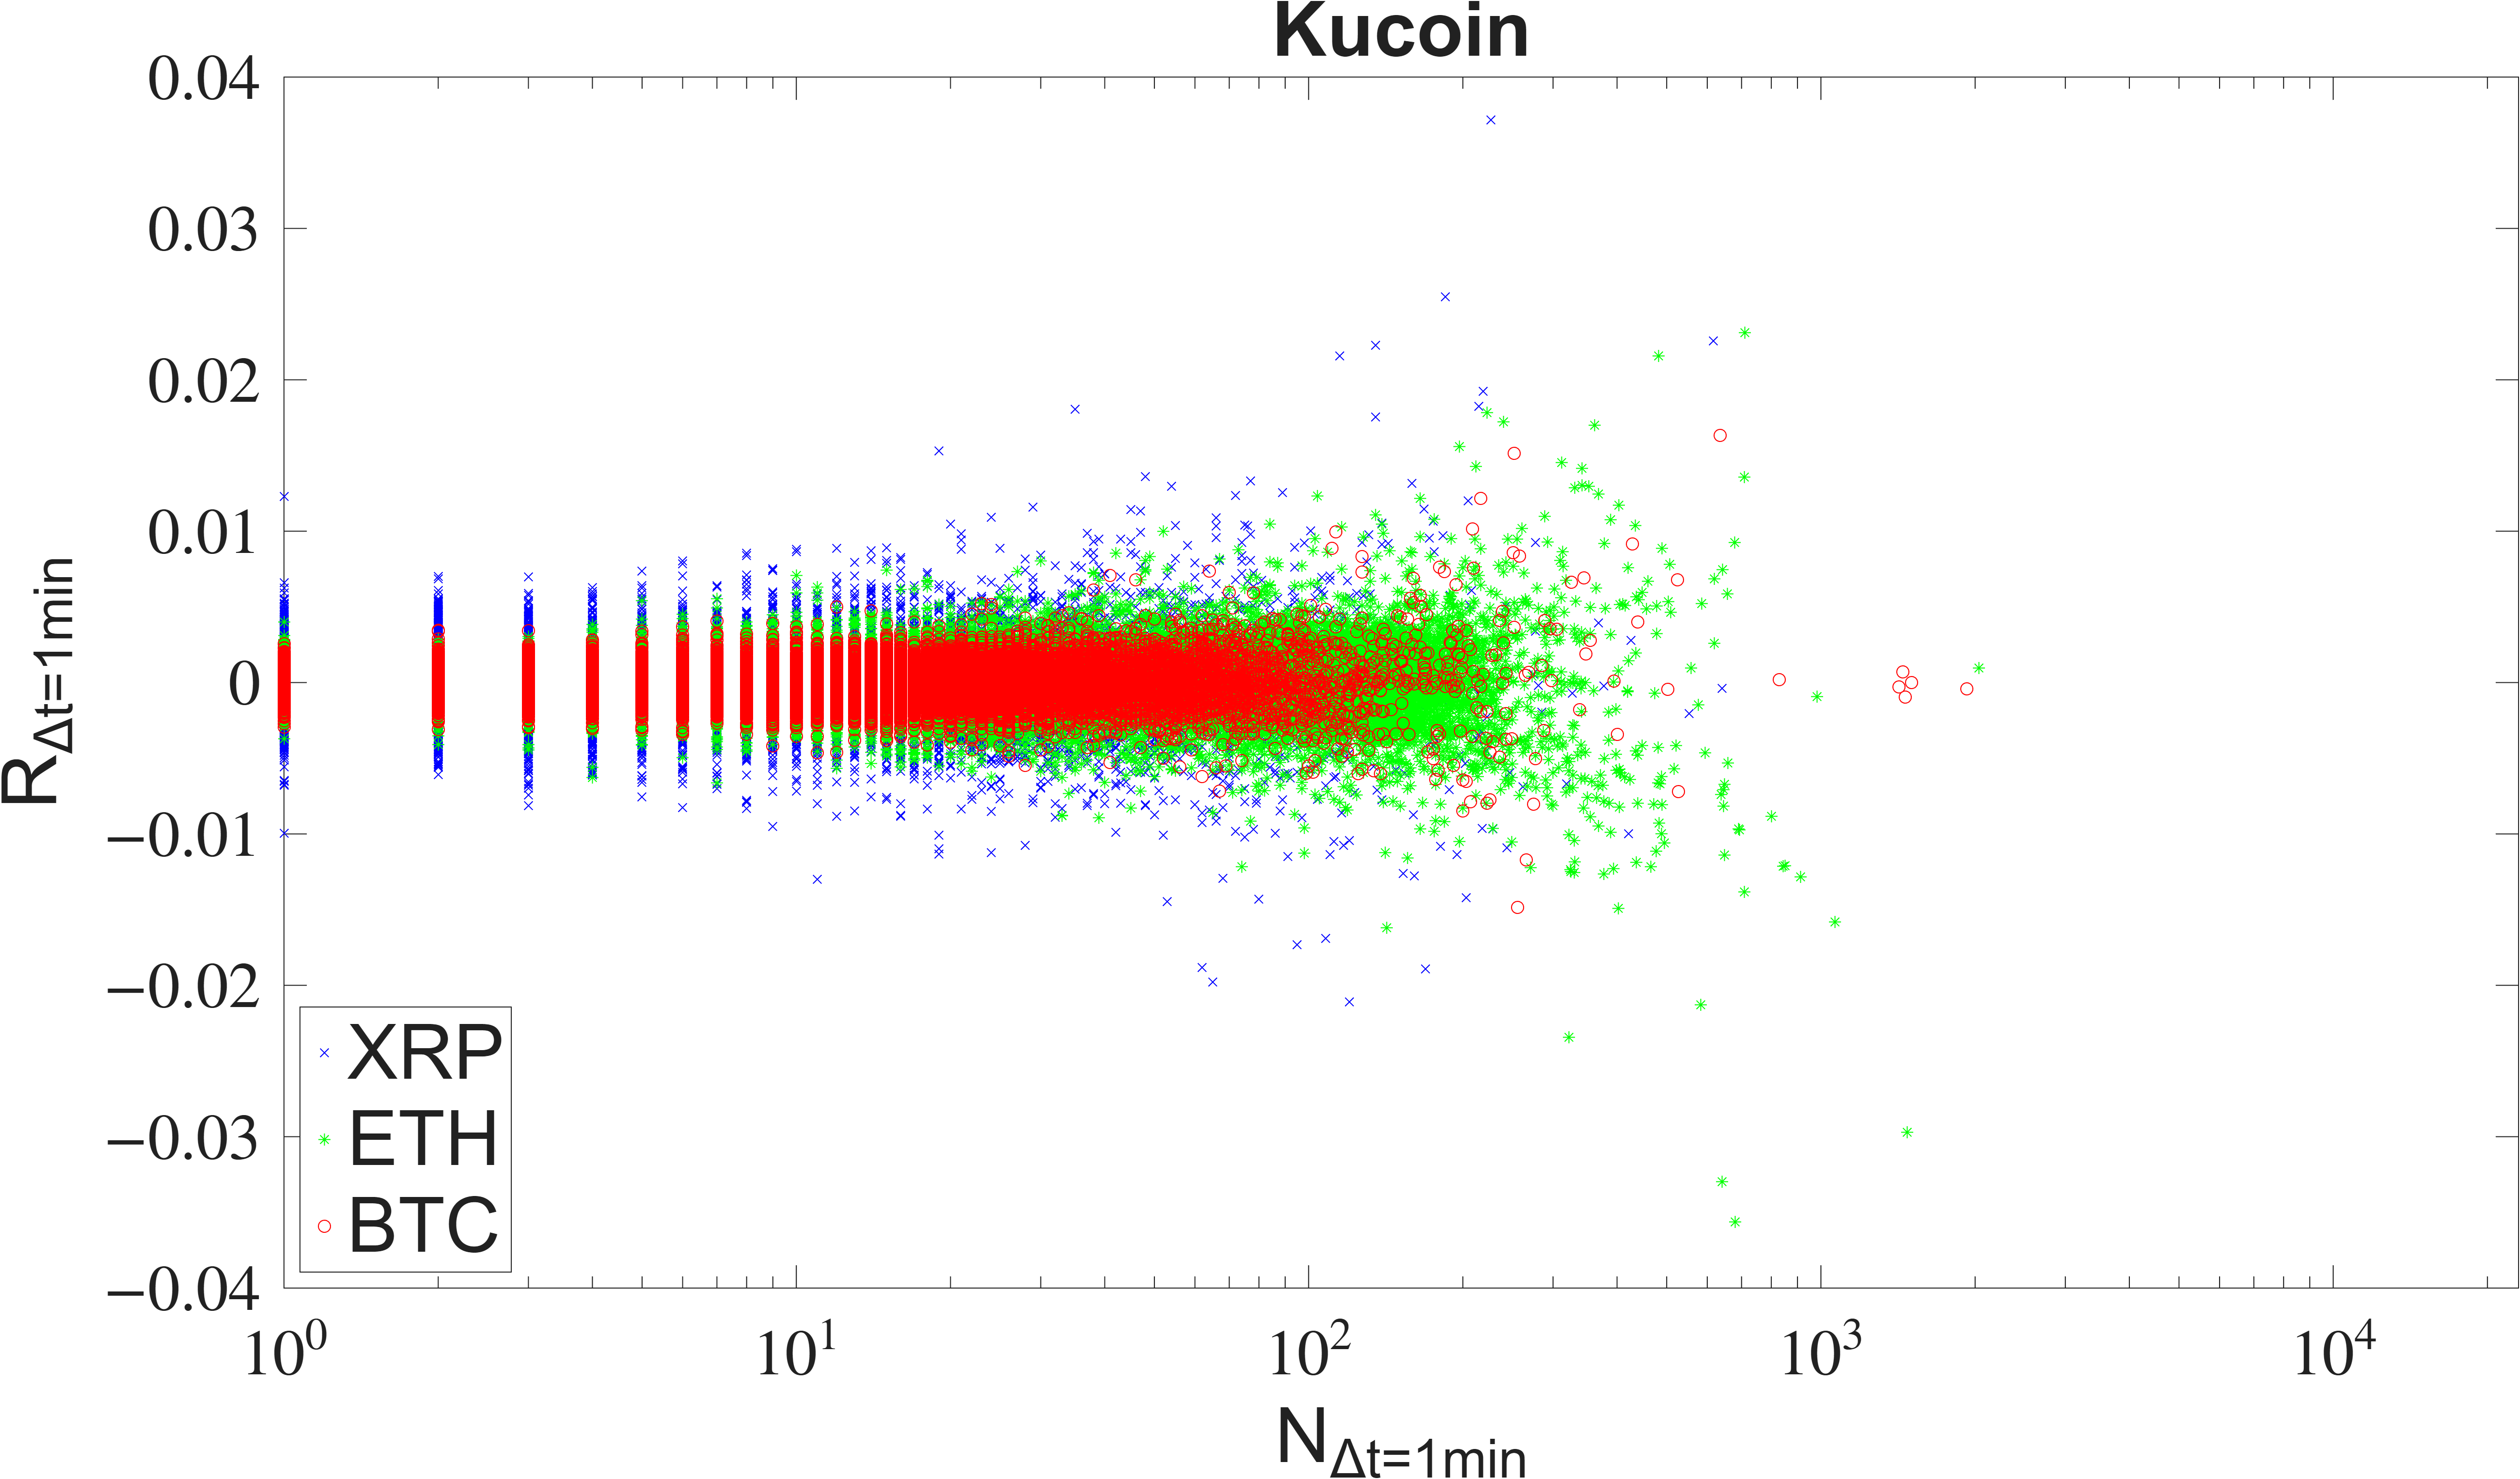
- Are there signs that some exchanges show unusually high “activity” (lots of trades) without the usual footprints (like higher traded volume or bigger price moves)?
- Do standard relationships—like “more trades usually equals more volume and more price movement”—hold up across exchanges?
- Can complexity-based measures help flag when trading starts to look more like noise (random choppy actions) than genuine market activity?
How the researchers studied it (in everyday language)
They analyzed three major coins—BTC, ETH, and XRP—traded on four well-known centralized exchanges: Binance, Bitget, KuCoin, and Kraken. The time period covered was April 1 to June 30, 2025. They looked at 1-minute slices of data and built three series:
- Price changes (log-returns): basically, how much price moved each minute
- Trading volume: how much of the coin changed hands each minute
- Number of transactions: how many trades happened each minute
To spot unusual behavior, they used several pattern-checking tools. Here’s what they mean in simple terms:
- Tail distributions: Look at how often very big moves happen. If “extreme events” are too common or too rare, that’s a clue.
- Autocorrelation: Checks “memory.” If a series tends to stick to a pattern for a long time (like long waves), autocorrelation stays high.
- Multifractals: Imagine zooming in and out on a coastline—its roughness looks similar at many scales. Markets often behave like that too. If this multi-scale pattern weakens, it can signal something is off.
- Detrended cross-correlations: After removing slow drifts, they measure how tightly two things move together across time scales (for example, whether “more trades” still pairs with “more volume” at short and long time windows).
- Approximate entropy (ApEn): A “messiness meter.” Higher ApEn means short-term patterns are less repeatable and more irregular—more like noise.
They also used rolling windows (sliding time frames) to see when and how behavior changed over the period.
What they found (plain and direct)
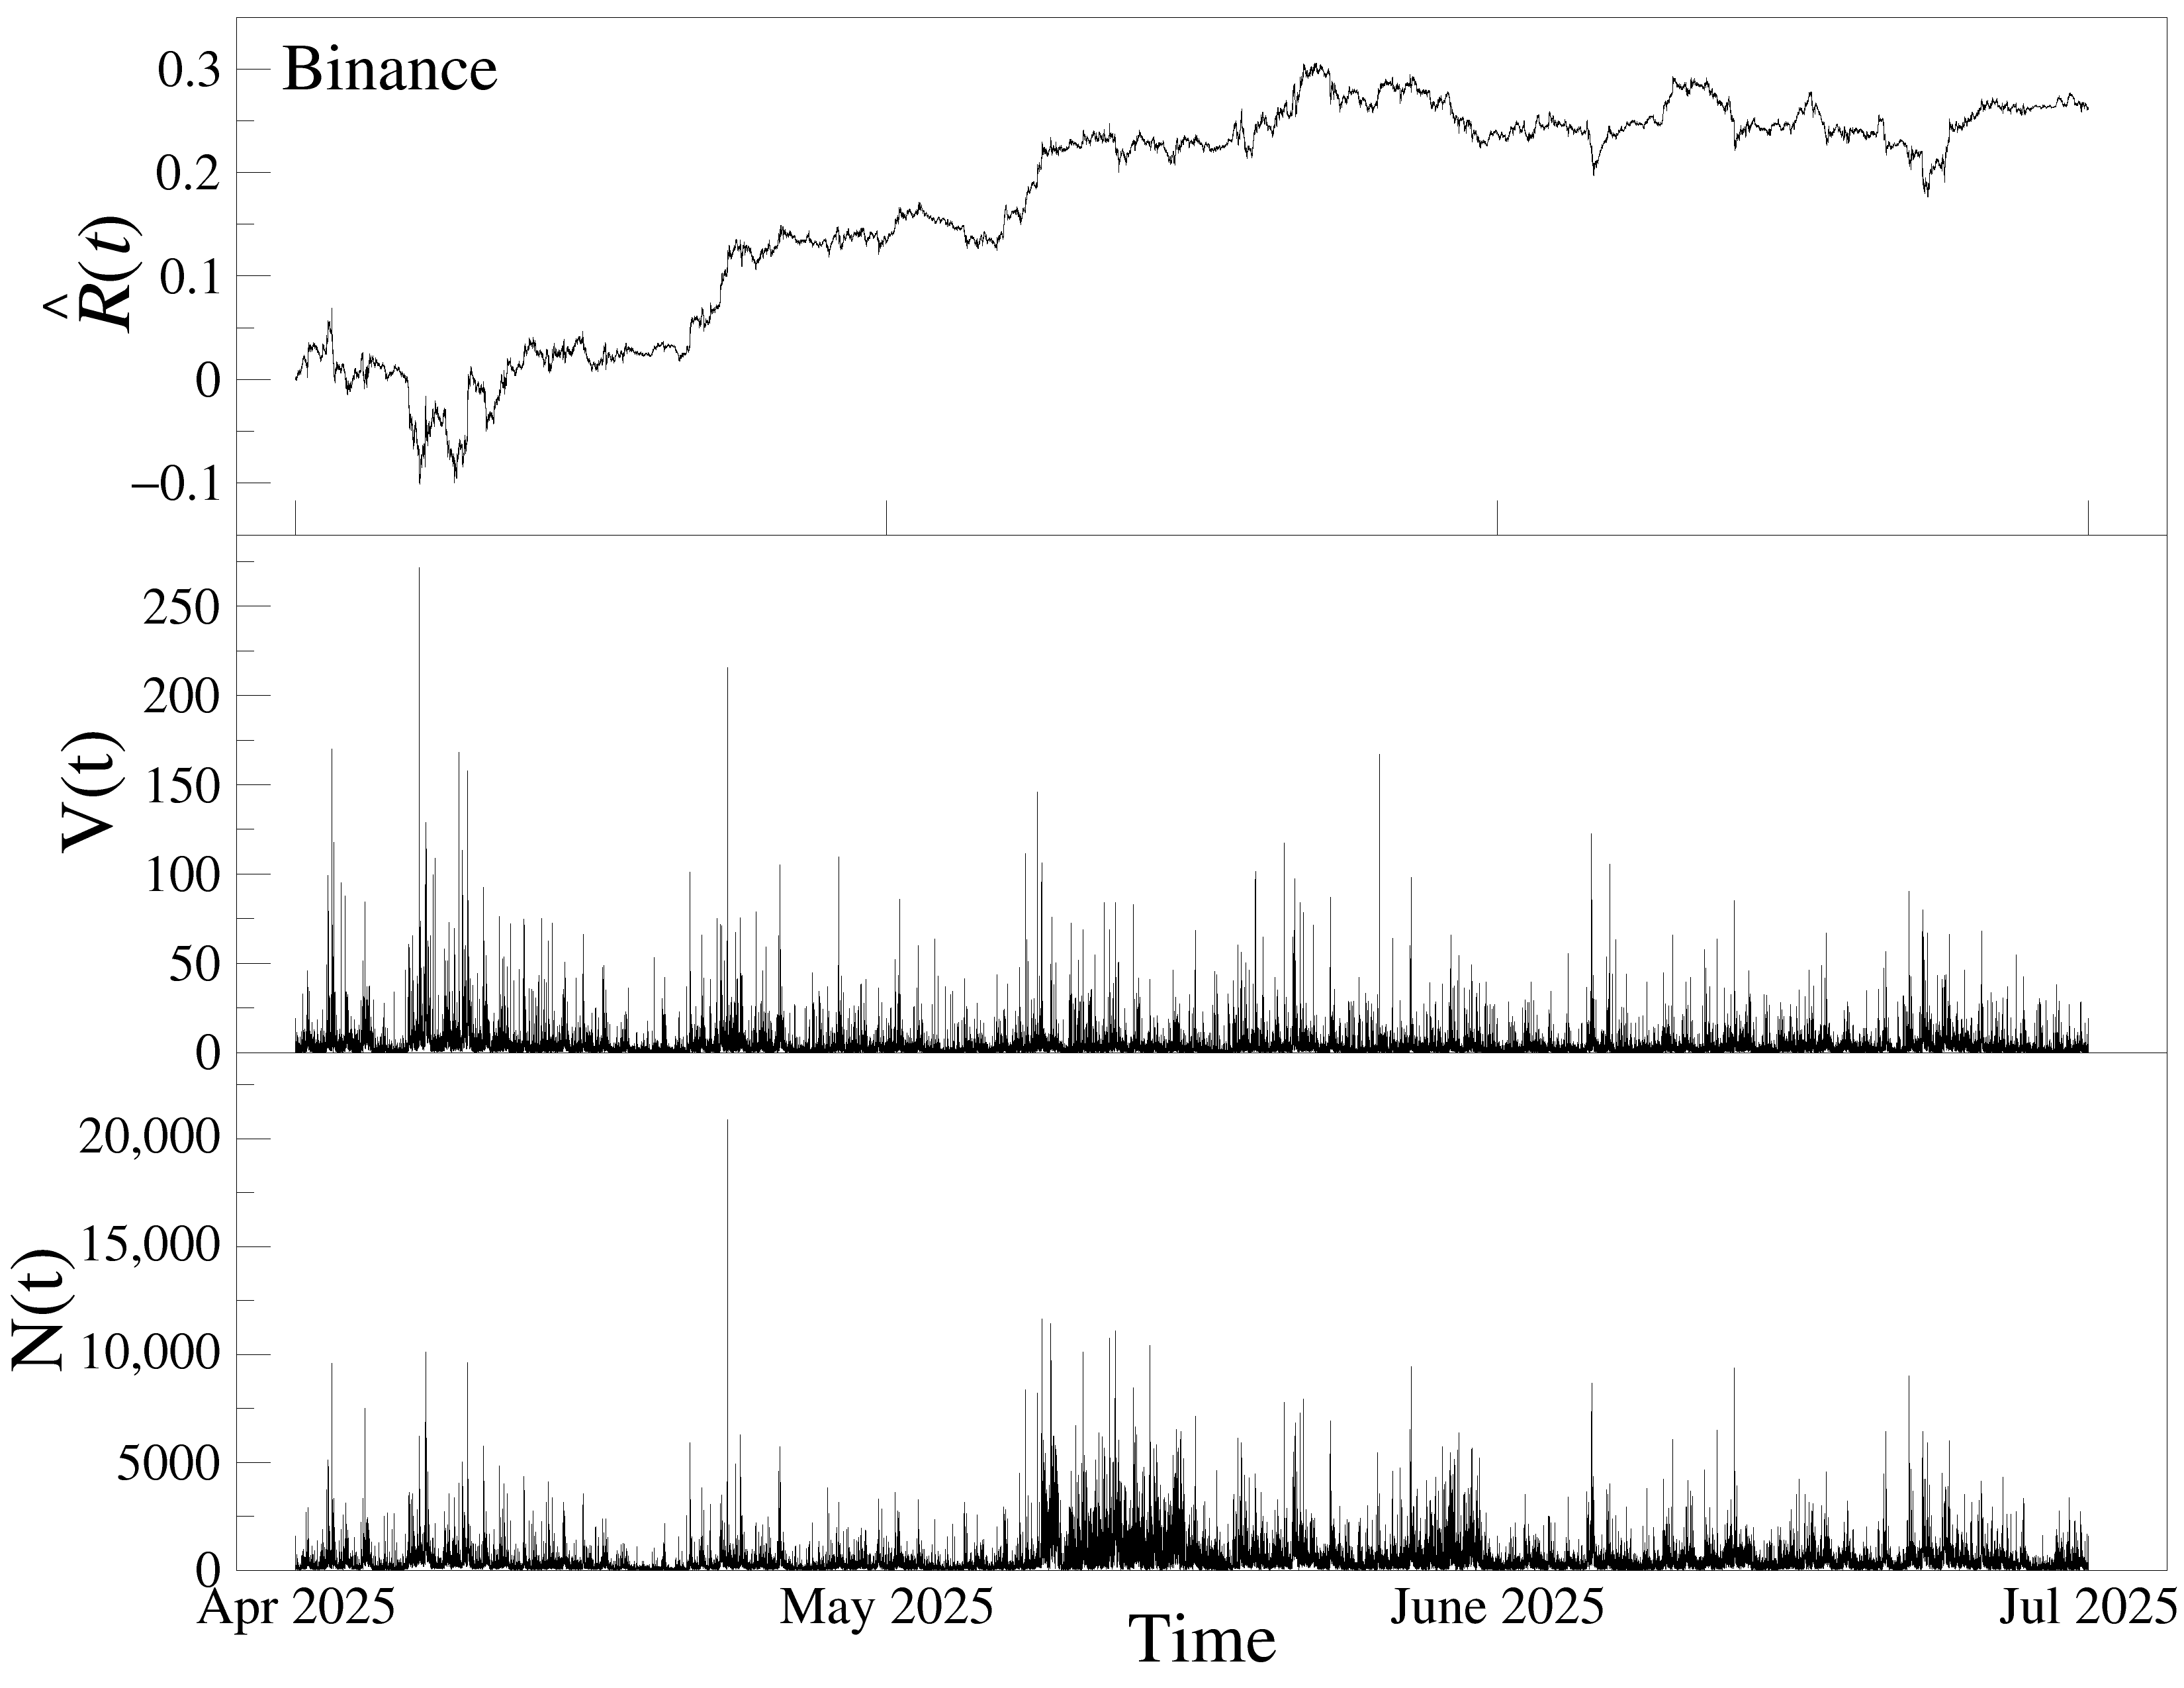
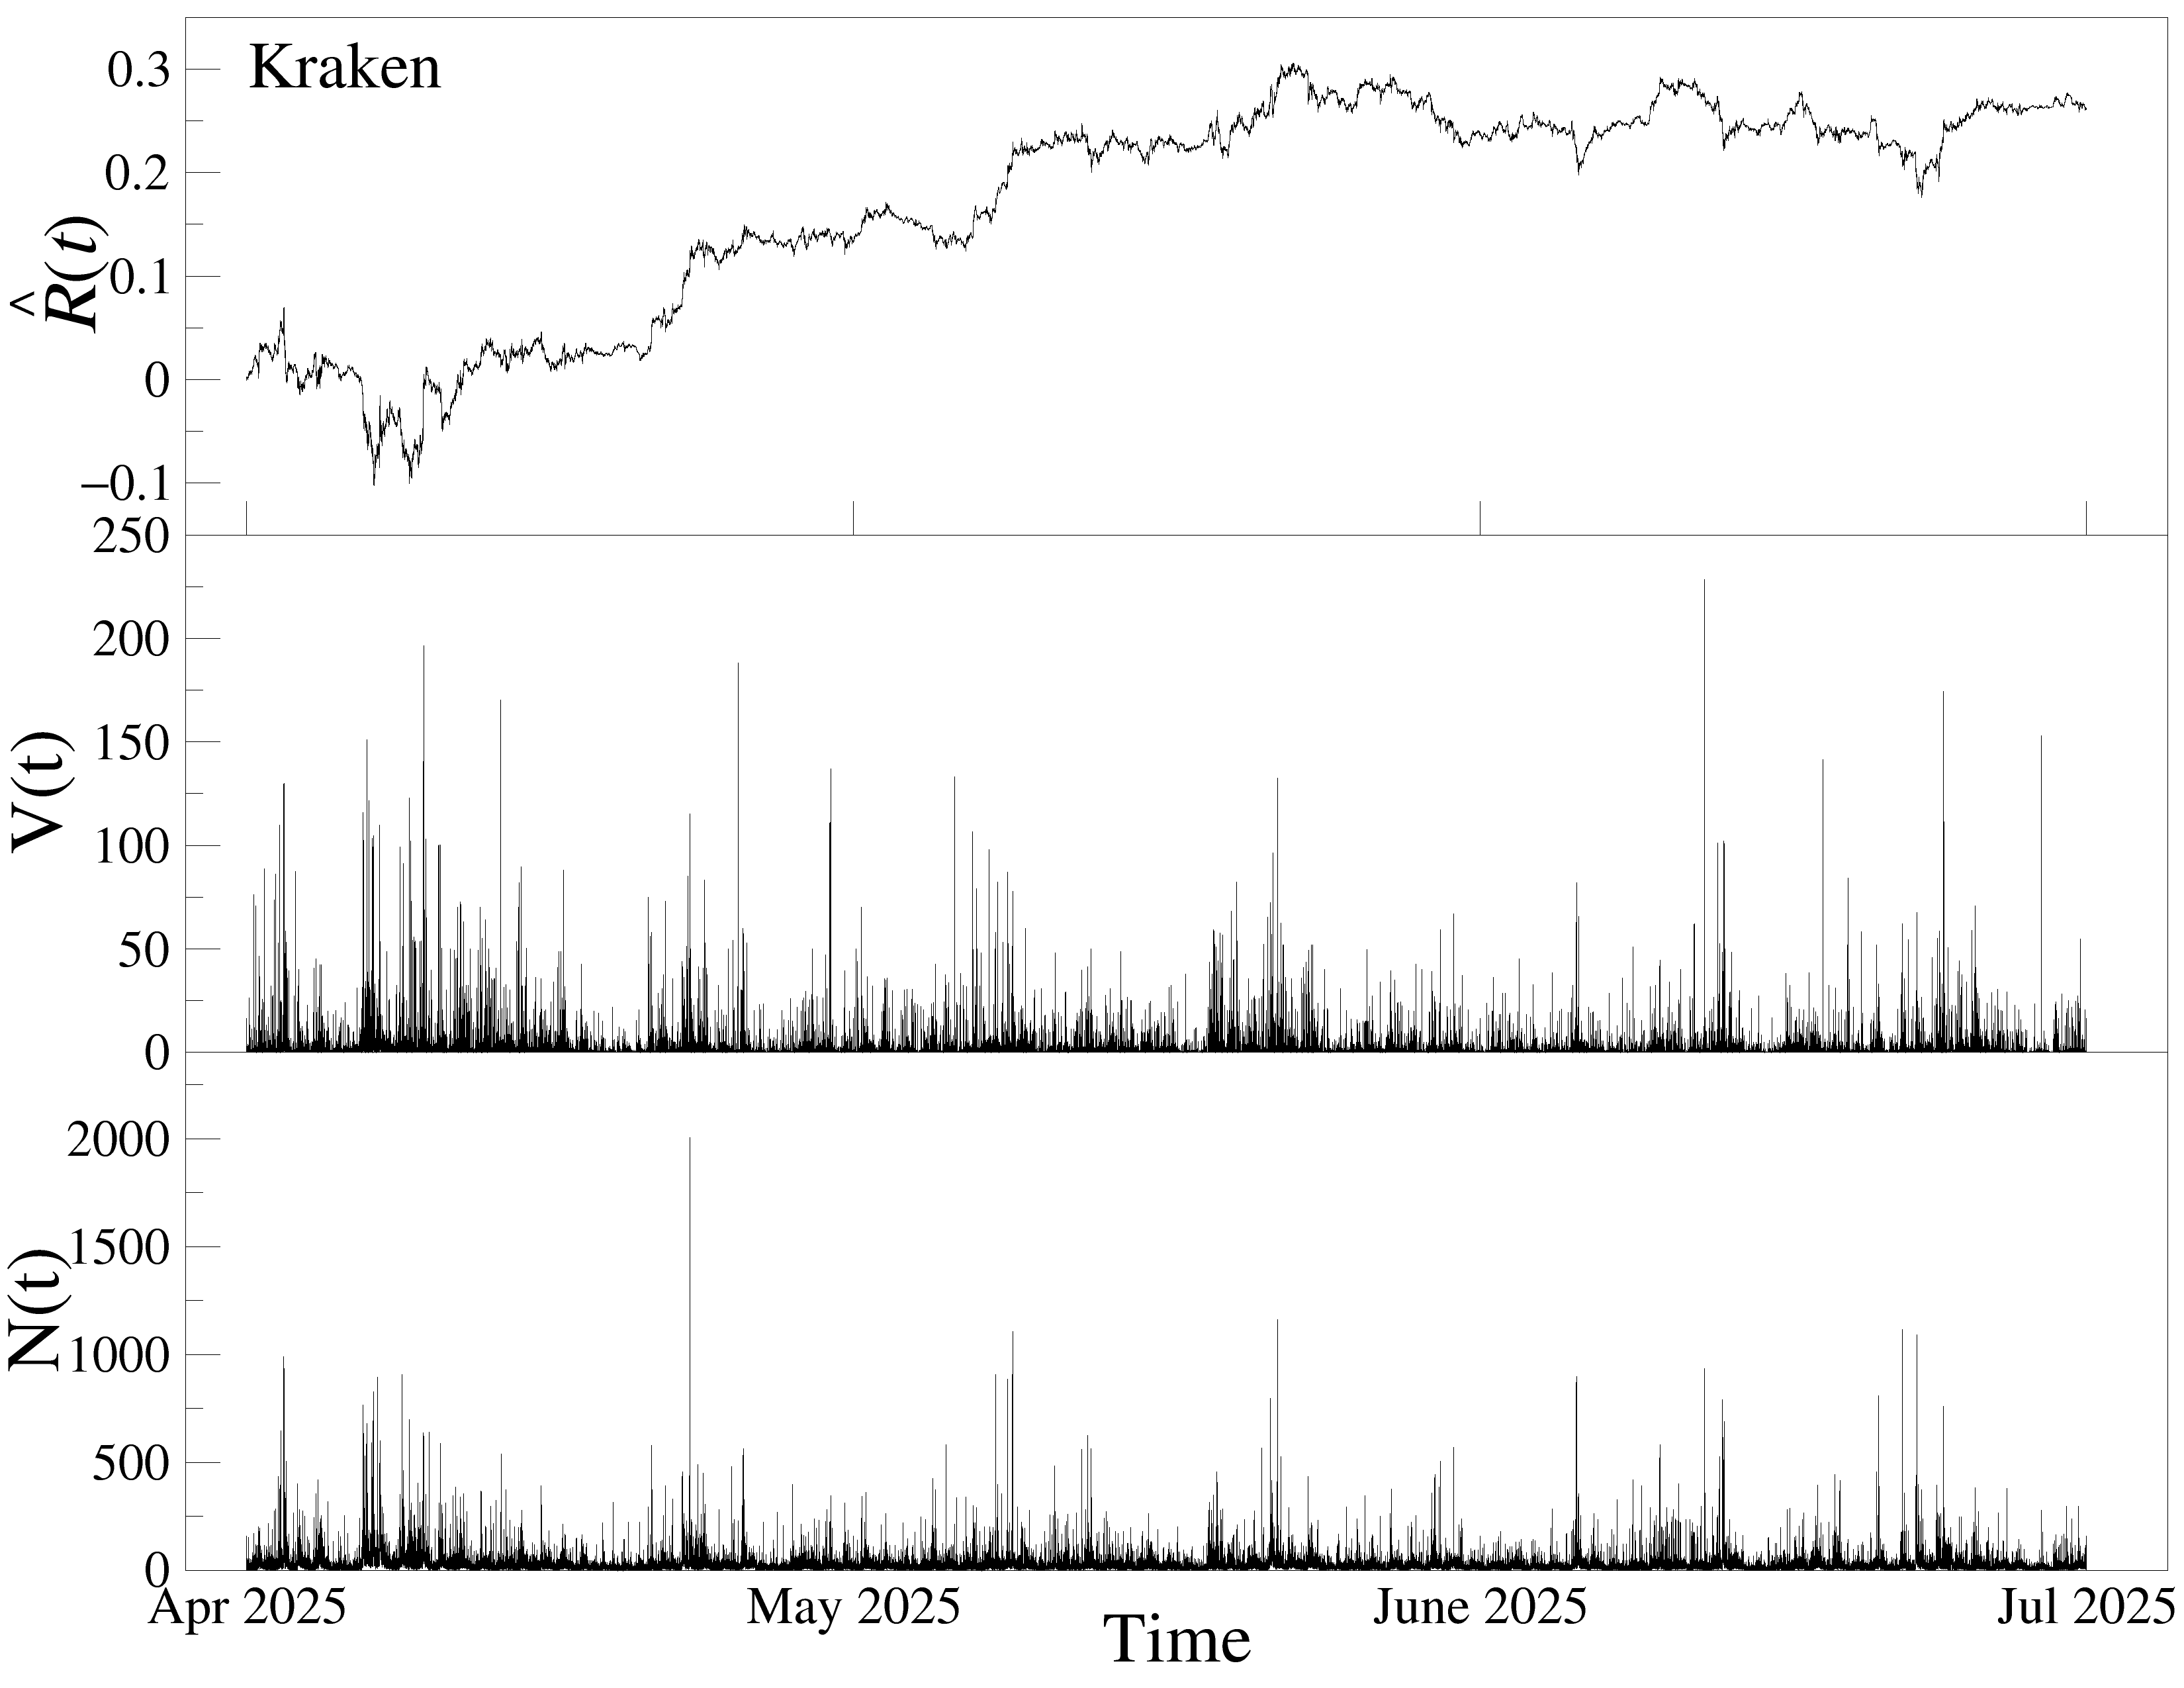
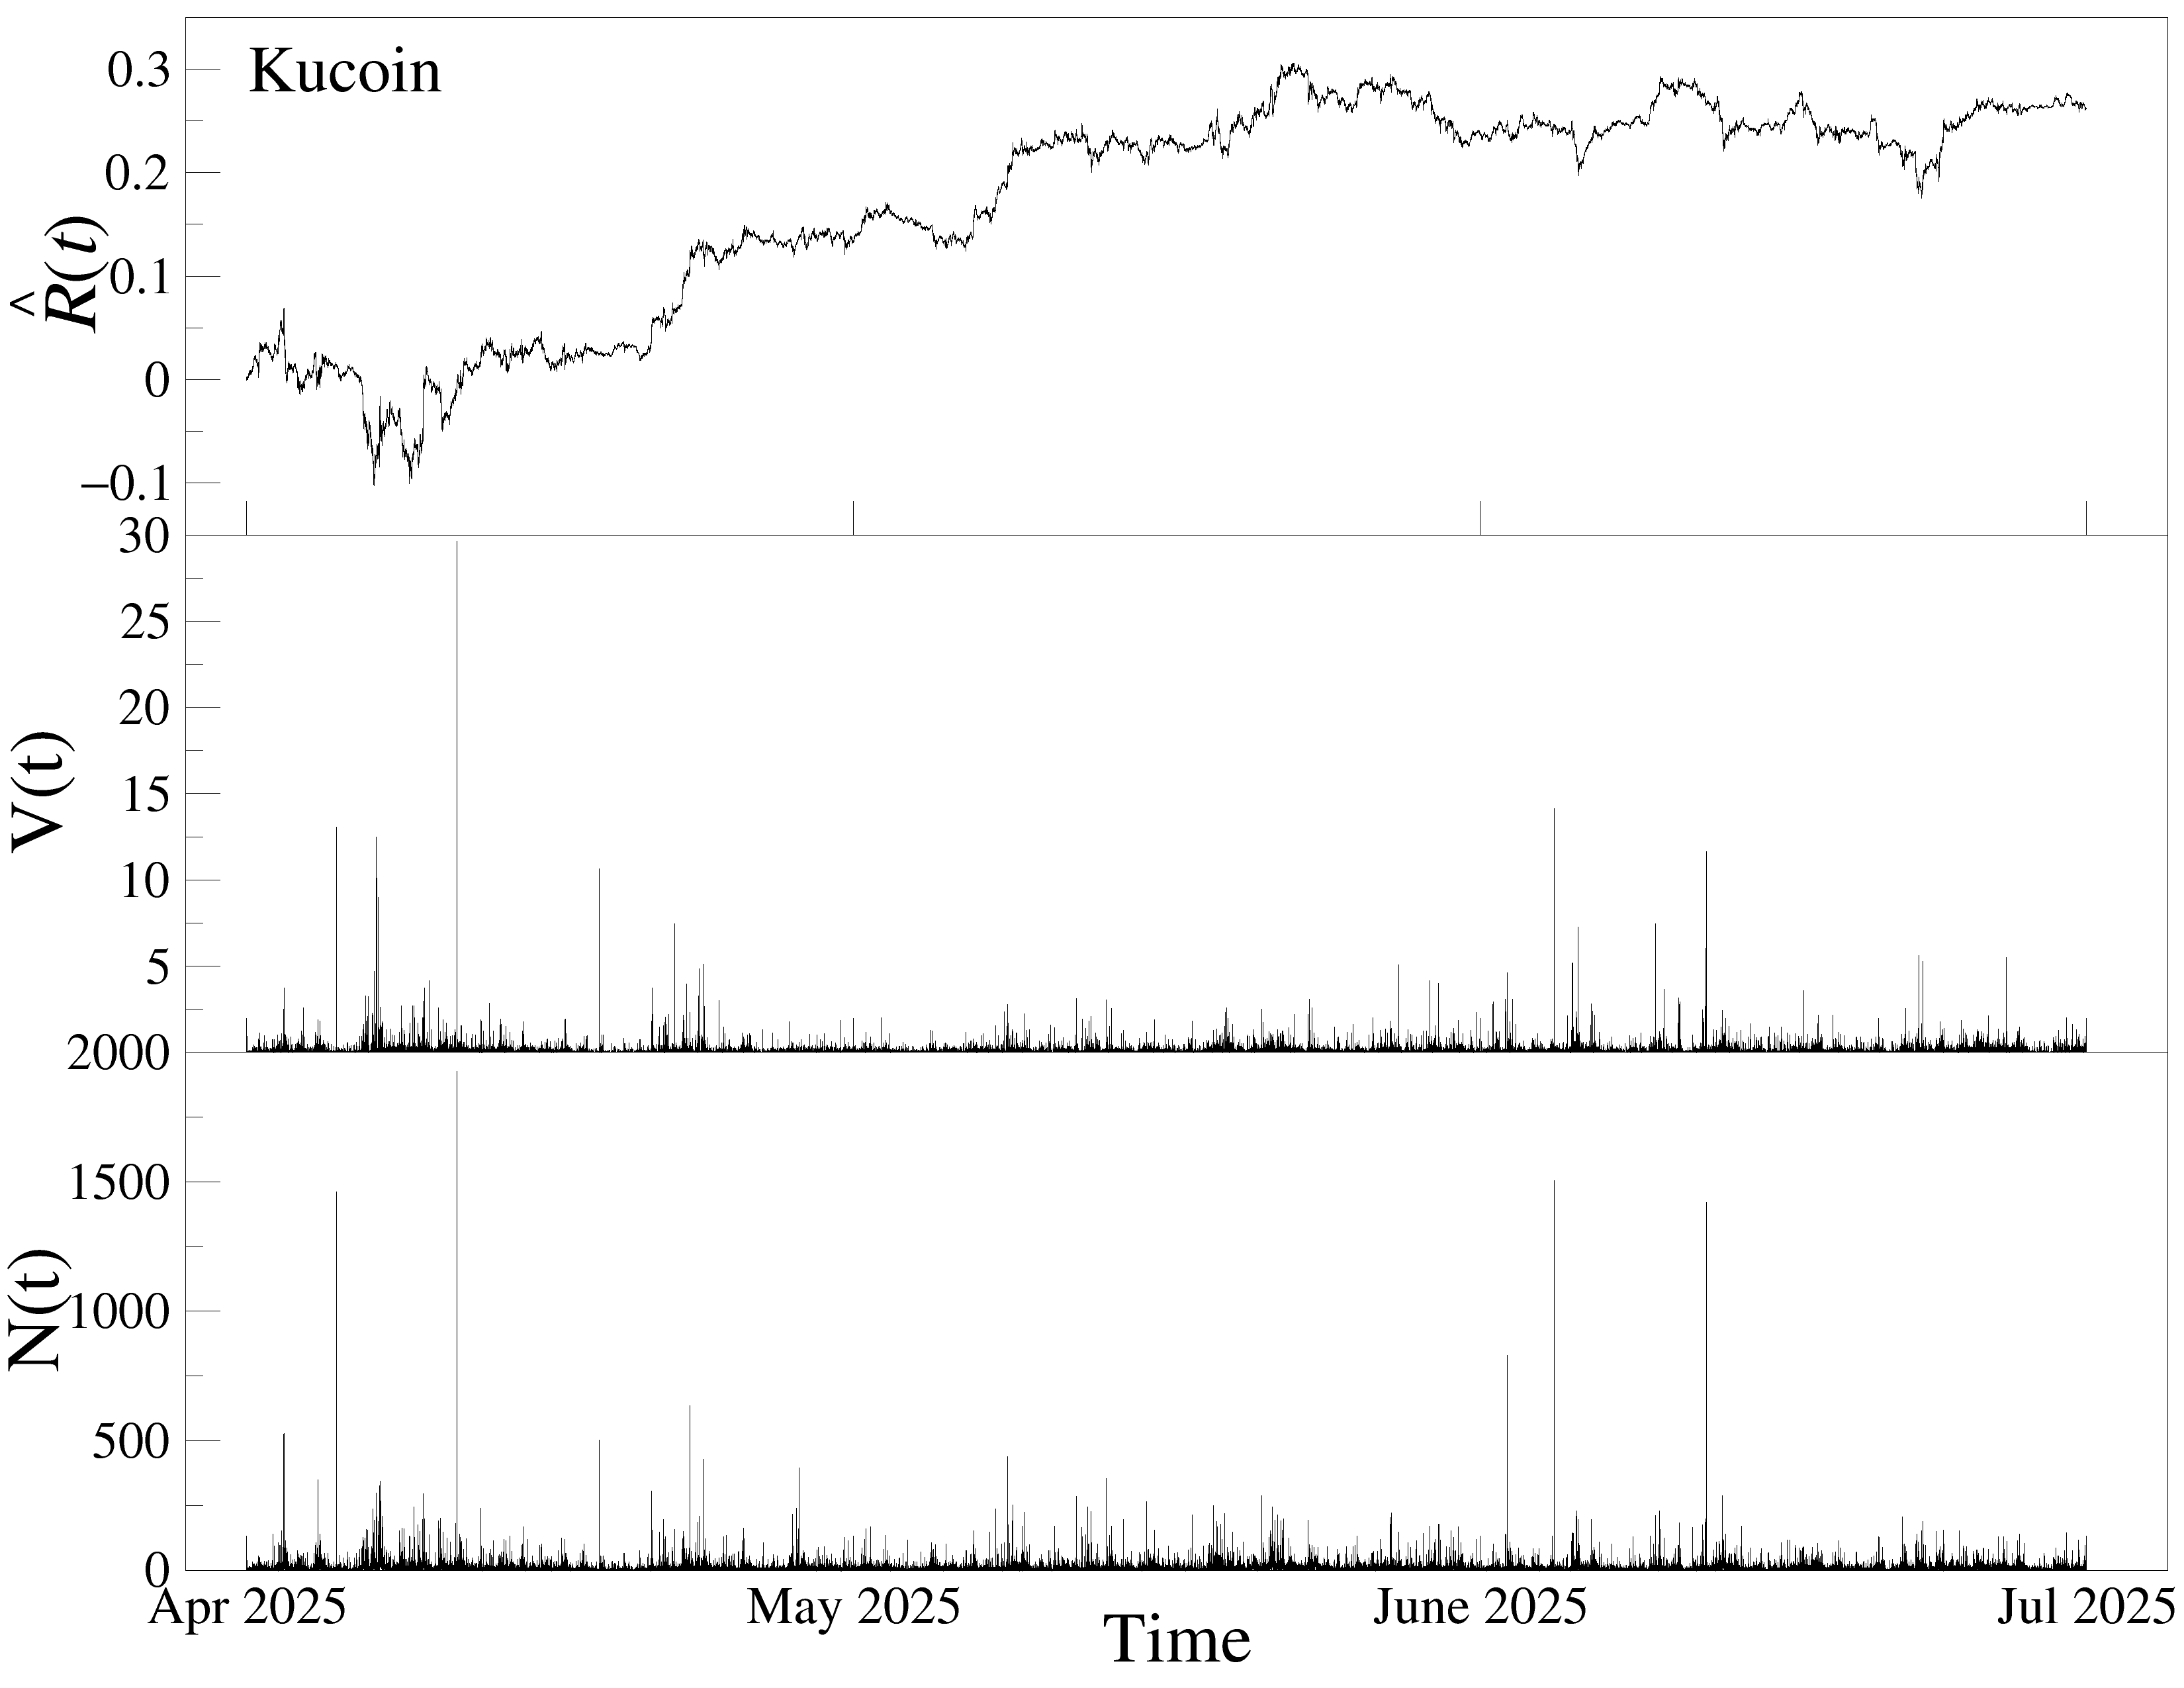
- Prices looked normal across exchanges
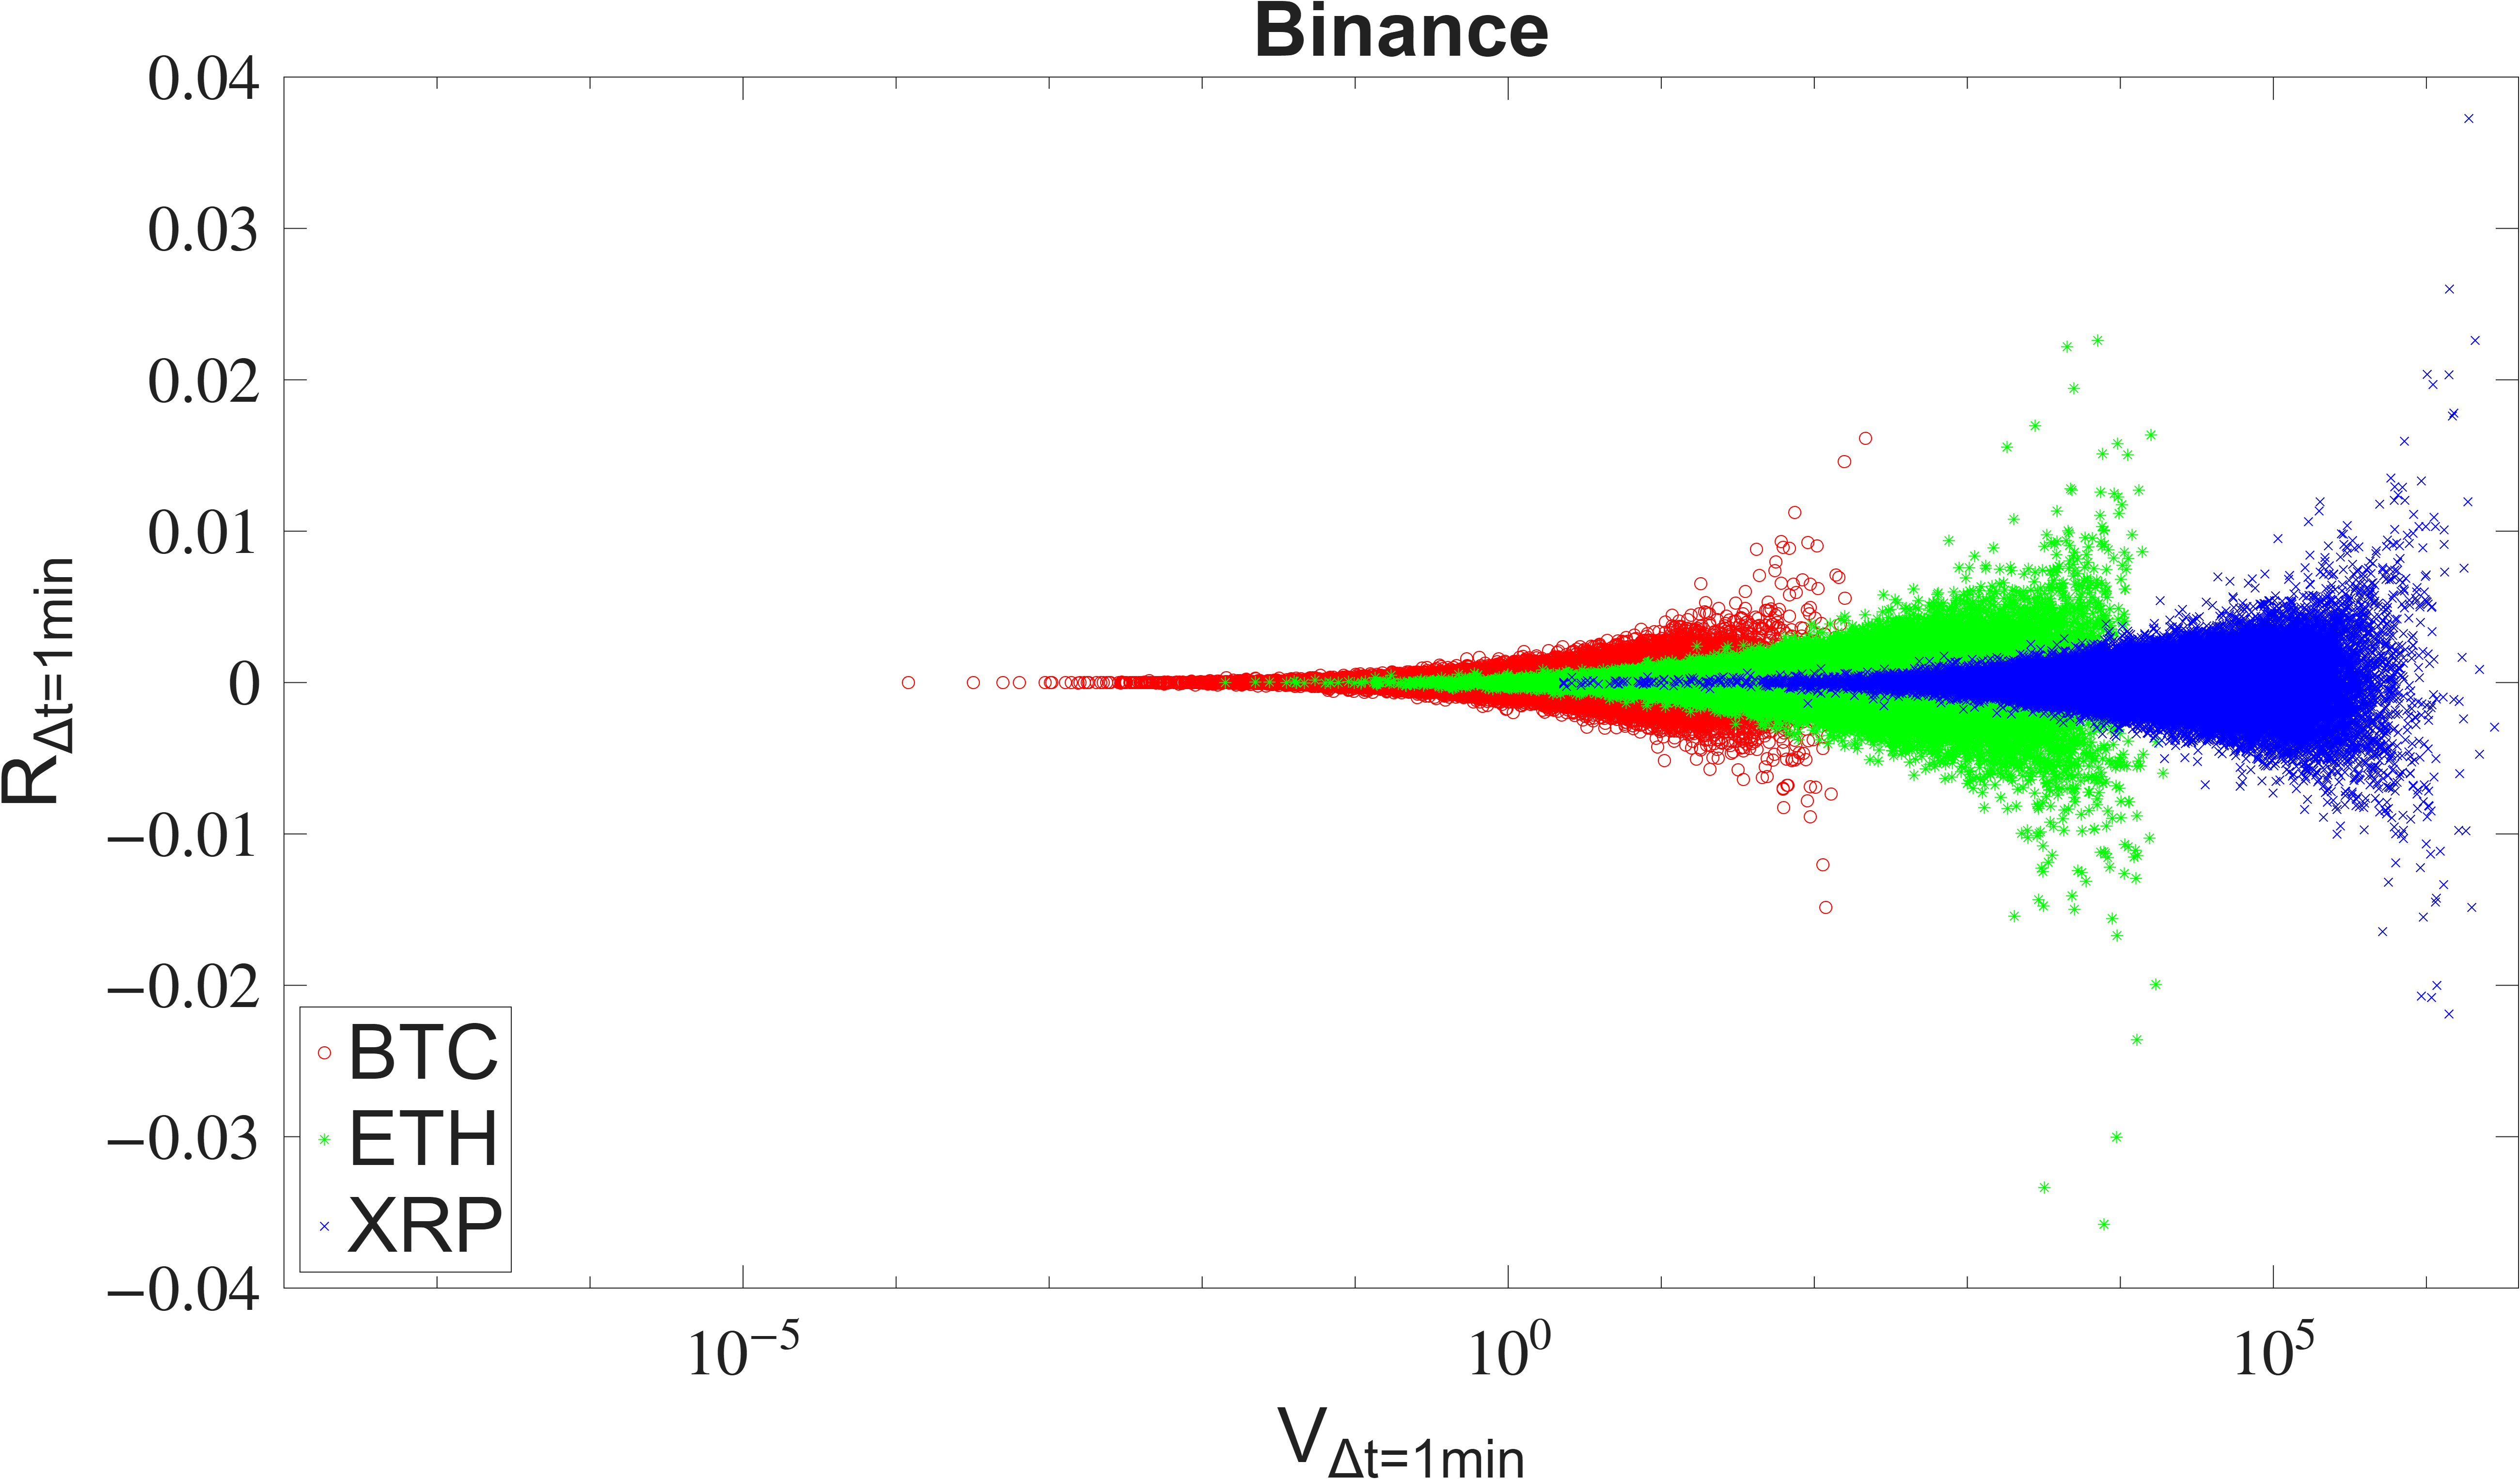
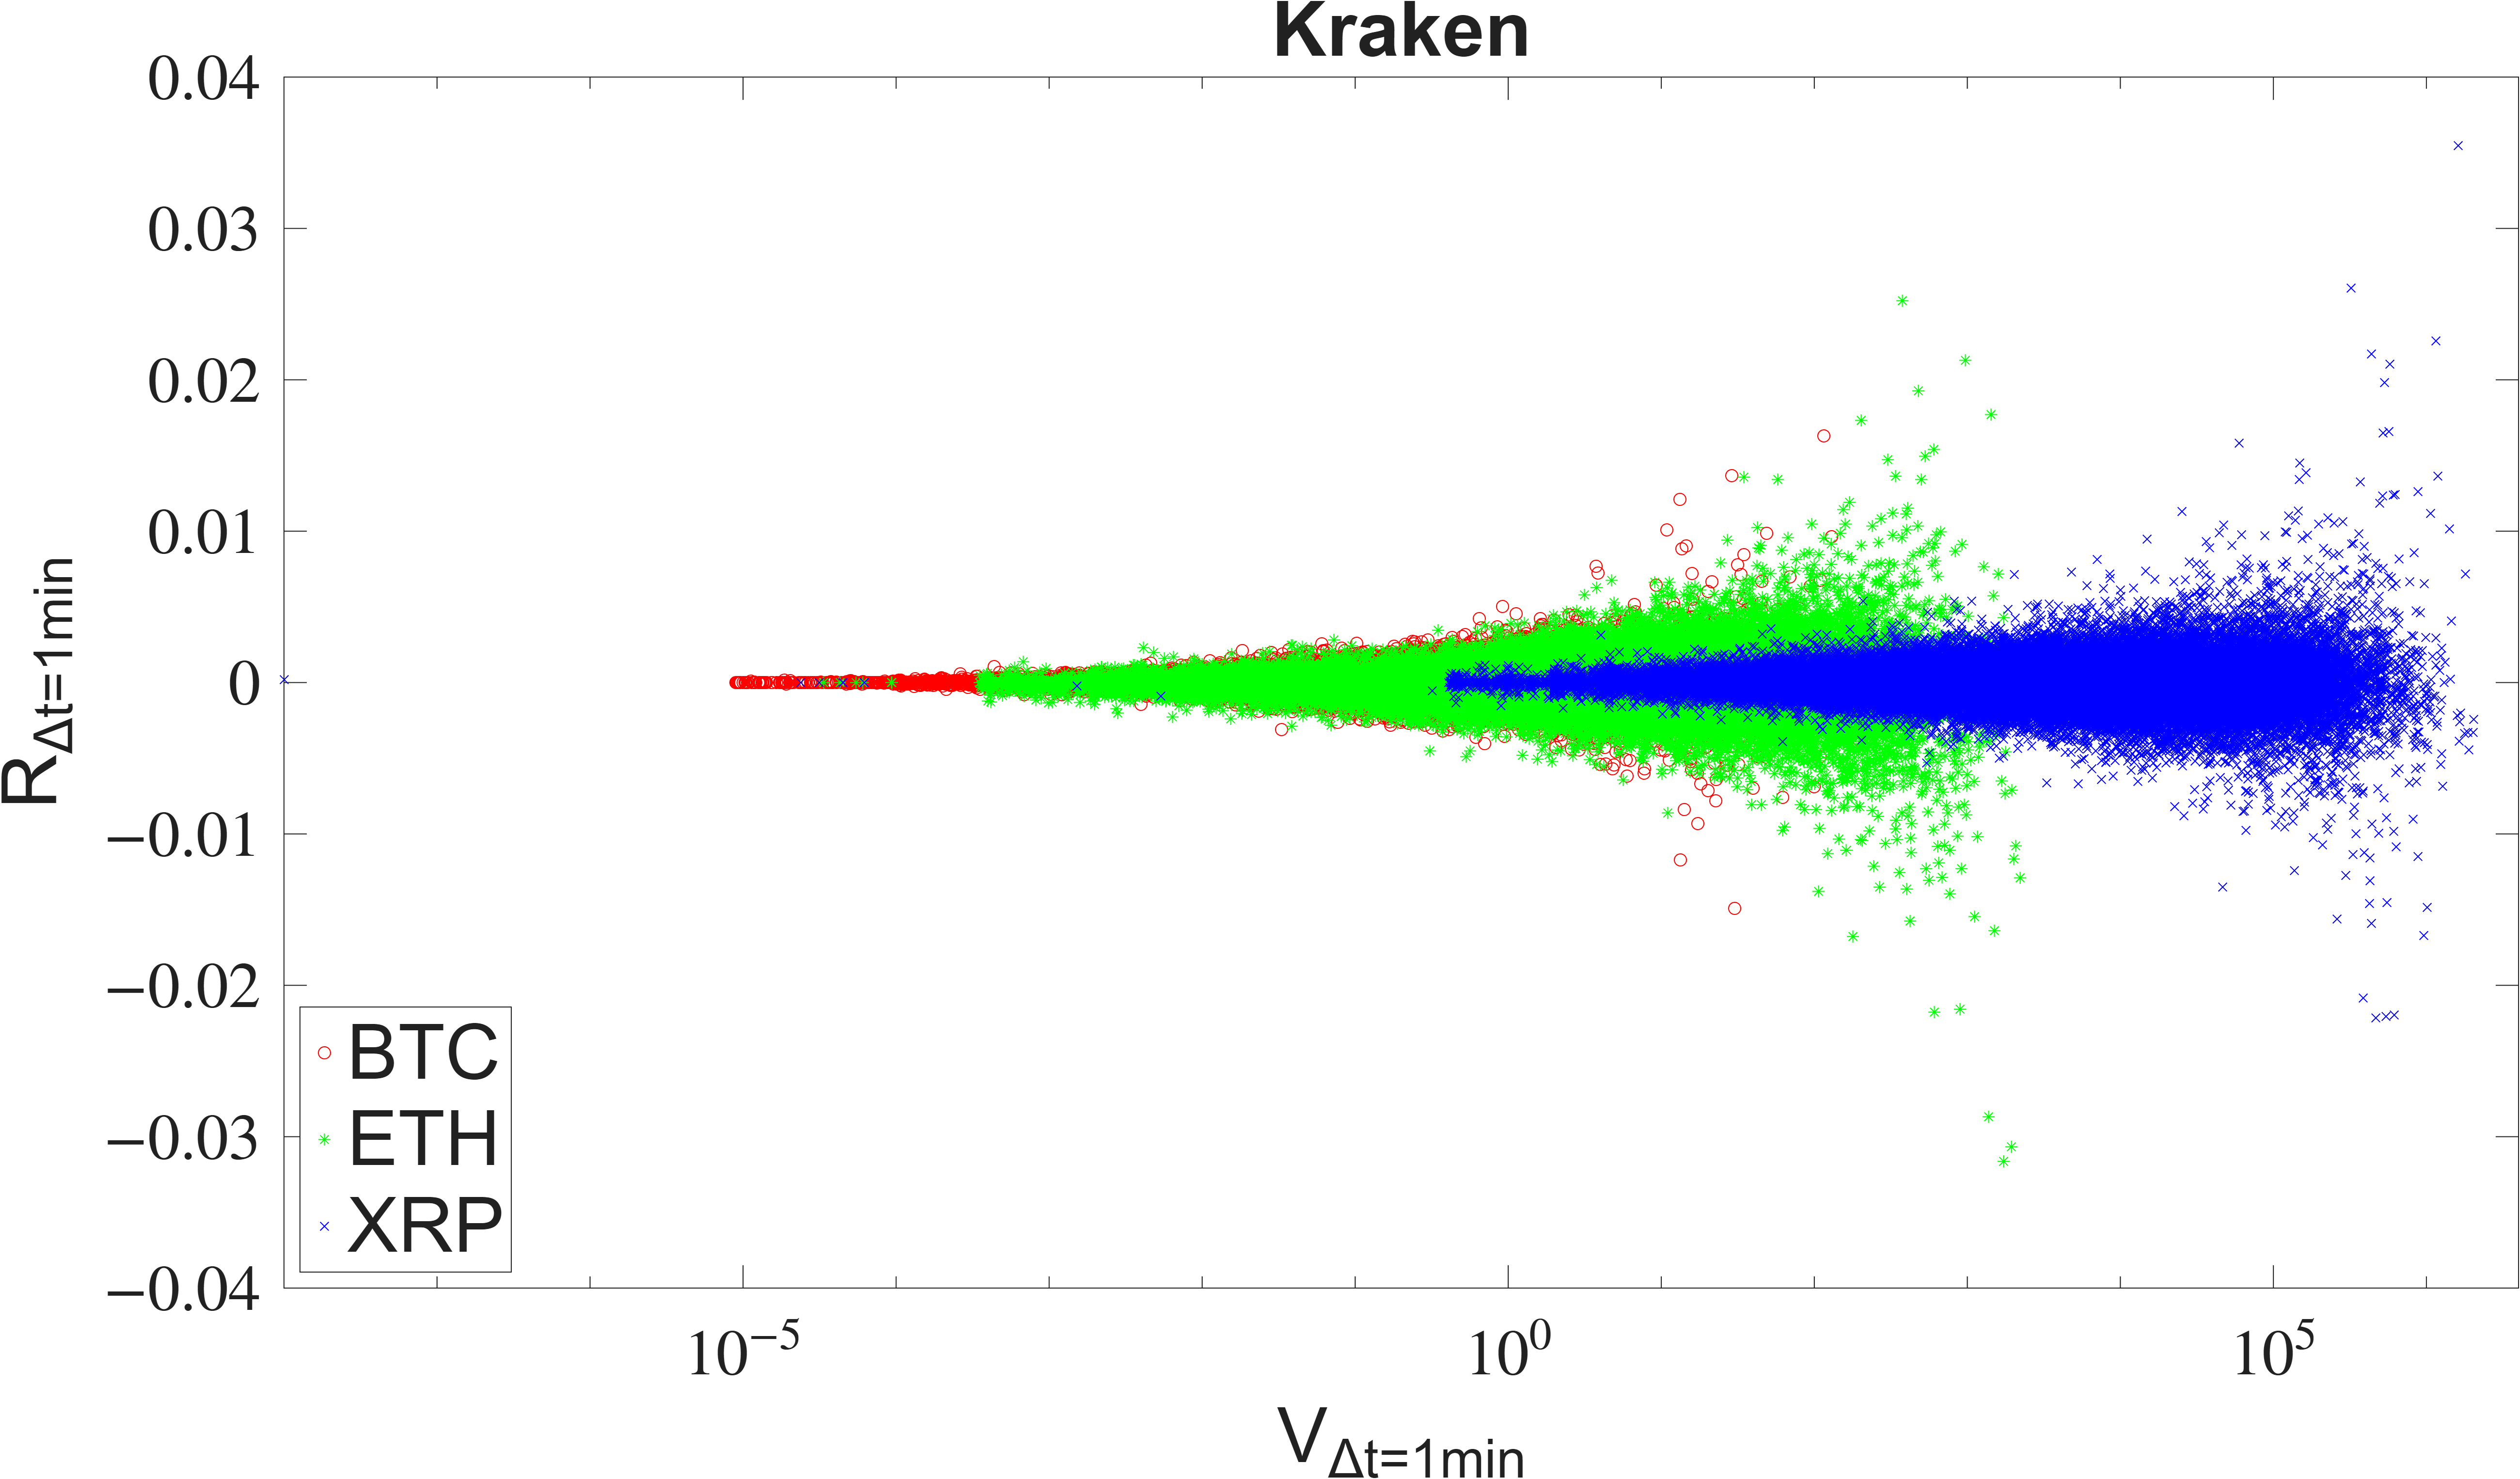
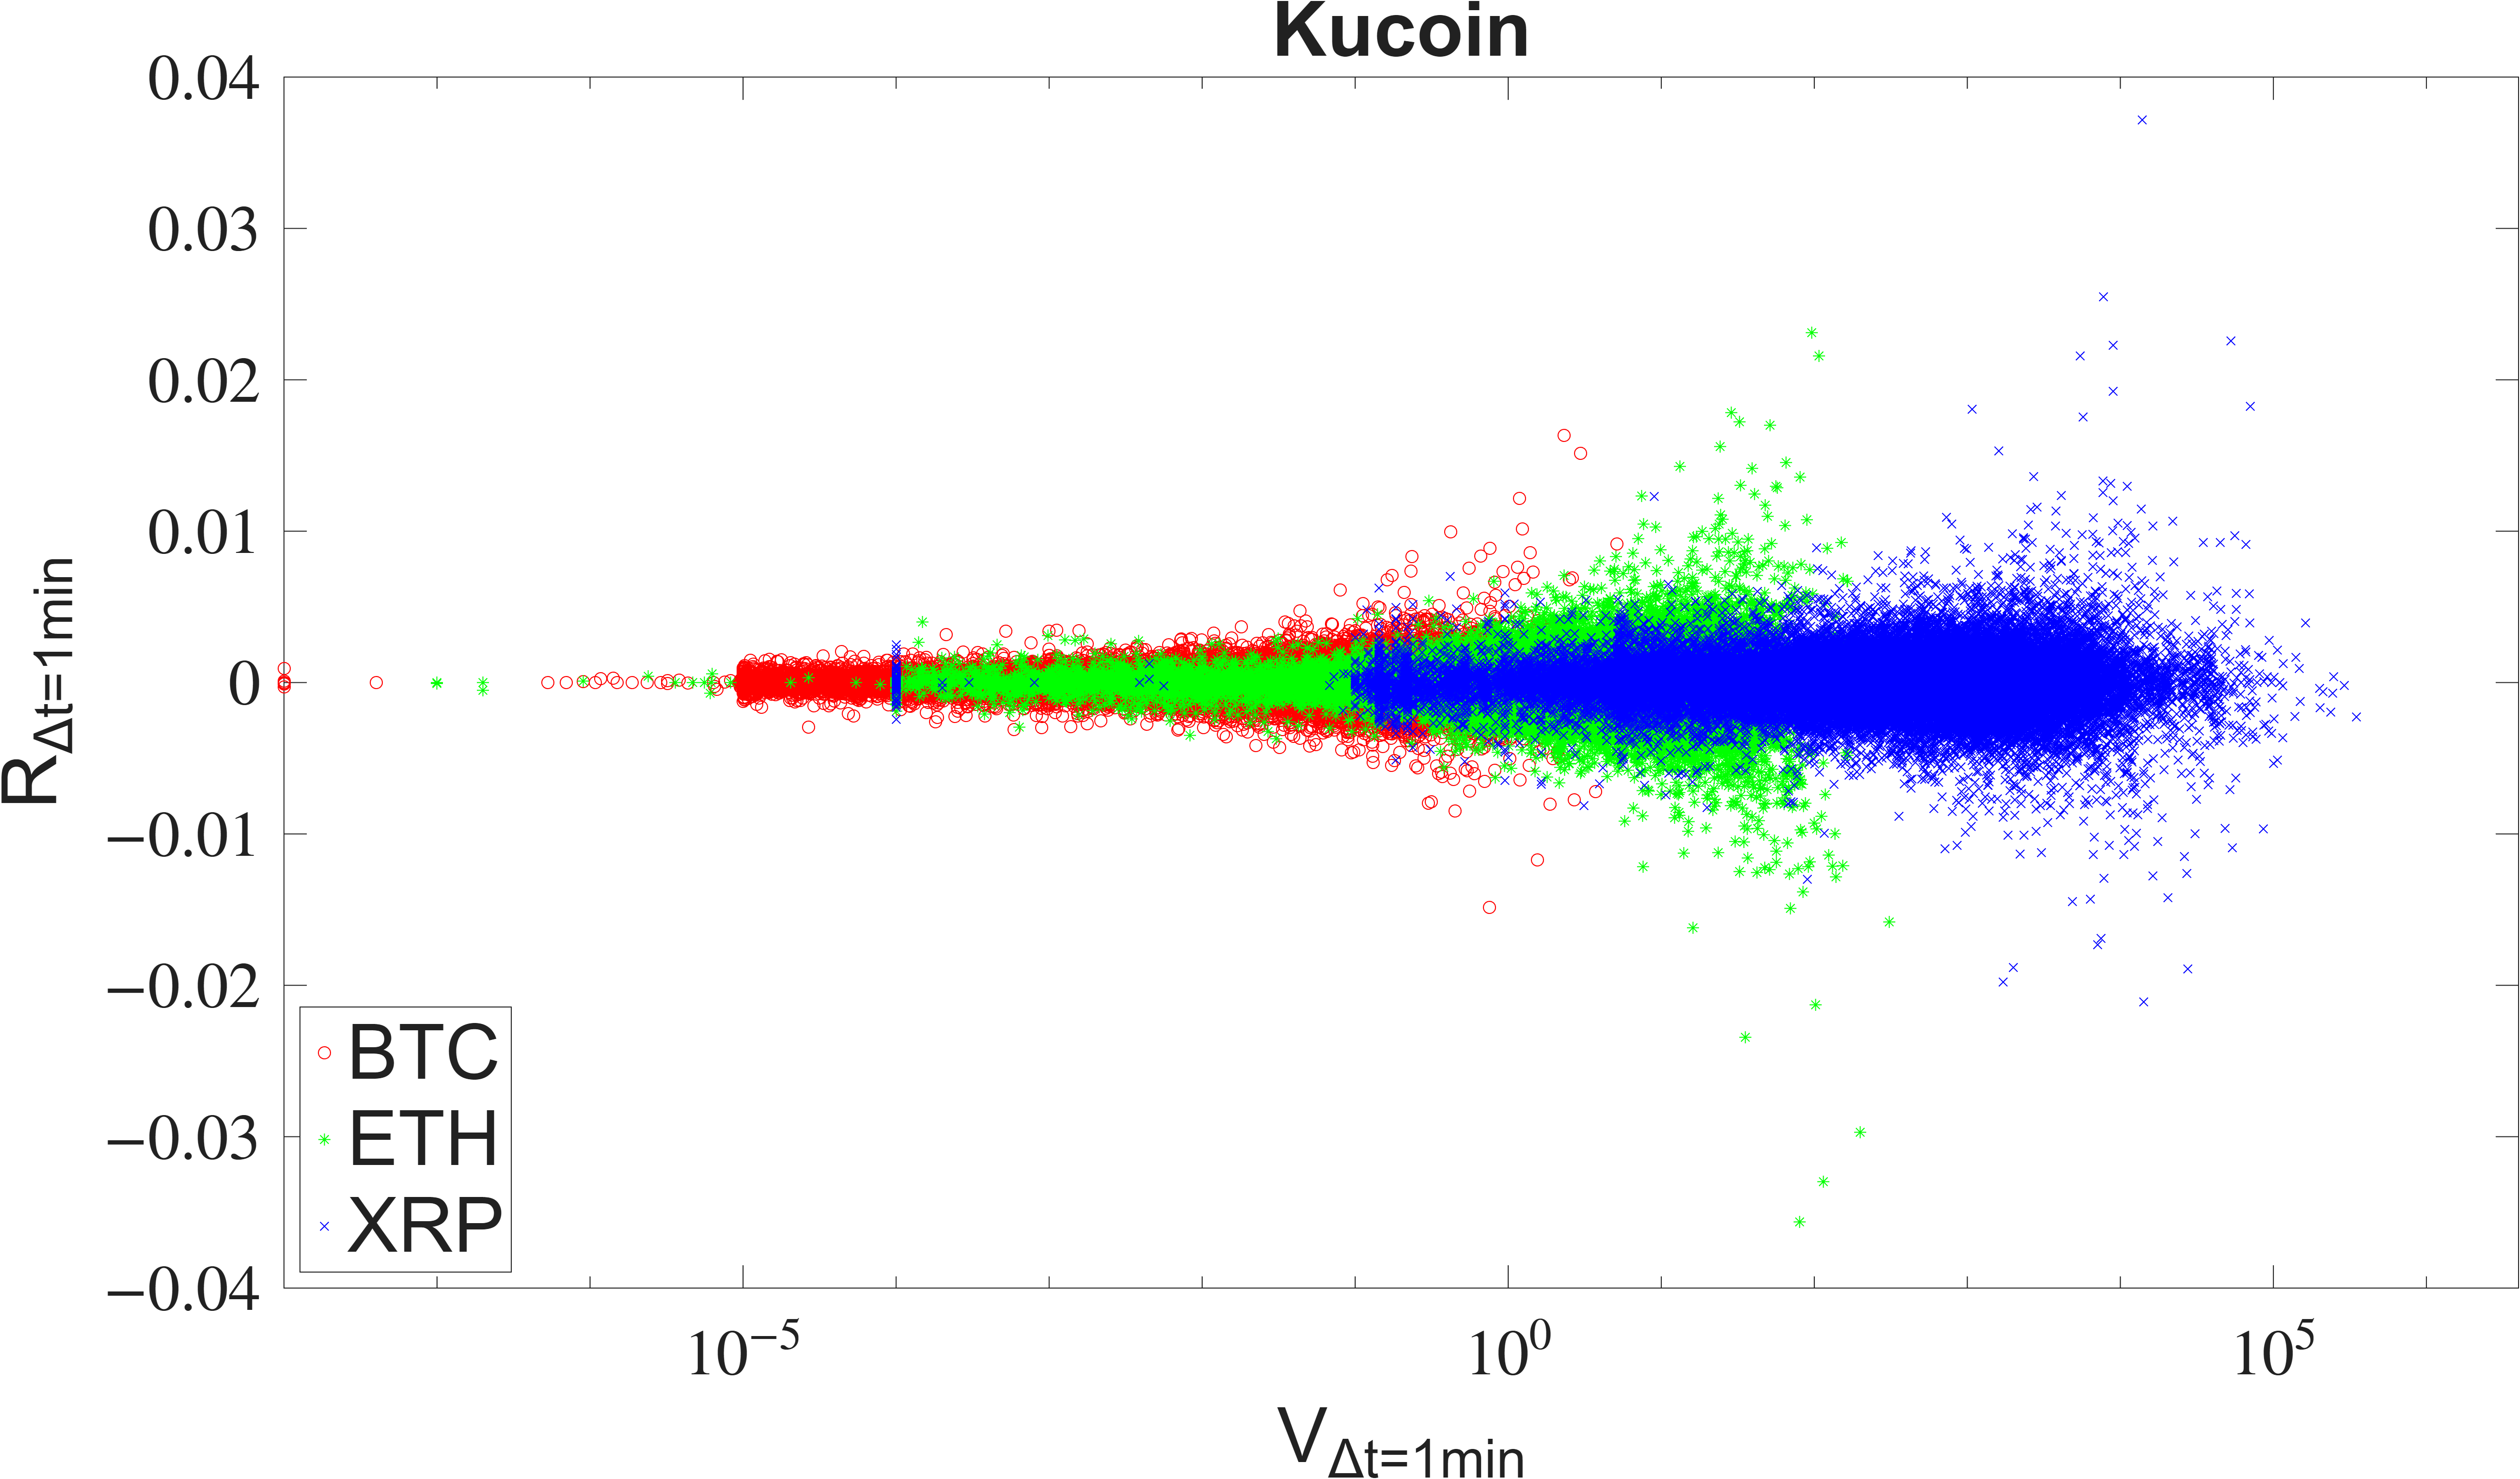
- For each coin, the 1-minute price-change patterns were surprisingly similar across all exchanges. This likely happens because traders arbitrage away big price gaps fast.
- Volume and number of trades showed differences by exchange
- Volumes varied, which is normal—exchanges have different client bases and liquidity.
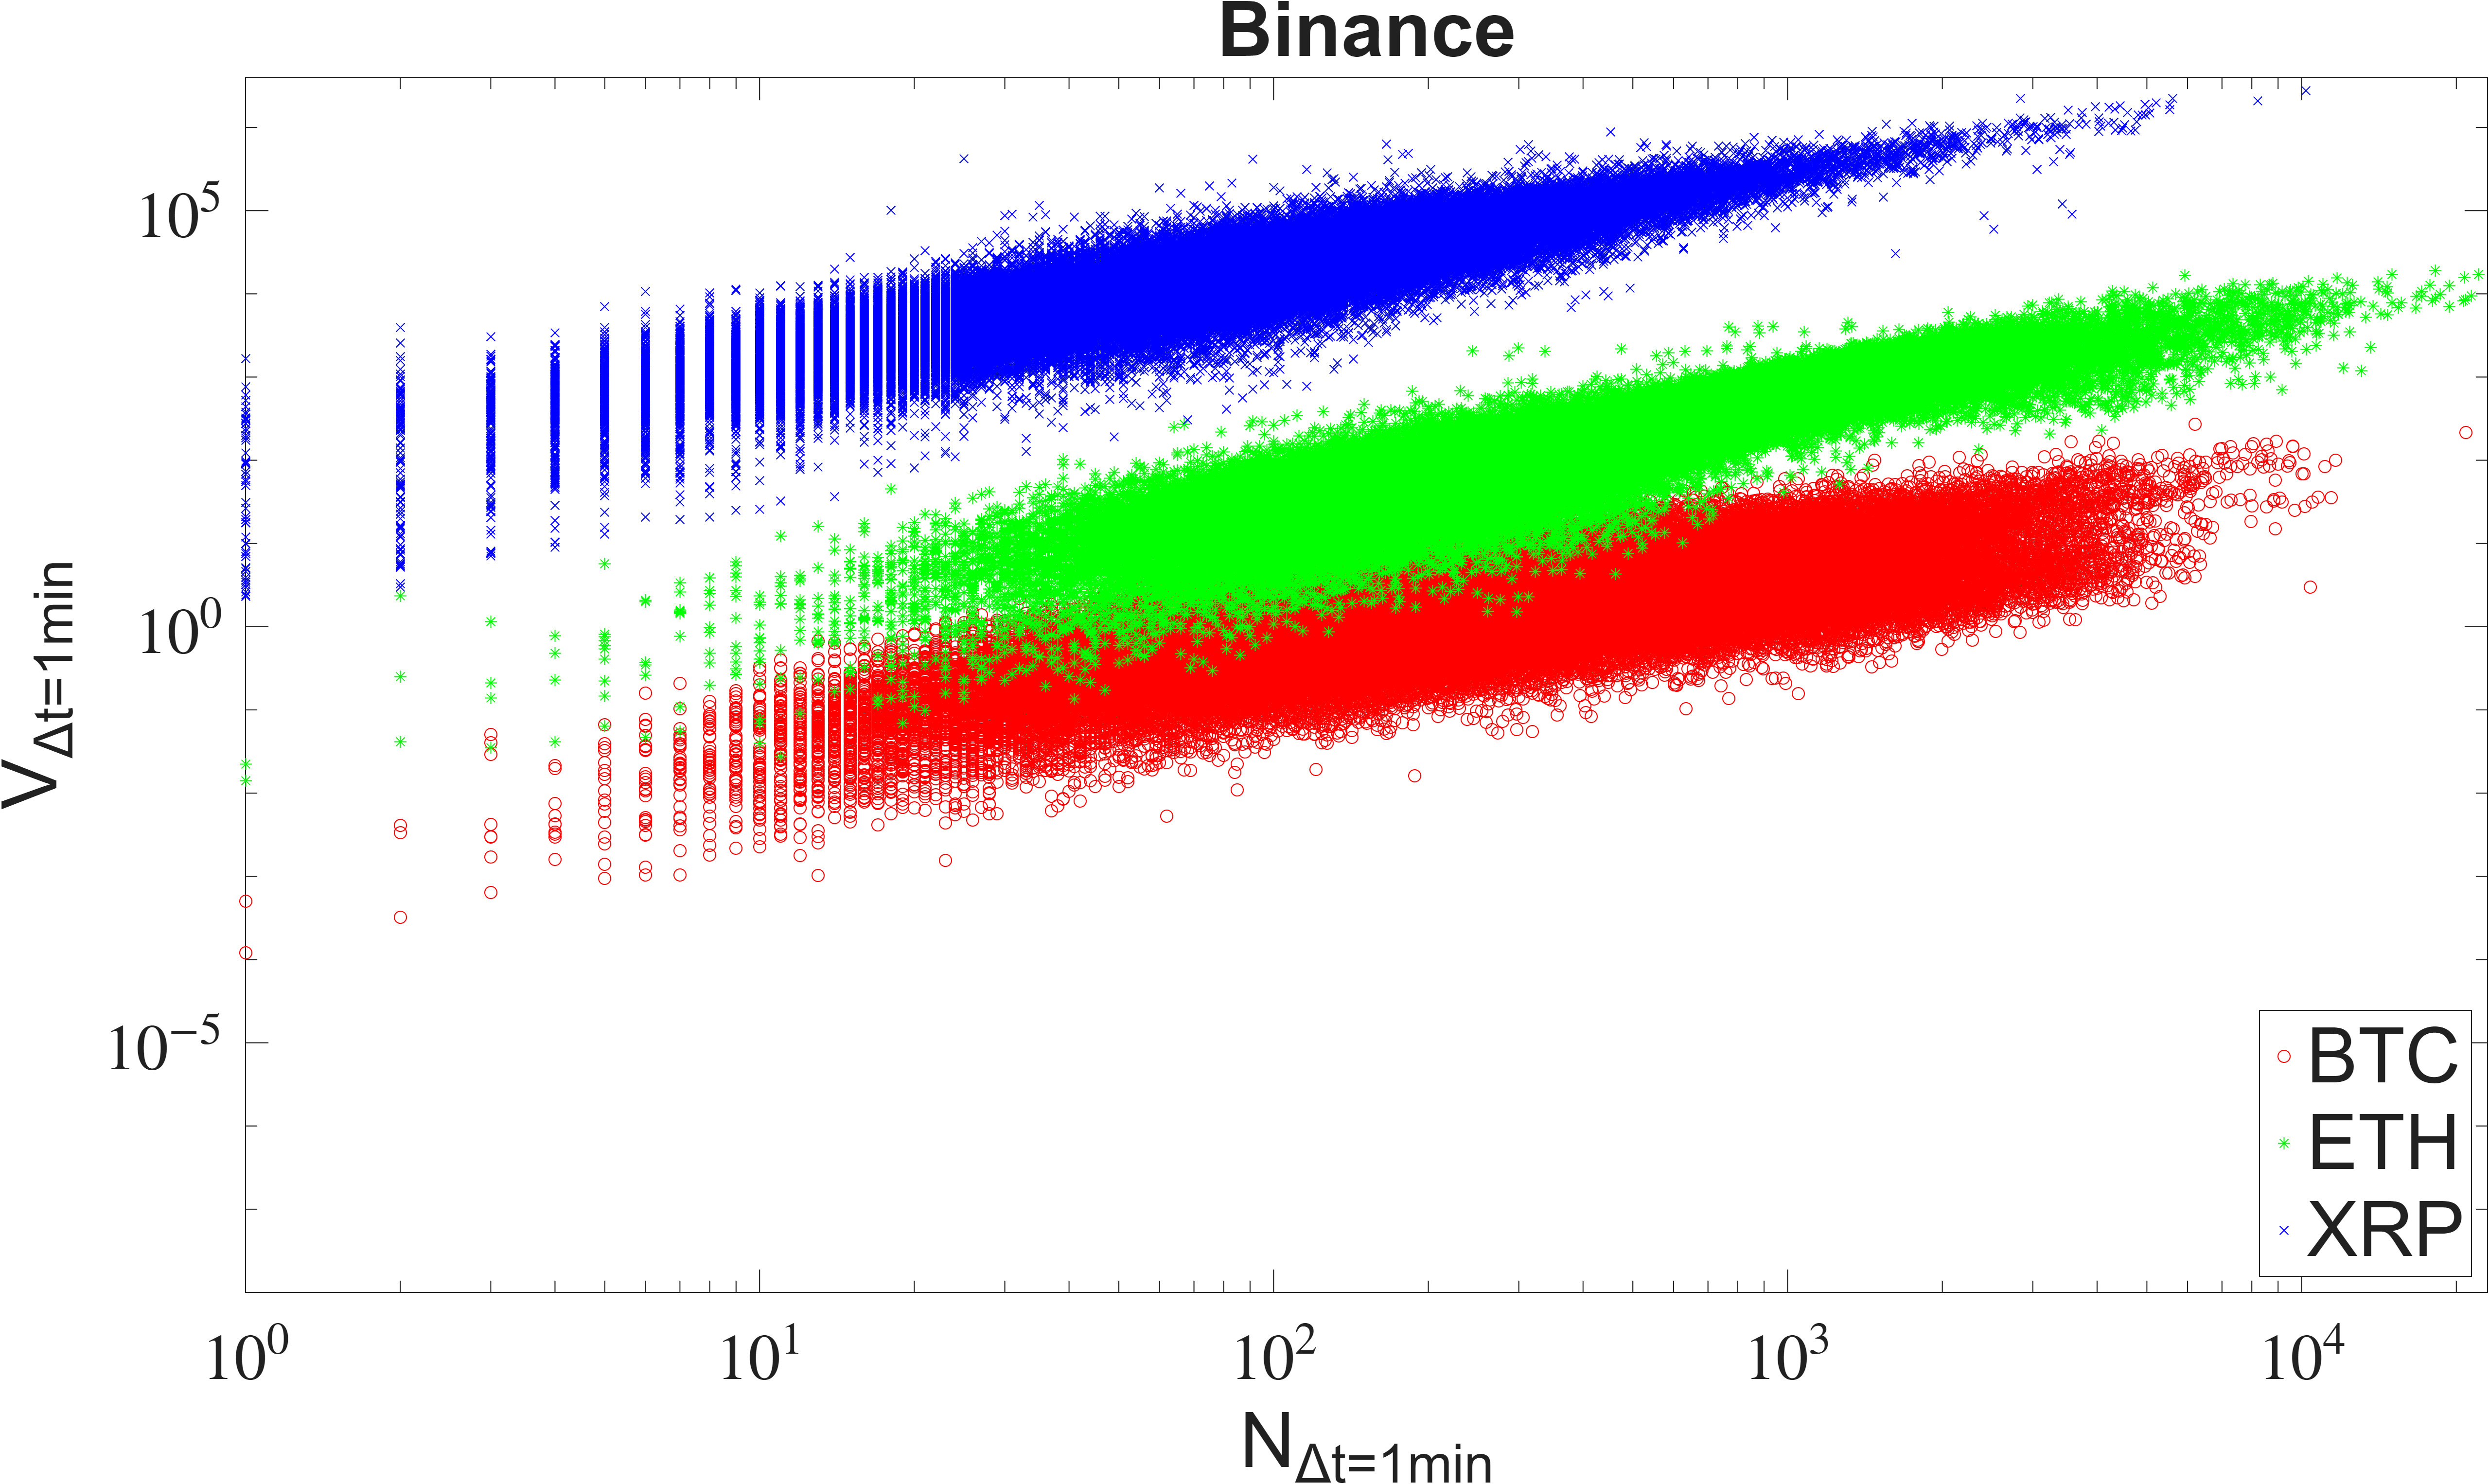
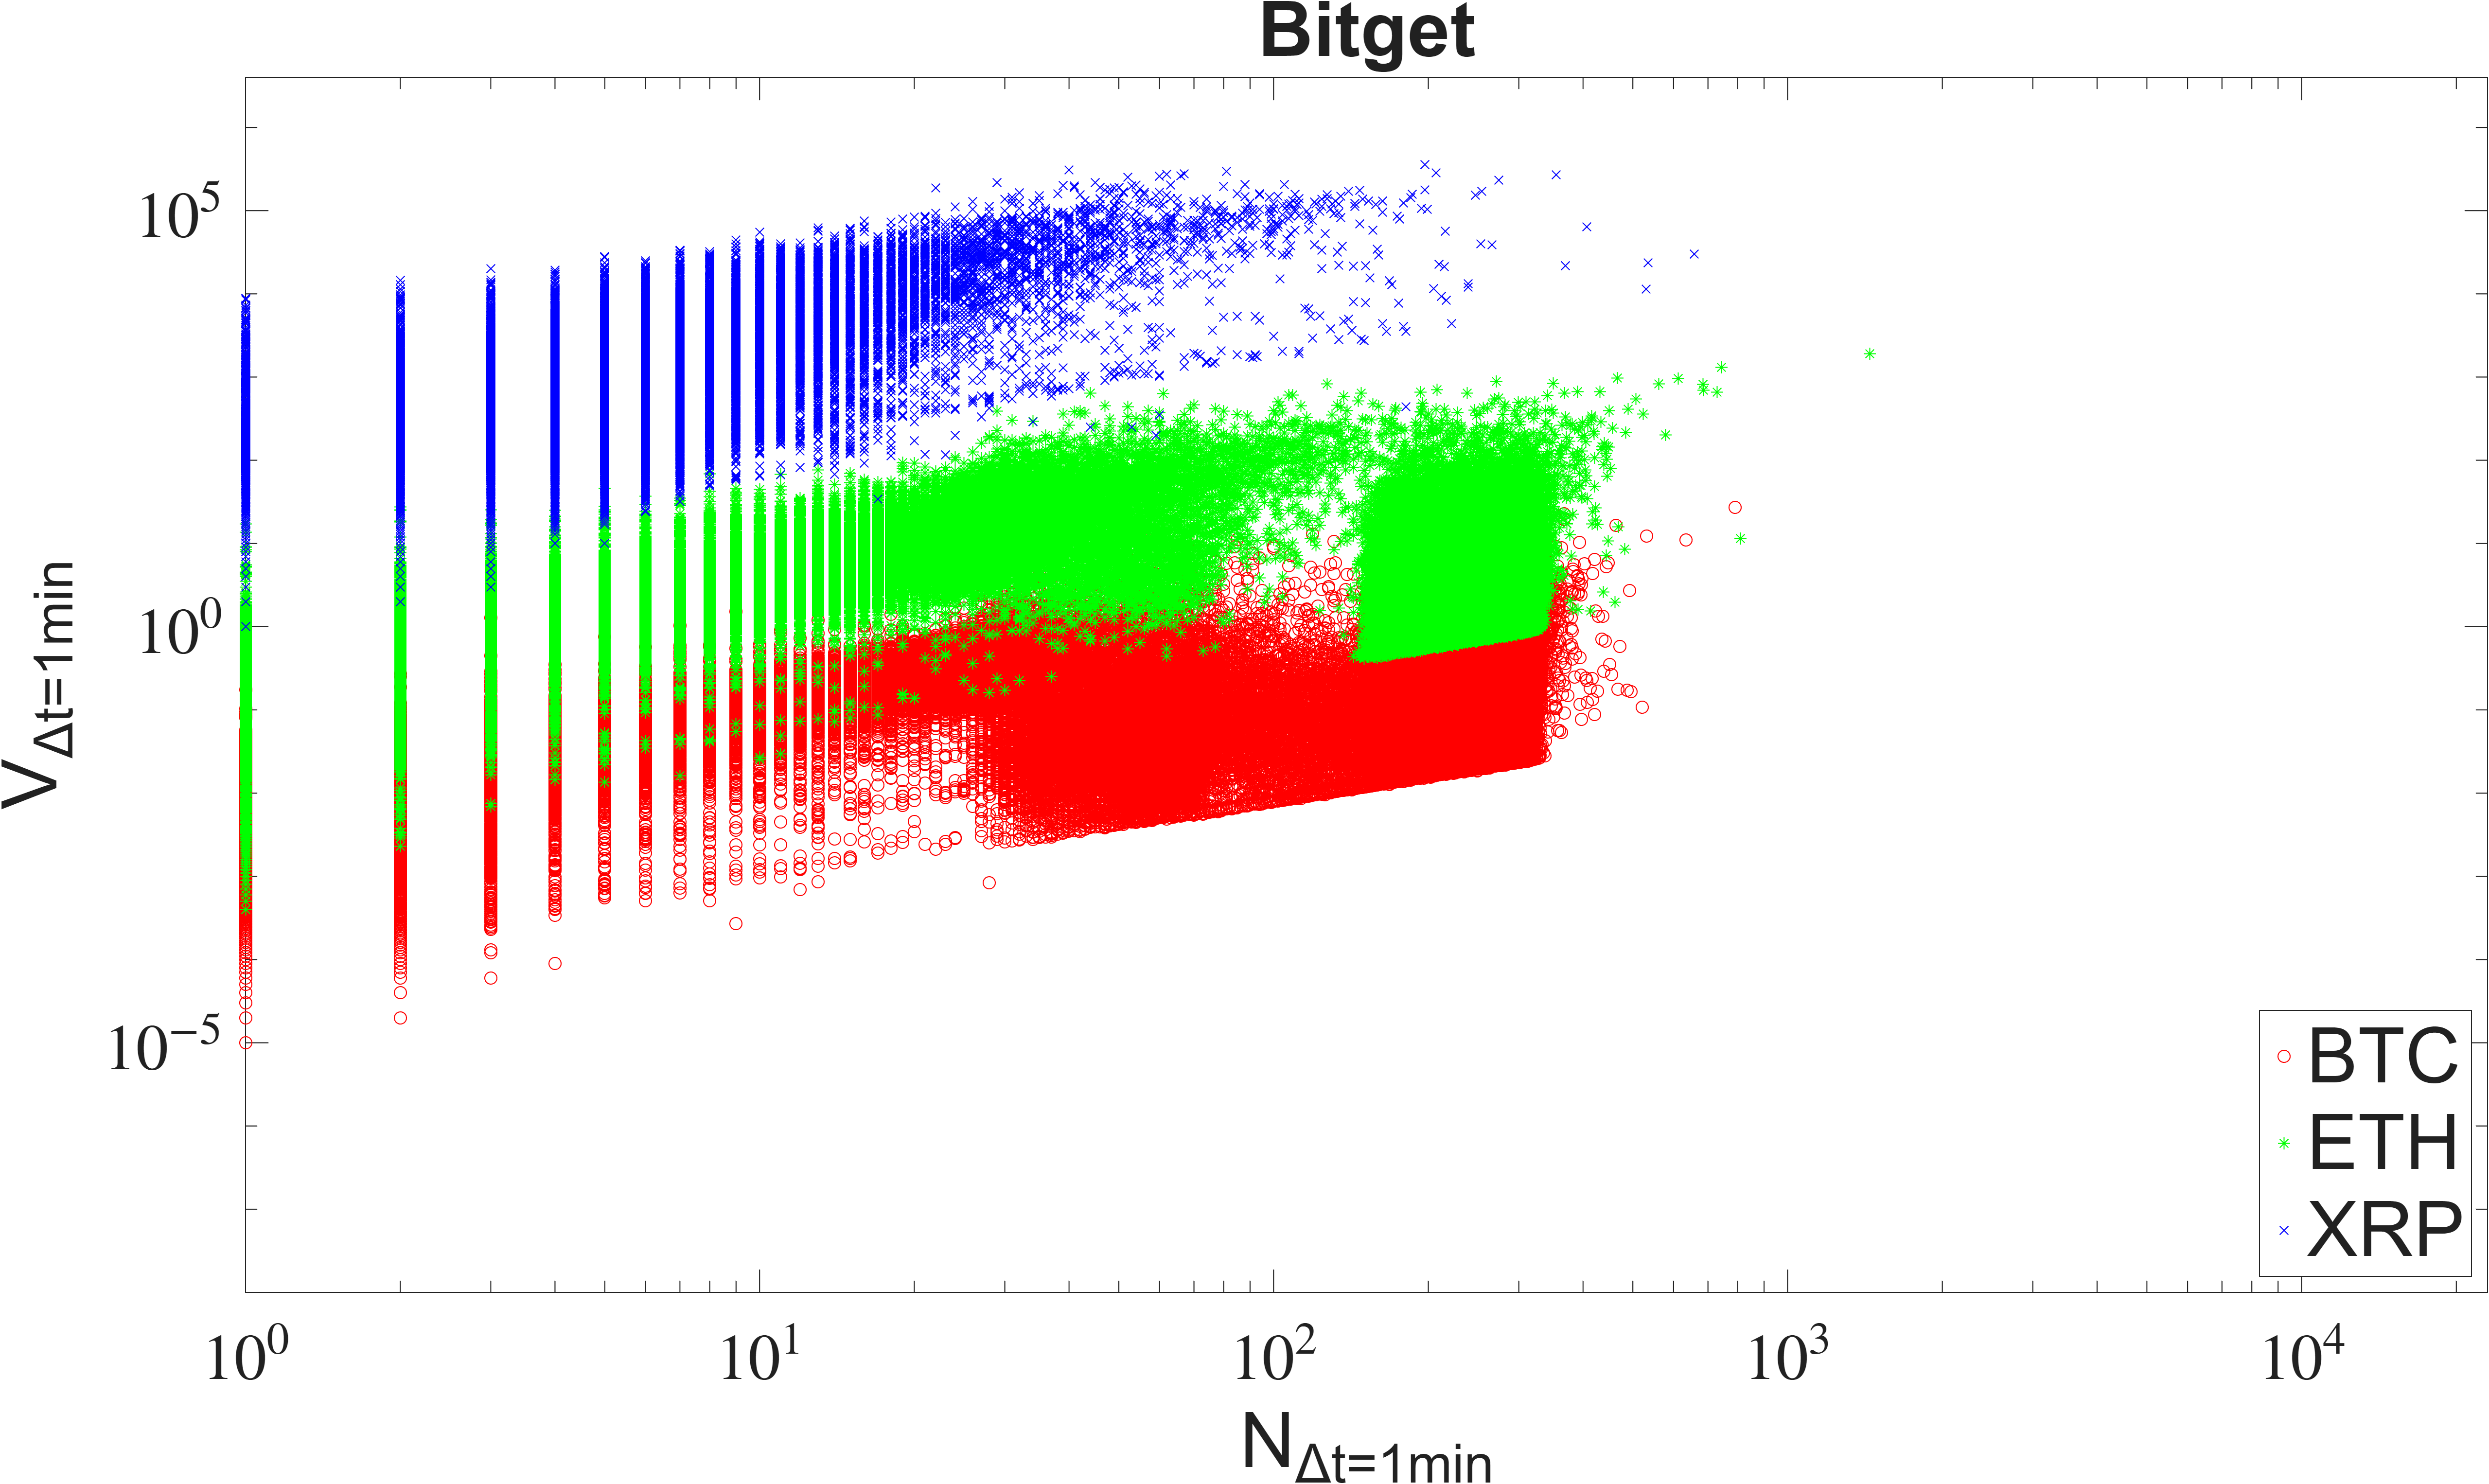
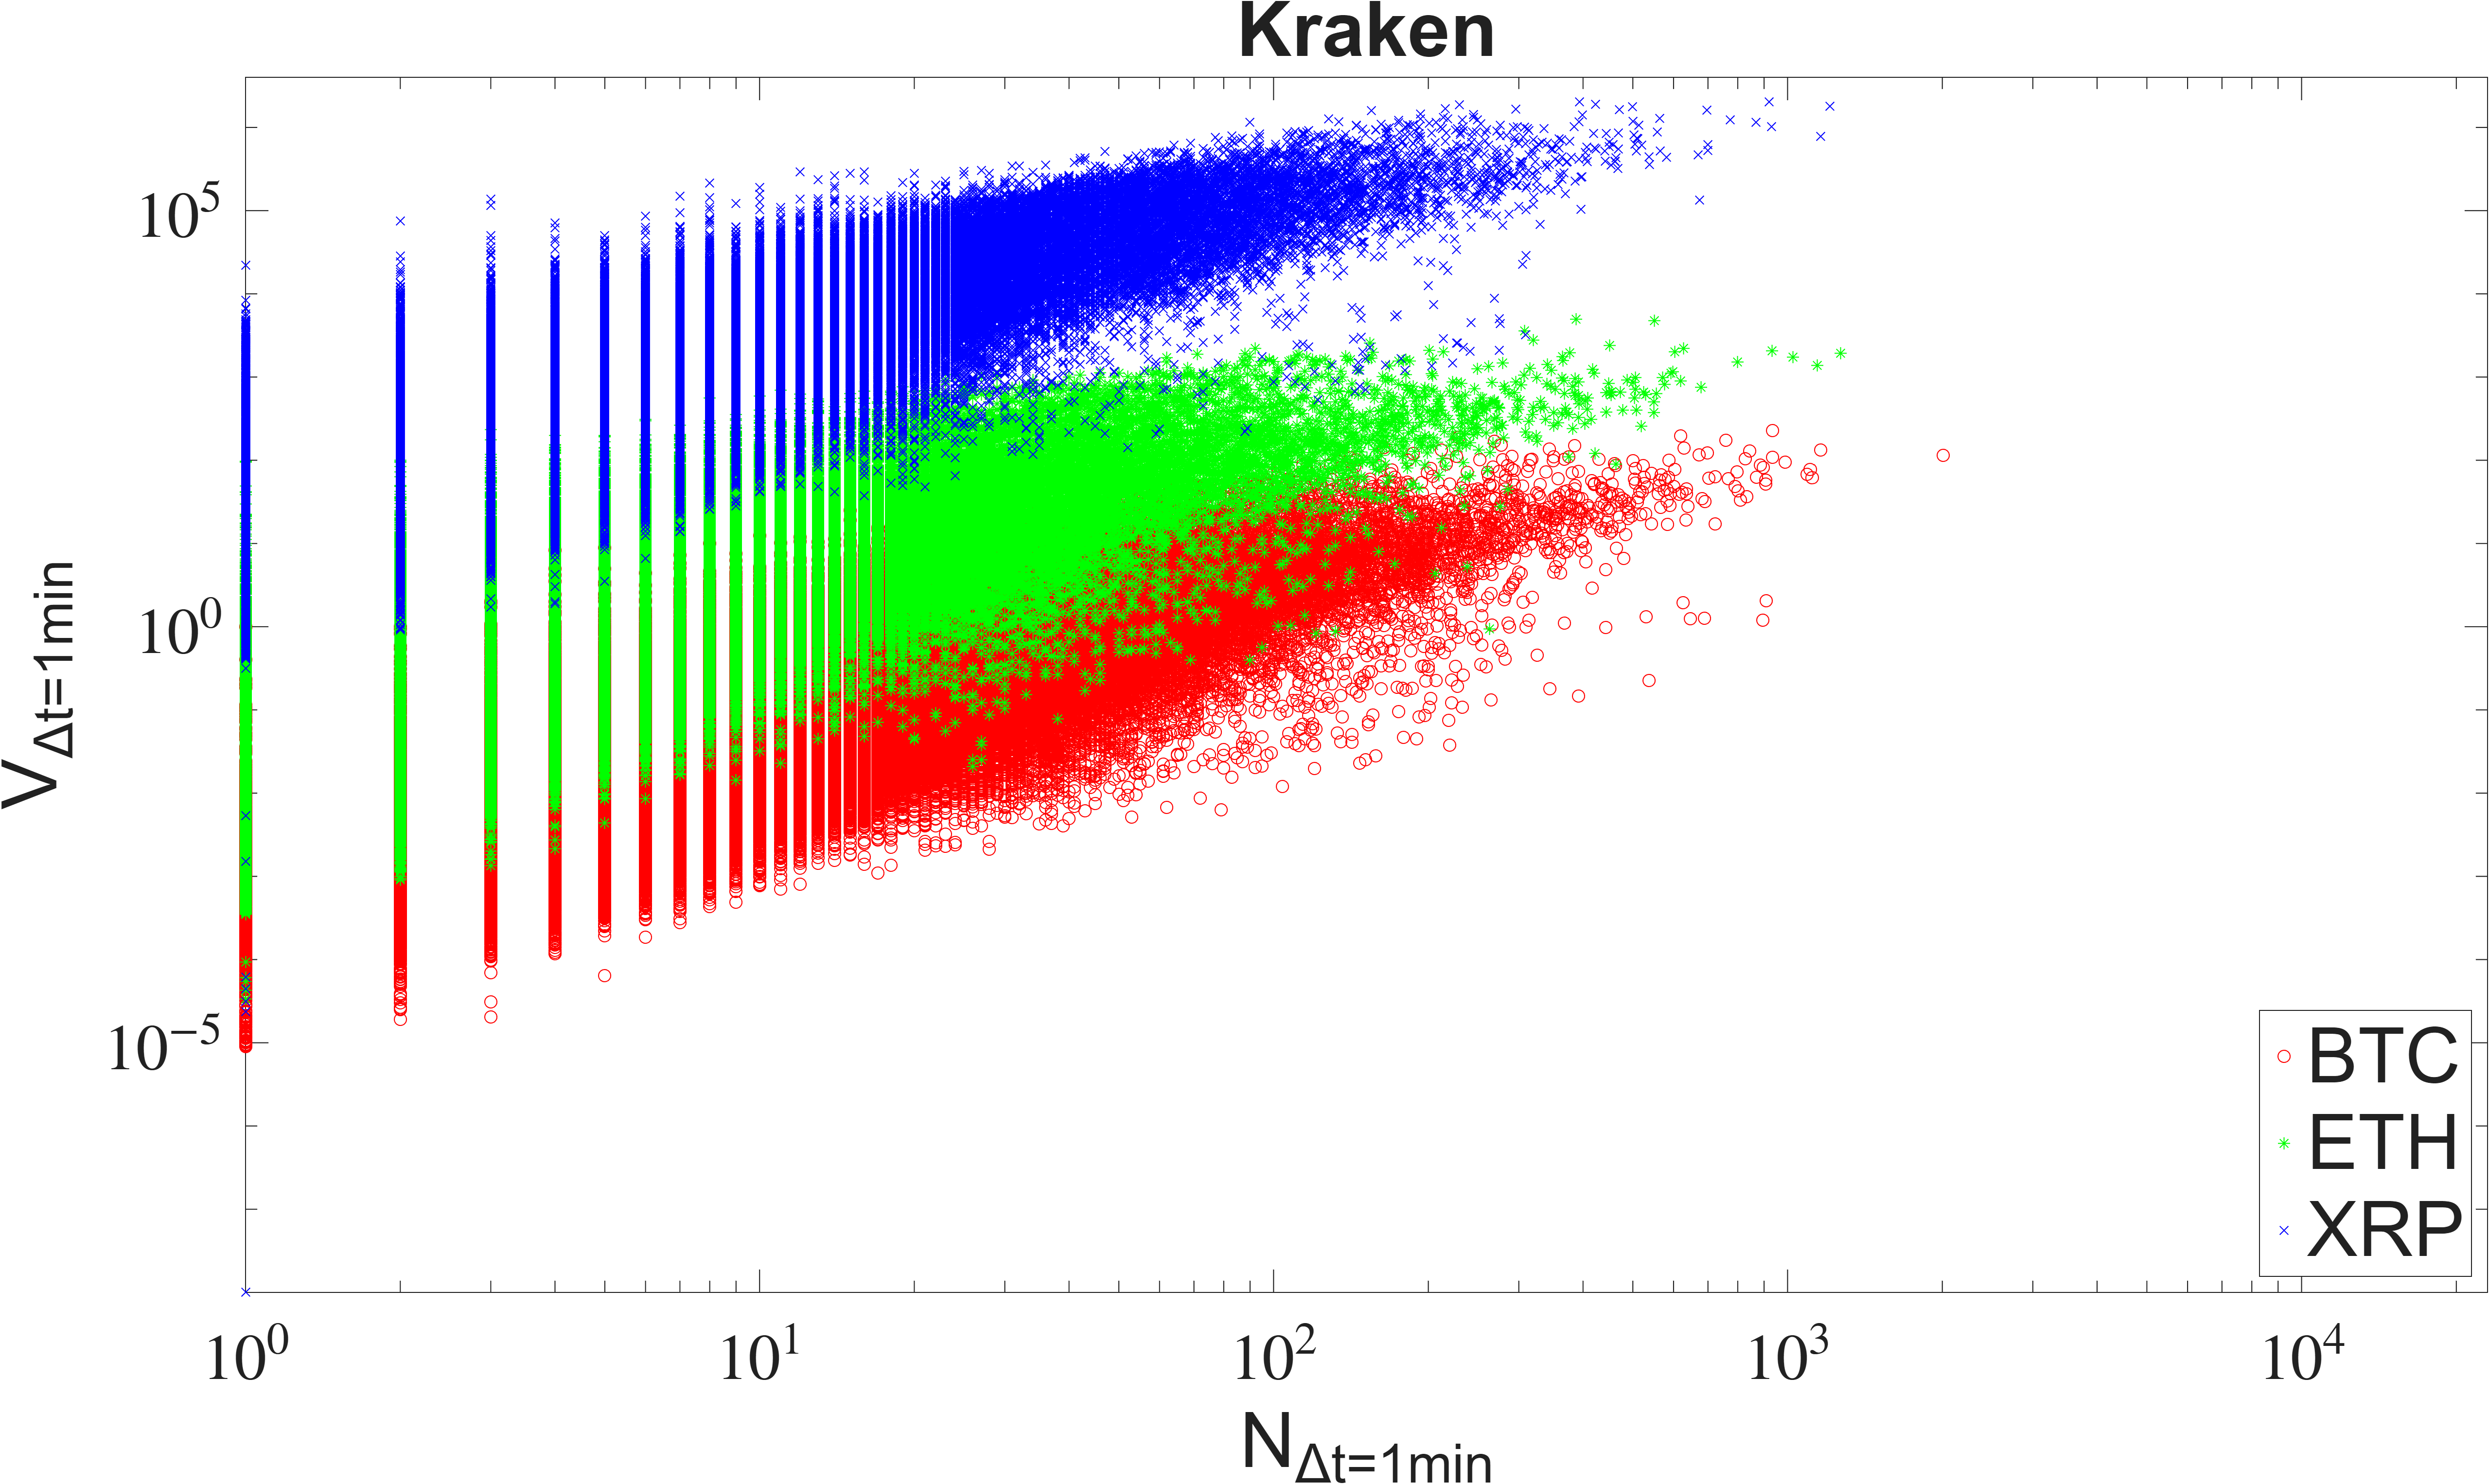
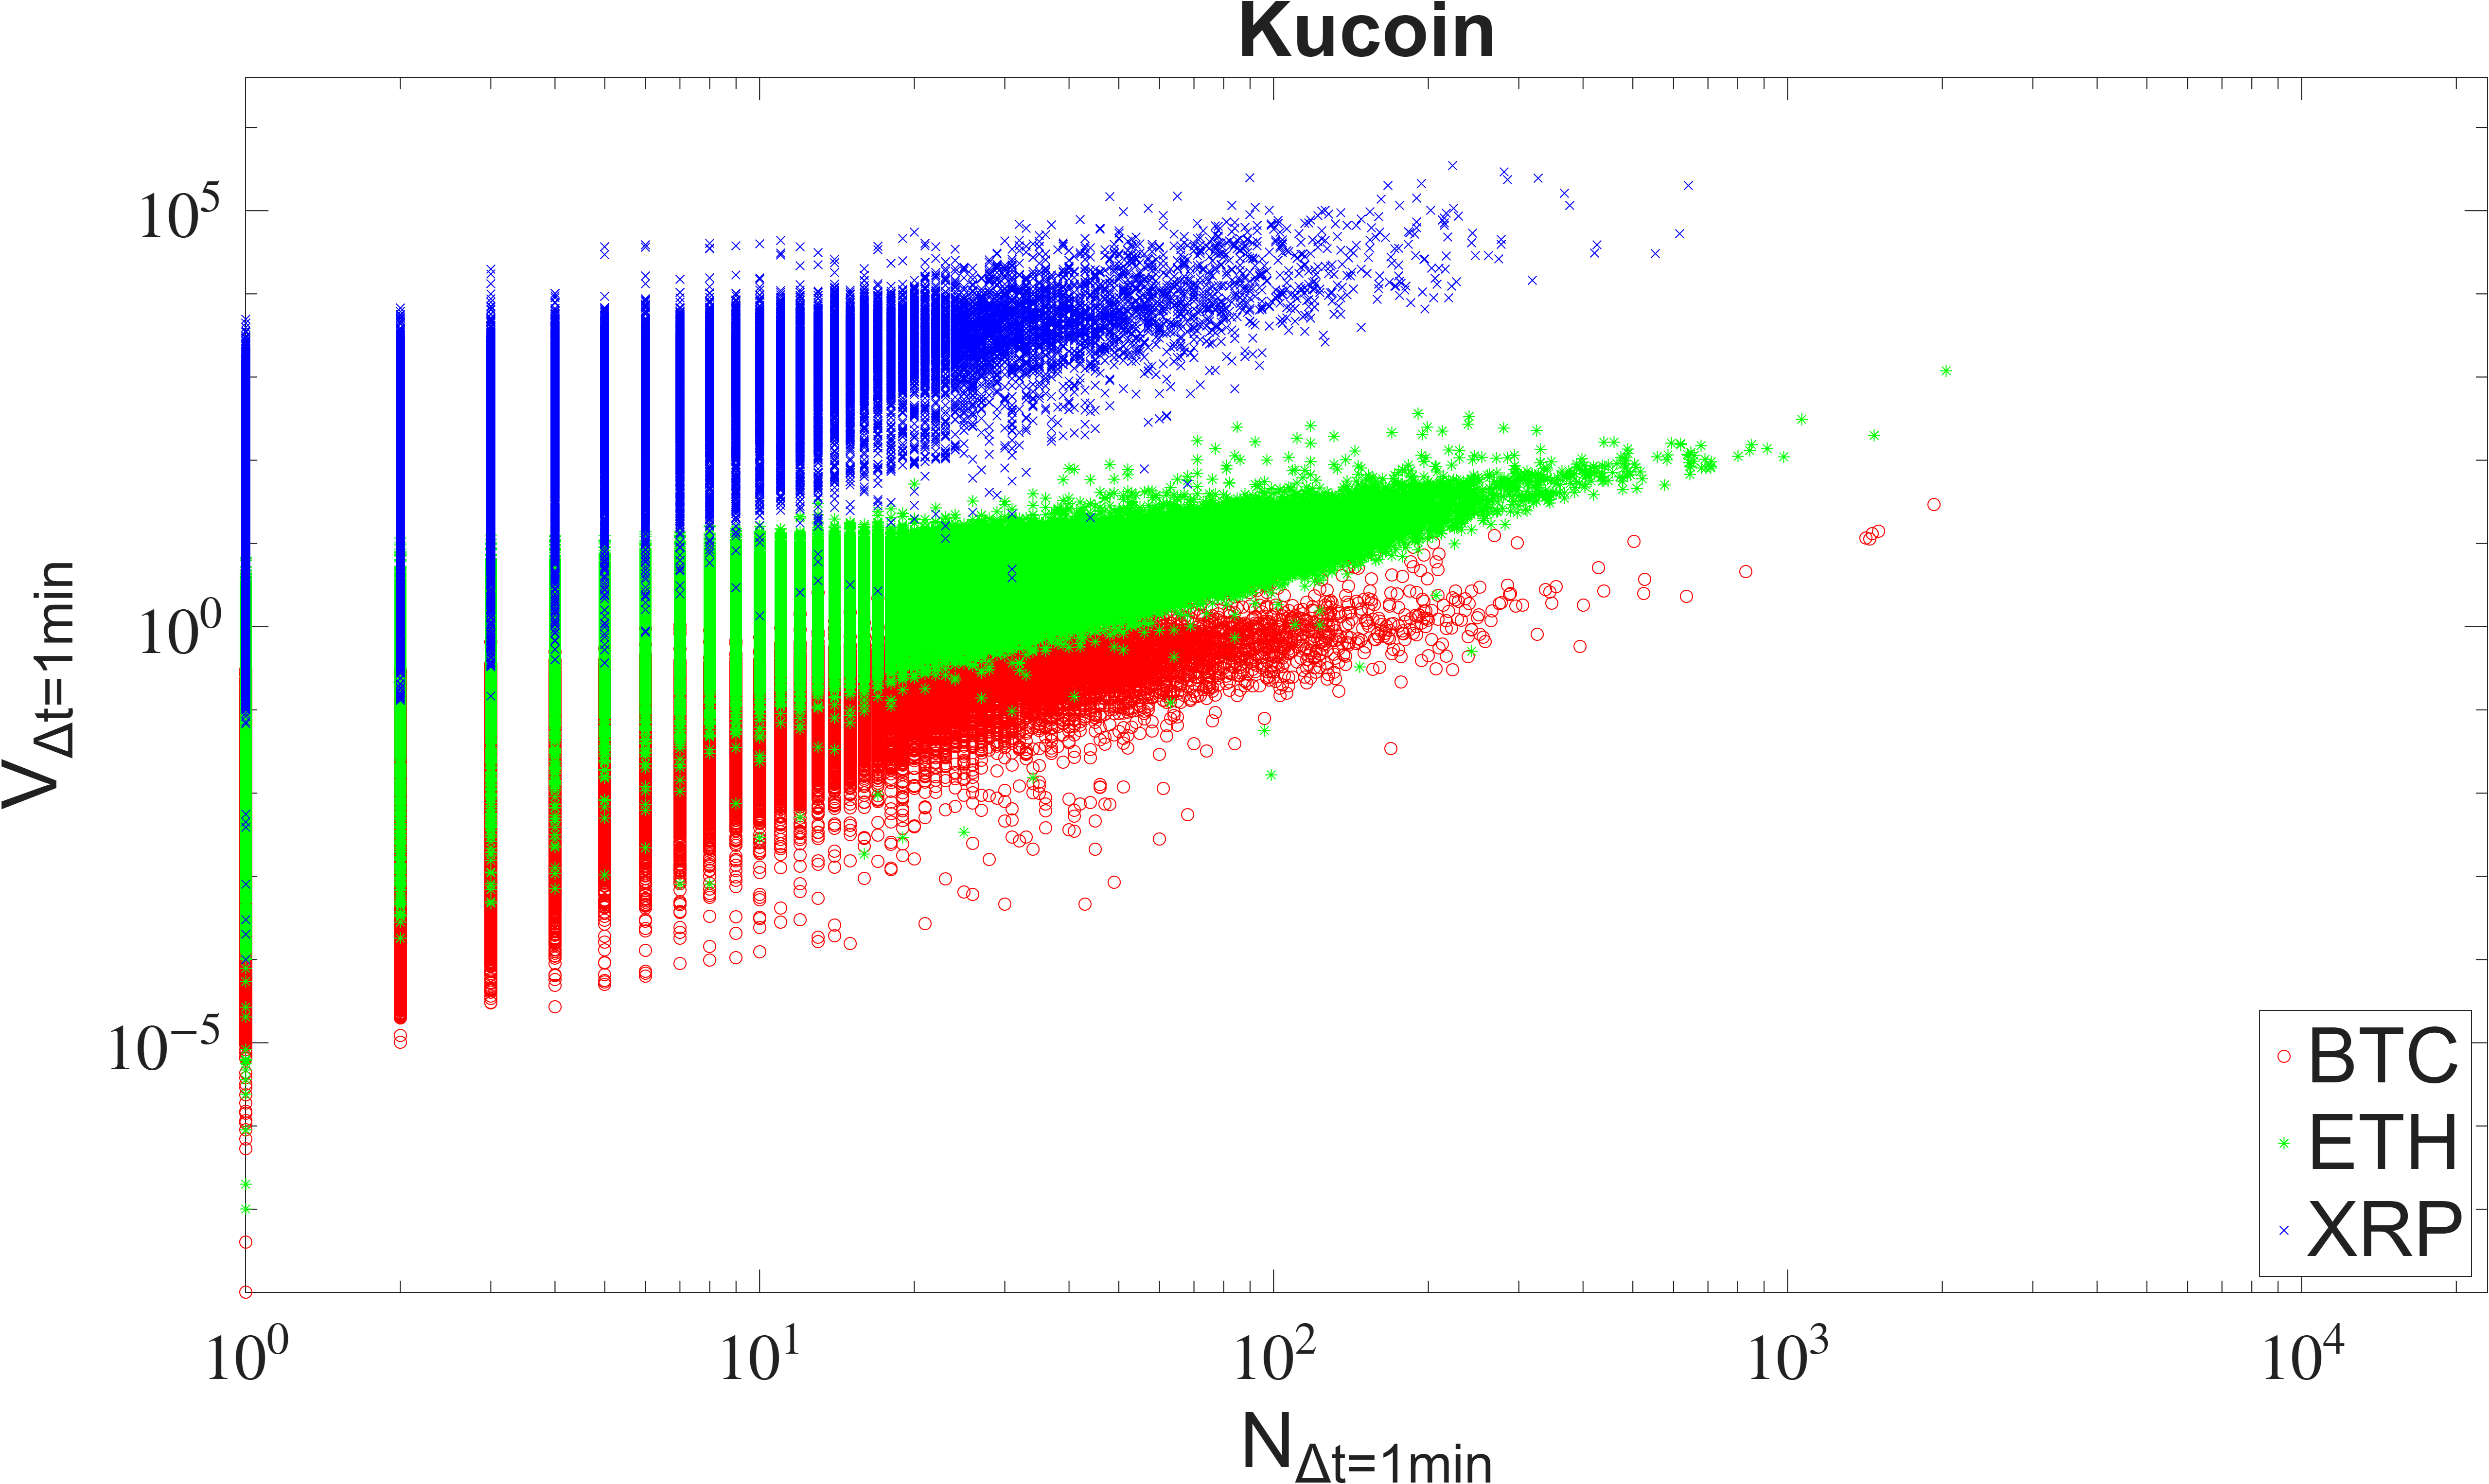
- The number of trades (transactions per minute) showed the biggest differences.
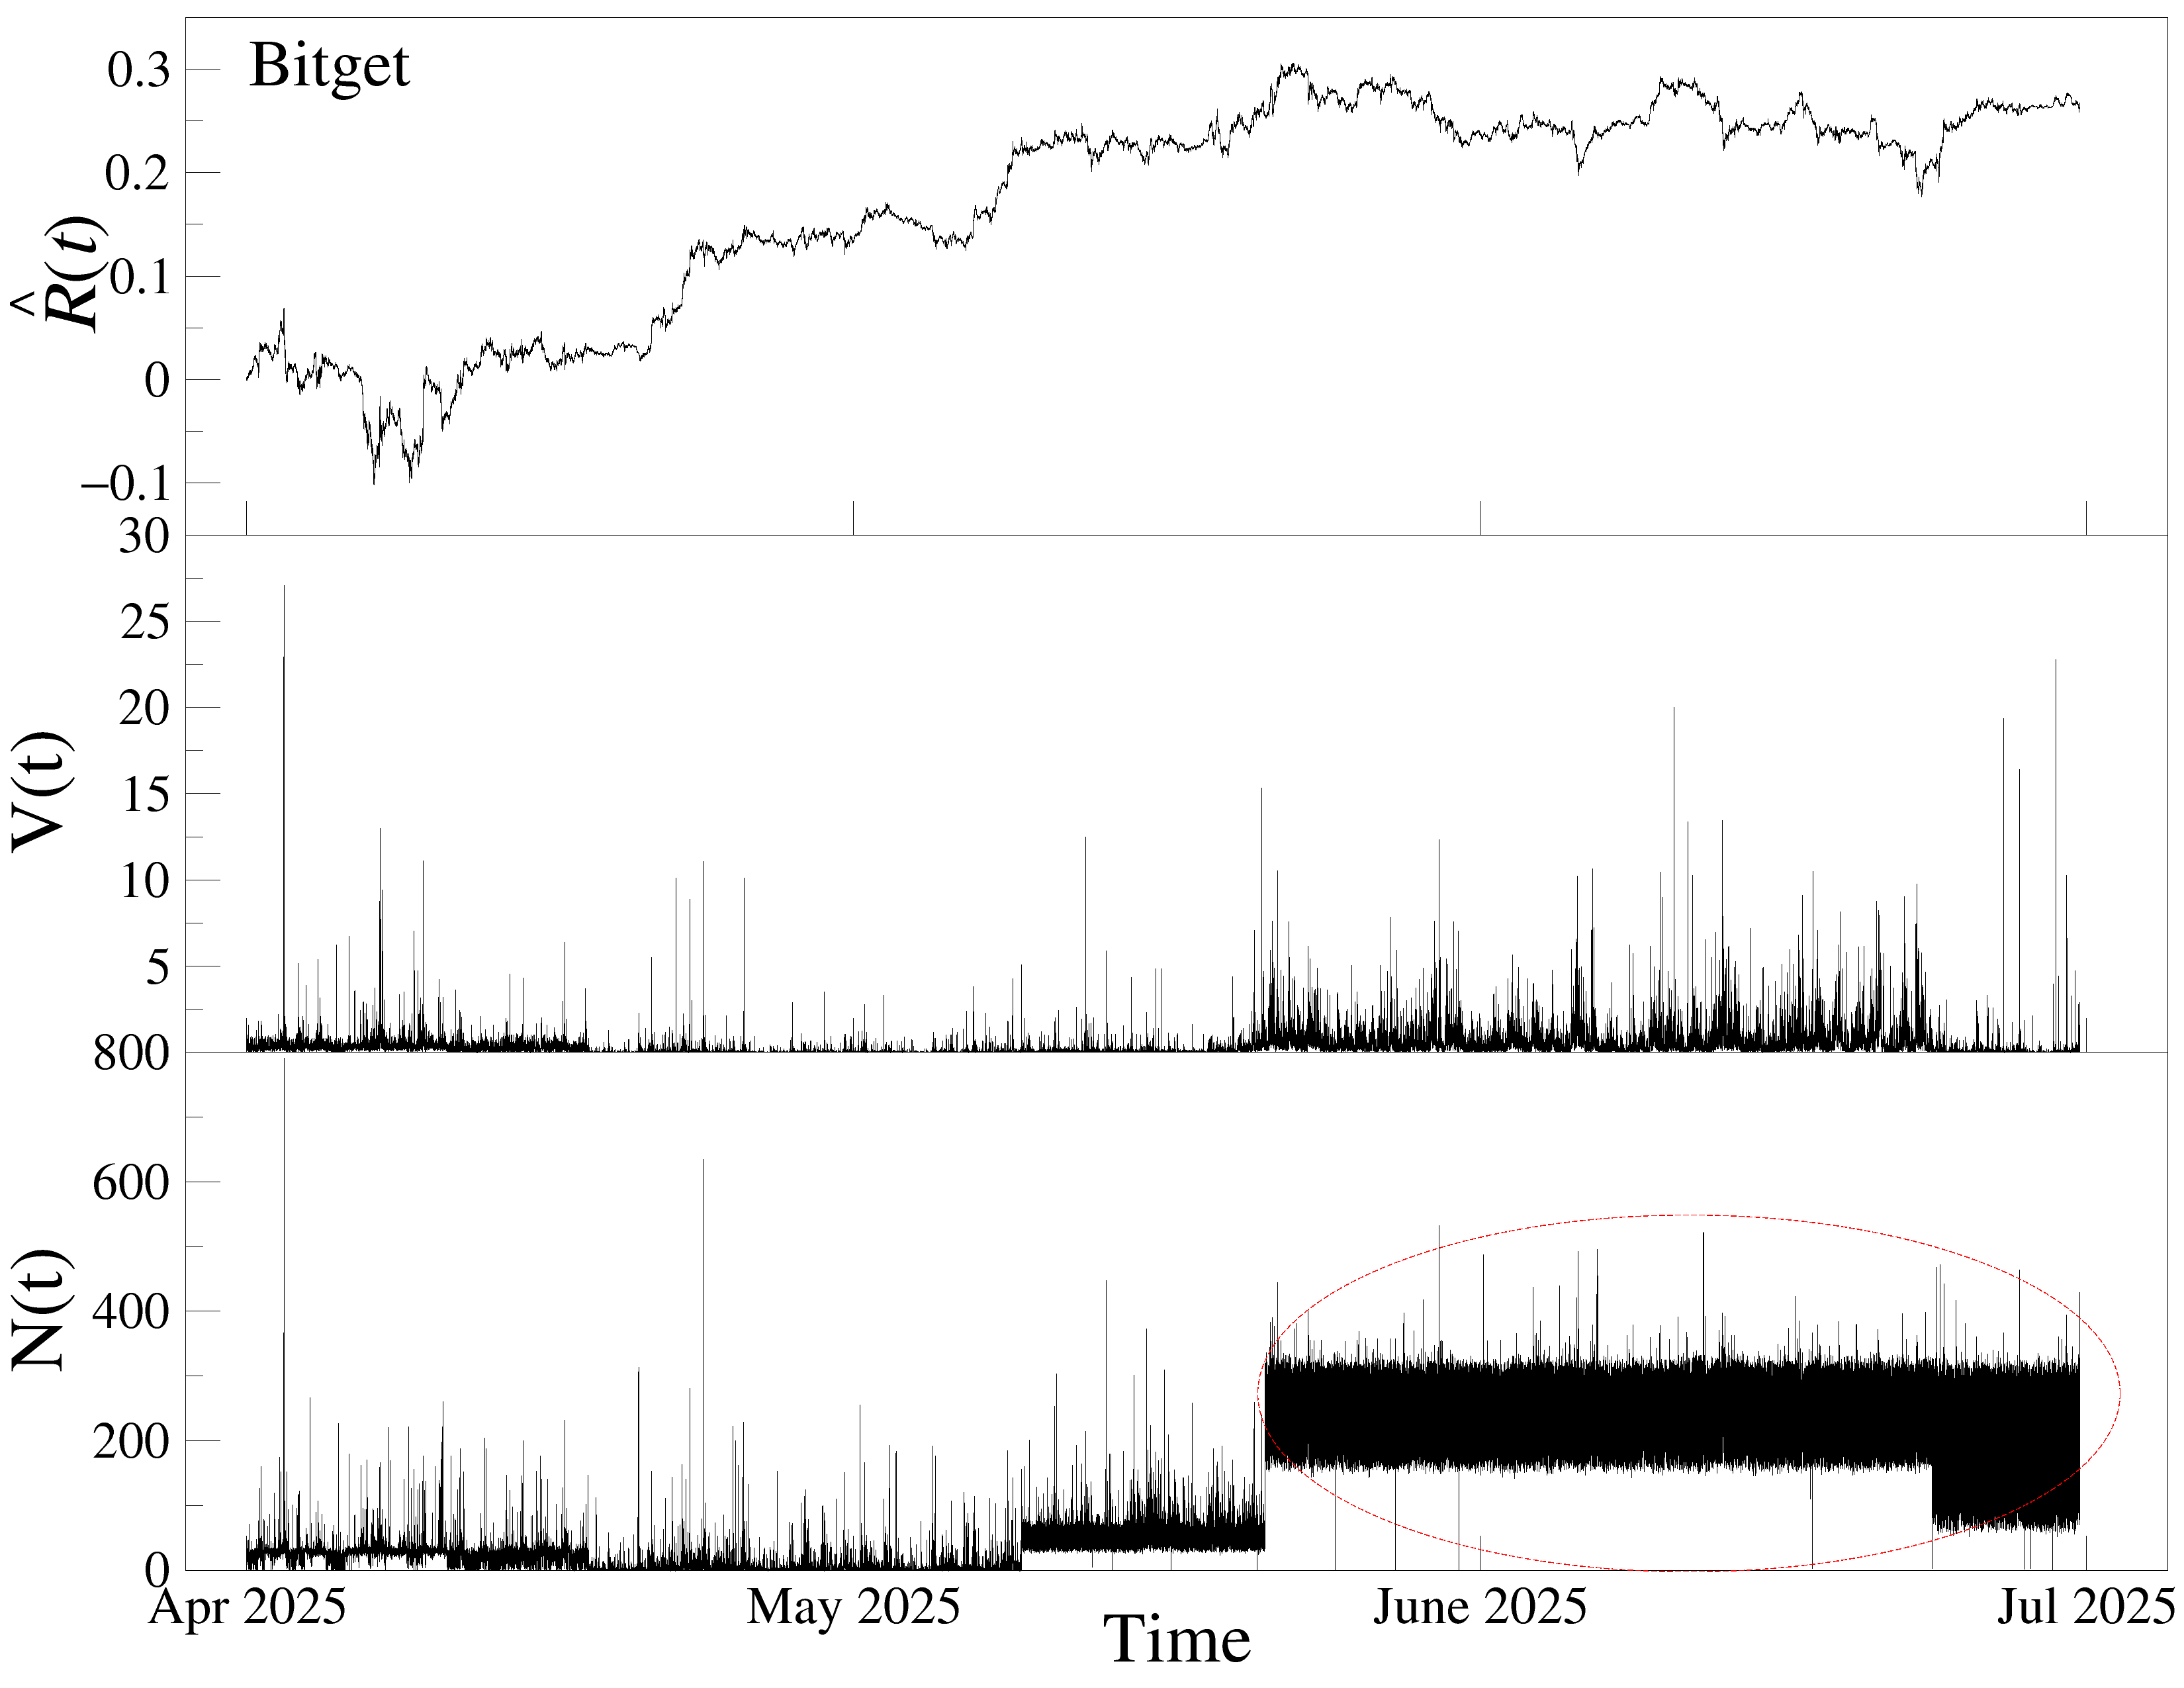
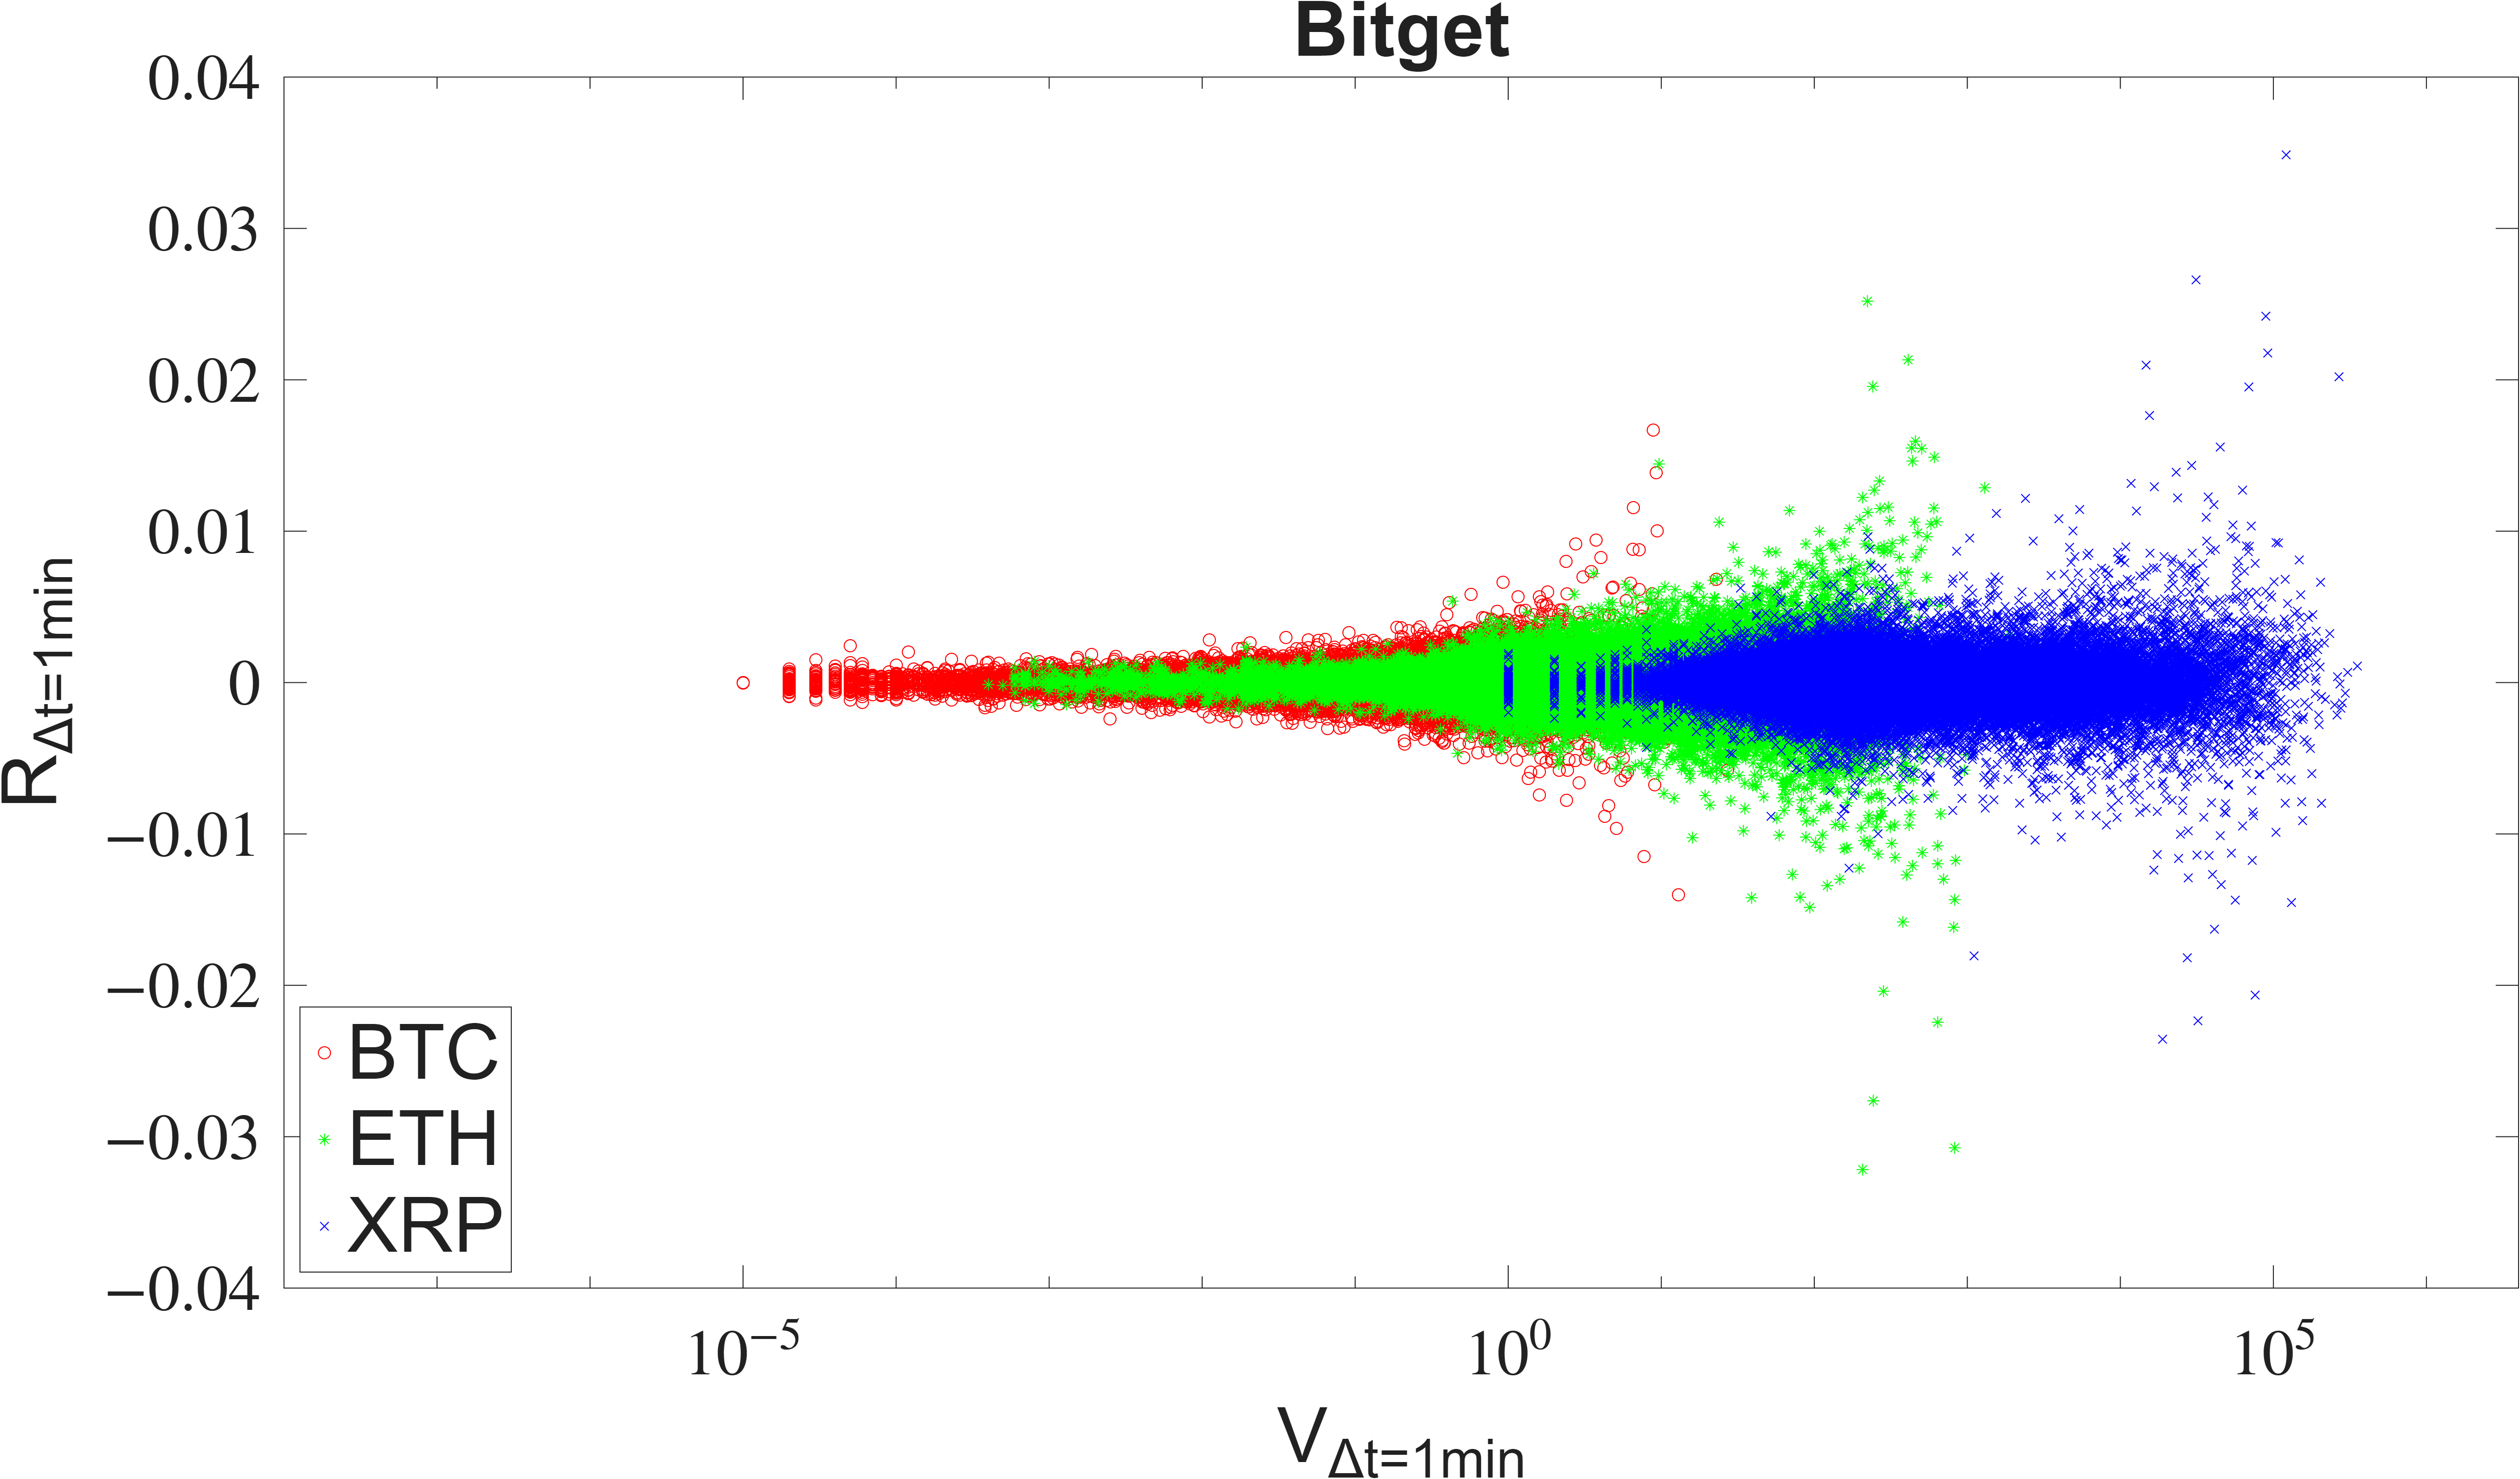
- A clear anomaly on Bitget for BTC and ETH after mid-May 2025
- Suddenly, there were many more trades per minute.
- But volume and price moves did not rise in step. In other words, there were lots of tiny trades, not lots of real buying/selling power.
- Pattern checks backed this up:
- Weaker autocorrelations where you’d expect stronger ones
- Reduced multifractal organization (the usual multi-scale structure broke down)
- Higher approximate entropy (short-term behavior got more “noisy” and irregular)
- Weaker cross-correlations between “number of trades” and the other series (volume and price changes decoupled from trade counts)
- Together, these signs suggest a noise-like component—many small trades that don’t behave like normal demand/supply. This can match tactics like excessive order-splitting or artificial activity meant to inflate reported trading counts.
- Important note: This is not direct proof of wash trading
- Wash trading means creating fake activity by trading with yourself or coordinated accounts to make the market look busier than it is.
- Centralized exchanges don’t reveal who is behind each trade, so you can’t label single trades as wash trades using public data alone.
- The paper shows patterns consistent with artificial boosting of transaction counts, but it cannot confirm intent or identity.
Why this matters
- Market quality and trust: If an exchange reports lots of trades that don’t reflect real buying/selling pressure, it can mislead traders, algorithms, and ranking sites about its true liquidity.
- Better detection tools: Price-based checks alone can miss anomalies. Complexity-based indicators can pick up mismatches inside trading activity (like “many trades, but not much volume”), which price charts won’t show.
What this could change or improve
- For regulators and data platforms: These tools can help flag exchanges or time periods where activity looks “too mechanical” or out of sync, prompting deeper investigations.
- For traders and analysts: Looking beyond price—at volume, trade counts, and their relationships—can give an early warning that something about the market’s “heartbeat” doesn’t feel natural.
- For exchanges: Transparency and healthier market-making practices can reduce the risk of being flagged by such diagnostics and improve user trust.
A quick recap you can remember
- The study checked BTC, ETH, and XRP across four exchanges in 1-minute data.
- It found a strong, unusual jump in the number of trades on Bitget for BTC and ETH after mid-May 2025—without matching increases in real volume or price swings.
- Complexity measures agreed: trading looked more “noisy” and less “naturally organized.”
- This pattern fits what you might see if transaction counts are artificially boosted—but it’s not direct proof.
- Conclusion: Complexity-based checks are a useful new lens for spotting trading anomalies that prices alone can hide.