A Spectral Generalisation of the Variance Ratio: Eigenstructure of Long-Horizon Portfolio Covariance and a Multi-Memory Factor Model of U.S. Equity Returns
Published 4 Jul 2026 in q-fin.ST, physics.soc-ph, and q-fin.PM | (2607.03858v1)
Abstract: We propose a multivariate generalisation of the Lo-MacKinlay (1988) variance ratio that decomposes long-horizon equity-return dynamics into separate return-channel and volatility-channel memory components across the cross-section of asset returns. The framework identifies a parsimonious five-factor model - capturing persistent, antipersistent, and multi-scale memory in returns and volatility - that fits four U.S. portfolio panels (the Fama-French 49-industry universe, its pre/post-1998 halves, and the Fama-French 100 size x book-to-market sort) and a European replication (Fama-French Europe 25), recovering seven stylised facts of long-horizon equity dynamics simultaneously across all five panels. Three findings carry economic content. (i) The same five-factor decomposition fits all five panels, indicating a cross-sectional structure robust to industry vs. size-and-value sorts, to sub-periods, and to U.S. vs. developed-European markets. (ii) U.S. equity volatility memory underwent a regime transition in the late 1980s - not at the static 1998 split-half boundary - with the slowest component of the volatility cascade lengthening from approximately two to four years; a 1000-replicate rolling-window bootstrap localises the transition with strictly non-overlapping 90% confidence bands separating pre- and post-transition windows. (iii) The cross-sectional loadings driving return-channel long memory are economically distinct from those driving volatility-channel cascade memory: a cross-channel beta-inversion test finds no panel with the positive alignment a single shared loading predicts, rejecting the shared-loading hypothesis toward anti-alignment on the two largest panels at Bonferroni p = 0.0004. Characteristics that predict return-momentum patterns therefore need not predict volatility-persistence patterns.
The paper introduces a spectral generalisation of the variance ratio, using eigendecomposition to analyze temporal autocorrelation in asset returns.
The paper develops a five-factor multi-memory model that captures persistent, antipersistent, and volatility cascade dynamics in U.S. equities.
The paper empirically validates the framework on U.S. and European data, revealing distinct loadings between return and volatility channels for improved risk management.
Spectral Generalisation of the Variance Ratio in Long-Horizon Portfolio Dynamics
Overview and Motivation
This work introduces a spectral generalisation of the variance ratio—classically a scalar test for deviation from random-walk behavior—to the full eigendecomposition of covariances in financial return cross-sections. The approach provides a unified framework to analyze how second-moment structure in asset returns and their volatilities aggregate across time horizons, moving beyond scalar or trace-based statistics and instead probing the full operator-level dynamics across eigenmodes. Empirically, the paper develops and validates a five-factor multi-memory model in U.S. equities, extending to out-of-sample European data and quantifying regime transitions in volatility memory.
The core methodological innovation is the construction of two matrix-valued statistics indexed by both aggregation horizon H and eigenmode i:
Per-Eigenmode Variance Ratio
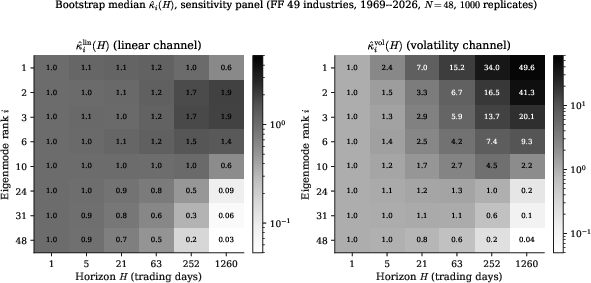
κi(H)=H⋅λi(Σ1)λi(ΣH),
with λi(⋅) denoting the ith eigenvalue of the covariance at horizon H, measuring temporal autocorrelation along principal directions.
Eigenvector Overlap Matrix
Oij(H)=∣⟨vi(ΣH),vj(Σ1)⟩∣2,
quantifying the rotation of the eigenbasis as aggregation horizon increases.
Specialization to the linear channel (covariance of log-returns) and volatility channel (covariance of squared log-returns) allows the joint modeling of both return and volatility dynamics across the cross-section.
Figure 1: Bootstrap medians of κ show horizon and rank dependence in both linear and volatility channels, revealing strong deviations from the i.i.d. null and heterogeneity across eigenmodes.
This framework generalizes earlier scalar and trace/determinant-based multivariate variance ratio approaches, which cannot distinguish combinations of per-eigenmode temporal autocorrelation and eigenbasis rotation, and is strictly more informative (2607.03858).
Multi-Memory Factor Model
Empirical evidence from the (κ,O) statistics is not well-captured by a single-memory (e.g., AR(1)) factor structure. The observed patterns require both persistent and antipersistent components, as well as multi-scale, long-memory volatility. The author introduces a five-factor model, with factors as follows:
FP: persistent (fractional Brownian, i0)
i1: antipersistent (fractional Brownian, i2)
i3: central multifractal (ARFIMA + MSM volatility cascade)
i4: volatility cascade without linear-channel impact
i5: transitory volatility-of-volatility (ARFIMA on volatility)
Each factor has a cross-asset loading (i6), with explicit forms for predictions of both i7 and i8, estimated via regularized, loss-conditional, joint least-squares over bootstrap-replicated panels.
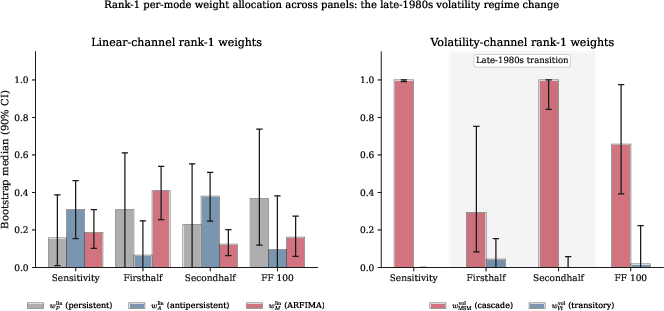
Figure 2: Rank-1 per-mode weight allocation across panels; right panel shows dominance of MSM cascade in volatility channel after the late-1980s regime shift.
Empirical Findings
Recovery of Stylized Facts
The model is fit on four panels (full-sample, pre-1998, post-1998, size/book-to-market sorted), with an additional out-of-sample European equity panel for replication. Empirical variance ratio matrices recover seven established stylized facts of long-horizon equity dynamics across all panels:
Market-mode variance-ratio "anomaly": rise-then-fall in i9.
Sub-leading eigenmode "momentum": rising κi(H)=H⋅λi(Σ1)λi(ΣH),0 for κi(H)=H⋅λi(Σ1)λi(ΣH),12--3.
Deep-mode mean reversion.
Short-range volatility clustering.
Multi-scale, long-memory volatility (κi(H)=H⋅λi(Σ1)λi(ΣH),2 at long κi(H)=H⋅λi(Σ1)λi(ΣH),3).
Transitory volatility in deep modes.
Volatility cross-sectional concentration onto a single dominant eigenmode.
Robust factor-profile parameters—especially Hurst exponents κi(H)=H⋅λi(Σ1)λi(ΣH),4–κi(H)=H⋅λi(Σ1)λi(ΣH),5, κi(H)=H⋅λi(Σ1)λi(ΣH),6–κi(H)=H⋅λi(Σ1)λi(ΣH),7—indicate universality across panels.
Regime Transition in Volatility Memory
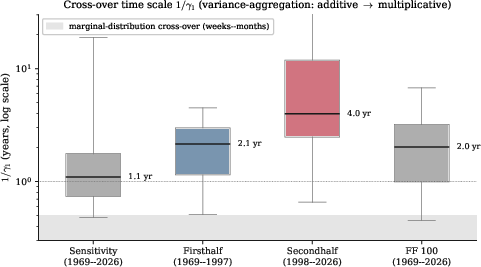
The analysis uncovers a regime transition in volatility memory localized to the late 1980s, detected via rolling-window bootstrap of MSM-cascade weights. The lowest-frequency MSM component's timescale doubles post-transition from κi(H)=H⋅λi(Σ1)λi(ΣH),8 to κi(H)=H⋅λi(Σ1)λi(ΣH),9 years, with sharp non-overlapping confidence intervals distinguishing pre- and post-transition regimes. This transition is not aligned with the standard 1998 break—and is robust across both industry and size/value panels.
Figure 3: Bootstrap distributions of the MSM lowest-frequency cross-over time scale λi(⋅)0 (in years) across panels, quantifying the regime shift in volatility aggregation timescales.
Non-Coherence of Cross-Channel Loadings
A central theoretical claim of the model—that the same cross-sectional loadings drive both return and volatility-channel memory—is subject to explicit falsification. A λi(⋅)1-inversion diagnostic recovers per-asset attributions from both channels; the expected positive cross-channel correlation under a shared loading is not observed. Instead, negative or null Pearson/Spearman correlations are found and formally rejected at high significance (Bonferroni λi(⋅)2 on largest panels).
This implies that linear and volatility memory load on distinct cross-asset structures: attributes that explain return channel persistence/mean reversion do not predict volatility memory, even at the factor level.
Discussion and Implications
The spectral approach to variance decomposition allows fine-grained modeling and diagnosis of horizon effects in both mean and volatility aggregation. The multi-memory factor model, validated on extensive U.S. and European data, provides a comprehensive structural explanation for second-moment behavior in financial time series over long horizons. The analytic results for the λi(⋅)3 statistics under AR(λi(⋅)4), vector AR(1) with mixing, and explicit factor models enable both parametric and nonparametric understanding of temporal aggregation phenomena.
Practical
For risk management and portfolio construction, the work implies that long-term volatility risk and return-persistence exposures can and should be modeled separately, and that apparent breaks in volatility memory can have meaningful economic and regulatory correlates.
The rolling-window spectral bootstrap offers a method for non-stationarity detection and regime dating in multivariate financial data, not possible with classical, aggregate variance-ratio tests.
Theoretical/Future Directions
The framework is extensible to other asset classes, non-equity cross-sections, and international data. Future studies could integrate the eigenvector overlap statistic λi(⋅)5 as a second-moment condition for even finer structure.
The disconnect between linear and volatility-channel loadings exposes new avenues for cross-sectional modeling and diversifies the concept of “factors” beyond traditional single-channel approaches.
Conclusion
By generalizing the variance ratio to the full spectrum of cross-sectional covariances, this work provides a unifying, operator-level perspective on the memory structure of equity returns and volatility. The five-factor multi-memory model, tightly validated empirically, captures not only the established stylized facts but also identifies sharp volatility regime transitions and demonstrates channel-distinct cross-asset dependencies. The theoretical and applied contributions, including tractable spectral formulas and rigorous cross-validation, set a standard for future empirical asset pricing, risk decomposition, and time series modeling (2607.03858).
“Emergent Mind helps me see which AI papers have caught fire online.”
Philip
Creator, AI Explained on YouTube
Sign up for free to explore the frontiers of research
Discover trending papers, chat with arXiv, and track the latest research shaping the future of science and technology.Discover trending papers, chat with arXiv, and more.