- The paper presents a three-axis fidelity evaluation (structural, marginal, individual) for assessing LLM-based survey simulators using limited pilot data.
- It benchmarks various calibration methods, including prompt-based, PPI rectification, and LoRA+MLP fine-tuning, to recover statistical relationships and distributions.
- Results demonstrate that while fine-tuned models achieve high overall fidelity, individual and subgroup discrepancies highlight ongoing challenges.
Three-Axis Fidelity Evaluation for LLM-Based Survey Simulators with Limited Human Pilot Data
LLMs are now routinely applied to simulate human responses in social surveys, but these simulations are subject to pronounced statistical biases, including miscalibrated marginal distributions, attenuated response variance, and weakened predictor–outcome associations. The investigated problem is whether, when provided only a small pilot sample of human responses, an LLM-based simulator can accurately reconstruct the statistical structure of the source population. This work formalizes the simulation task as one of statistical recoverability, dissected along three distinct axes: structural fidelity (preservation of predictor–outcome relations), marginal fidelity (alignment of marginal distributions), and individual fidelity (congruence at the respondent level).
Calibration Methods Assessed
The authors systematically benchmark several families of calibration strategies using data from a COVID-19 misinformation belief survey (N=1,466; pilot n=74):
- Prompt-based approaches: Zero-shot (ZS) and few-shot (FS) prompting, both in batch and per-item forms.
- Statistical rectification: Application of Prediction-Powered Inference (PPI) to adjust simulated estimates using the pilot sample.
- Parameter-efficient fine-tuning: LoRA-based adaptation of Qwen3-8B, with and without an additional trainable MLP classification head.
Multi-Axis Evaluation Protocol
Recovery along each axis is mapped to explicit statistical metrics:
- Structural fidelity: Lin’s Concordance Correlation Coefficient (CCC) between ground truth and simulated predictor–outcome associations (bivariate r and OLS β coefficients).
- Marginal fidelity: Wasserstein-1 Earth Mover’s Distance (EMD) comparing the distributions of three respondent-level summary statistics between simulator and ground truth.
- Individual fidelity: Pairwise Pearson’s r and mean absolute error (MAE) between respondent-level summary scores in simulated and ground truth datasets.
Structural Fidelity: Recovery of Predictor–Outcome Structure
The assessment of structural fidelity centers on the degree to which simulated data preserve underlying relationships between 12 key predictors (psychometric and demographic) and respondents’ discernment scores.
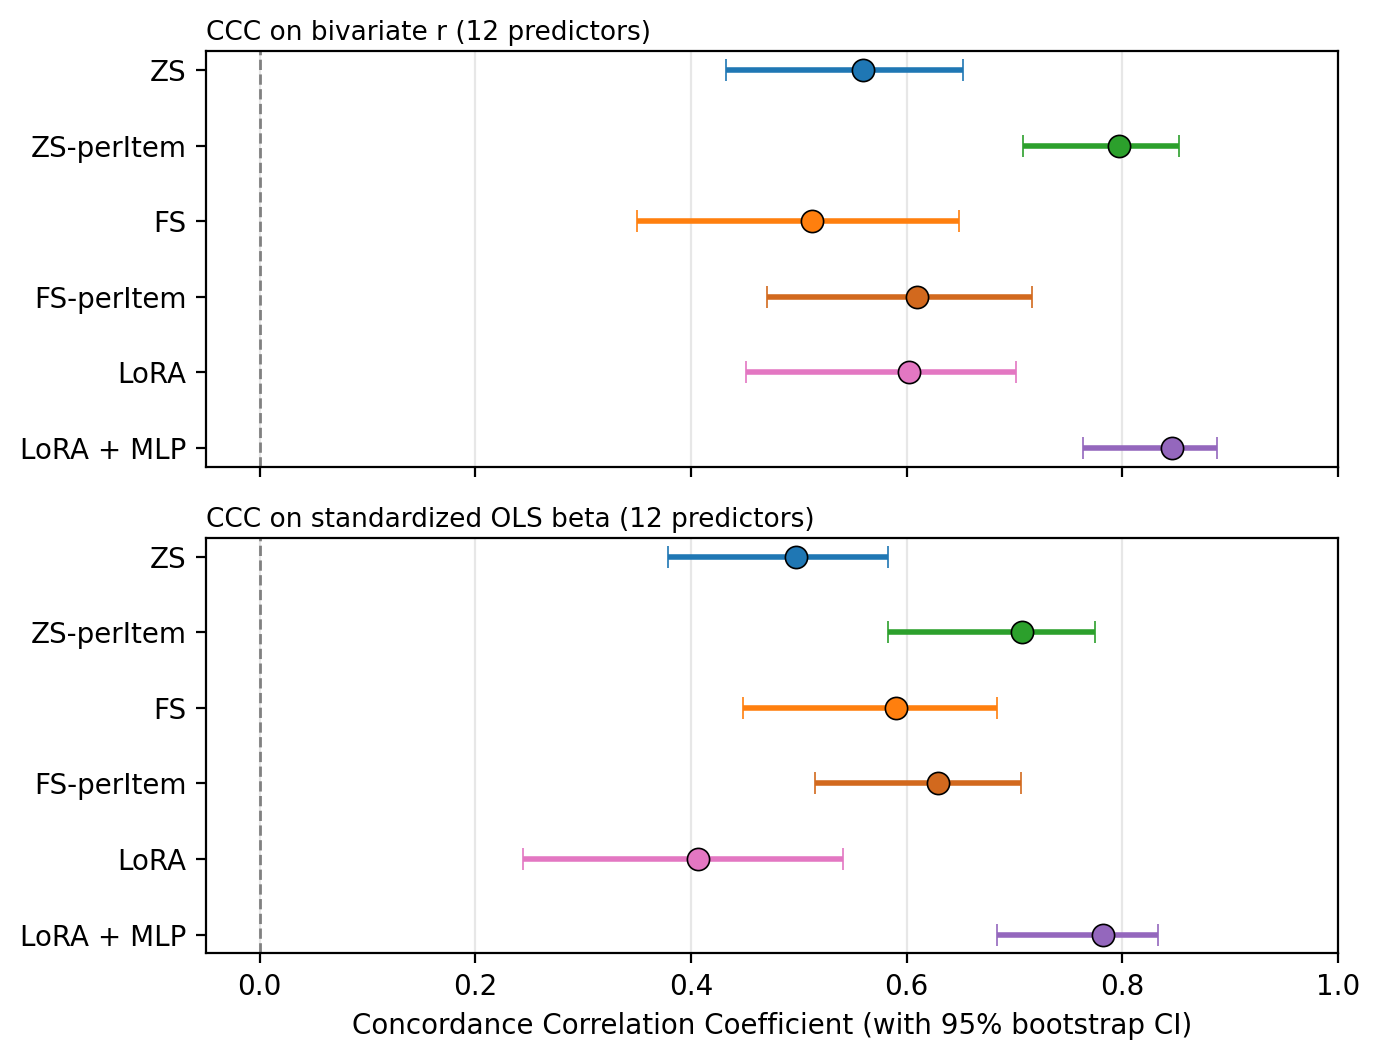
Figure 1: Structural-fidelity forest plot on the 12 predictors, presenting Lin's CCC with bootstrapped confidence intervals for each method.
LoRA + MLP fine-tuning achieves the highest overall structural fidelity (CCC = 0.85 for bivariate correlations, 0.78 for OLS coefficients), closely followed by the per-item ZS prompting (CCC = 0.80 for r, 0.71 for β), outperforming standard prompt- and LoRA-based simulators. Sign-agreement and magnitude ratio decomposition indicate that high headline CCC requires precise matching of both coefficient directionality and magnitude, with LoRA + MLP and FS-perItem achieving the greatest concordance on directional alignment (11/12 predictors with matching signs).
Marginal Fidelity: Population-Level Distribution Alignment
The capacity of simulators to match the full-sample cross-respondent distributions was benchmarked using EMD on three summary scores (discernment, misinfo mean, trueinfo mean).
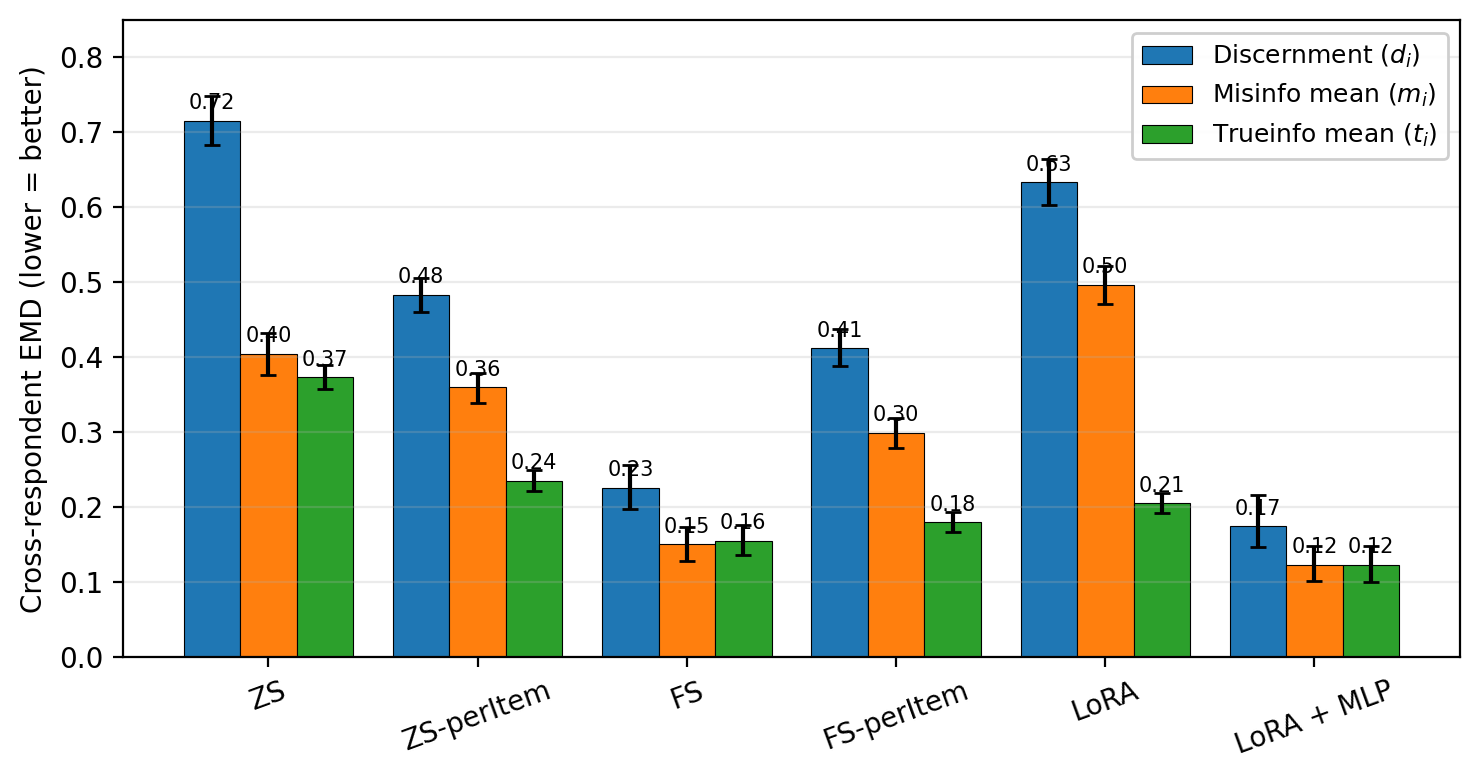
Figure 2: Cross-respondent EMD for discernment, misinfo, and trueinfo summary statistics; lower values indicate stronger marginal fidelity.
LoRA + MLP delivers the lowest EMD scores across all axes, signifying closest alignment to the human population’s summary statistics. Application of PPI rectification is shown to benefit simulators with high intrinsic bias (notably the ZS baseline), but offers limited or detrimental changes to estimators already near-calibrated to ground truth. Notably, PPI is algebraically degenerate for simulators perfectly fitting their own training data (e.g., LoRA-based methods).
Individual Fidelity: Respondent-Level Agreement
Assessment of individual fidelity reveals the modest performance of all methods in reproducing respondent-level rankings and scores.
LoRA + MLP secures the strongest respondent-level relative agreement (rd=0.37), with per-item ZS prompting also competitive (rd=0.31). However, the upper bound on concordance remains relatively low; even the most proficient simulator explains only about 14% of the variance in individual discernment. Absolute error metrics (MAE) reflect a comparable ordering.
Subgroup Fidelity: Assessing Pluralistic Alignment Risks
To interrogate the risk that aggregate fidelity masks systematic underperformance for minority subgroups, the best-performing simulator (LoRA + MLP) was evaluated across demographics such as gender, age, and political orientation.
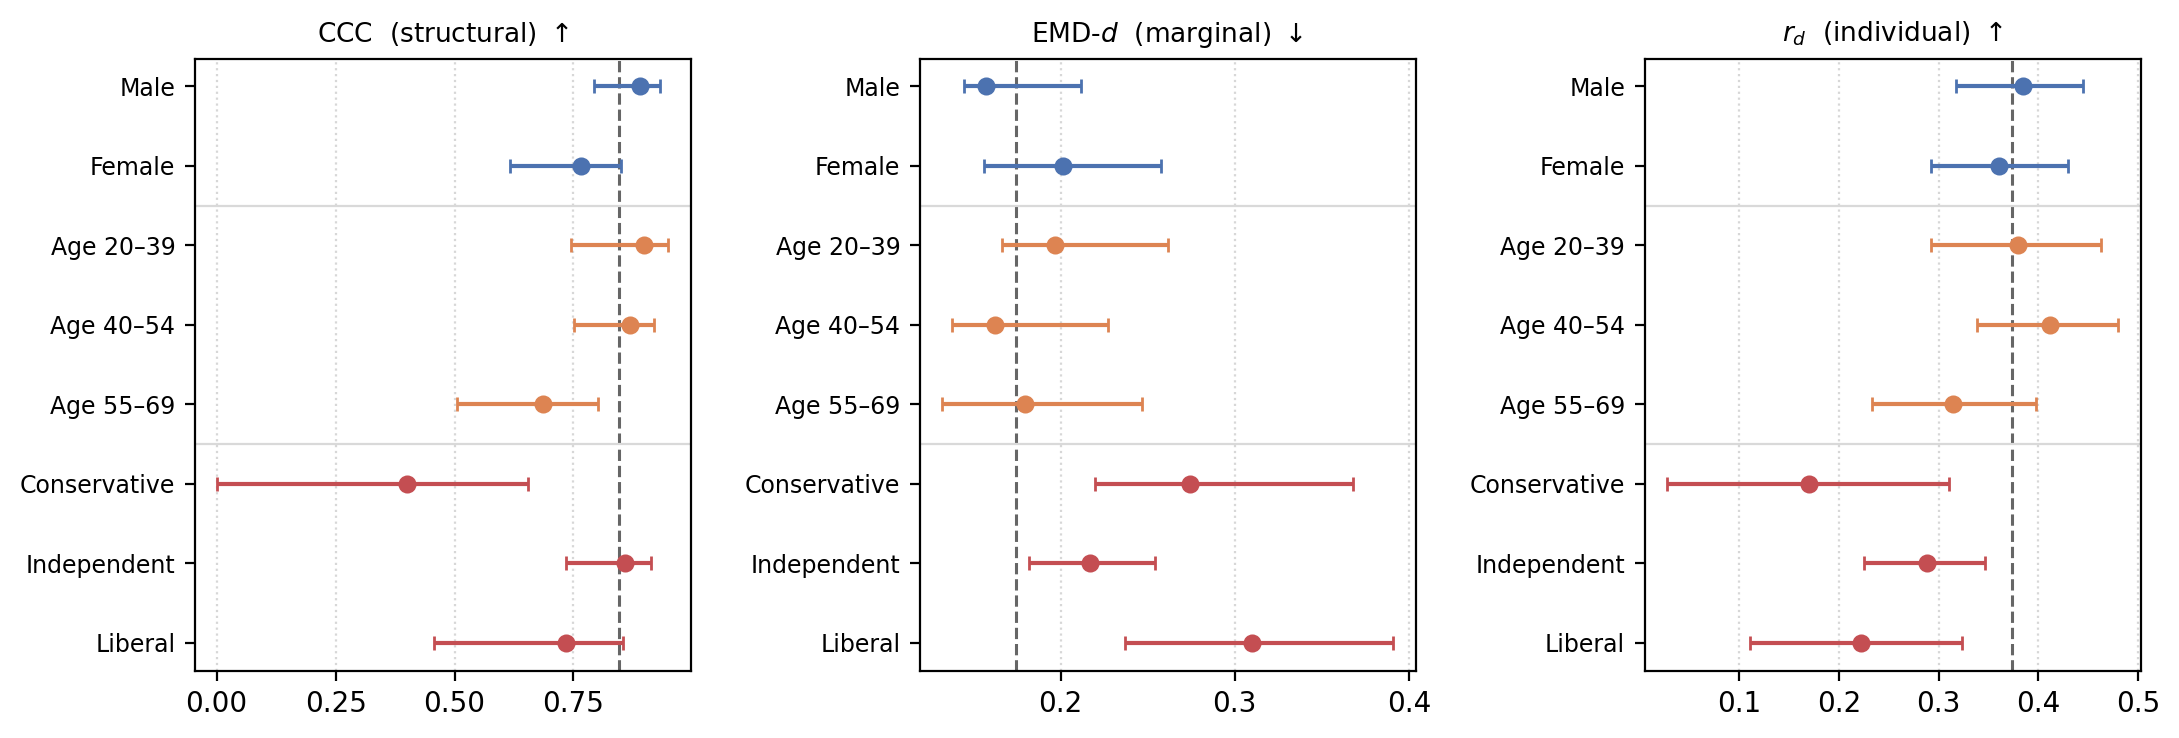
Figure 3: Subgroup fidelity of LoRA + MLP across the structural, marginal, and individual axes compared to the full-sample values.
Recovery is notably heterogeneous; for example, structural fidelity (CCC) drops sharply from 0.85 overall to 0.40 in the conservative subgroup and is lower in the oldest age cohort. This underlines the concern that simulators optimized for overall recovery may still inadequately represent subgroup-specific structure—a critical issue for pluralistic alignment.
Key Numerical Results and Claims
- LoRA + MLP achieves the highest joint fidelity across structural, marginal, and individual metrics; e.g., bivariate r CCC = 0.85, EMD = 0.17, n=740 = 0.37.
- Discrepant subgroup fidelity: Structural fidelity can fall by more than half in certain political subgroups (CCC: 0.85 [full] → 0.40 [conservative]).
- Marginal matching does not guarantee structure or individual recovery; some methods have low EMD but poor predictor–outcome matching.
- PPI rectification offers utility only when simulator bias exceeds pilot sampling variance—otherwise, it can degrade fidelity or be algebraically redundant.
Practical and Theoretical Implications
The authors establish that small-pilot fine-tuning, especially with a discriminative output head (LoRA + MLP), can meaningfully improve simulation fidelity on multivariate axes. However, such tuning does not uniformly resolve individual-level or subgroup-specific discrepancies, and strong population-average performance is not sufficient to guarantee pluralistic fidelity. The findings caution against treating LLM-generated survey responses as direct substitutes for real human data, especially in subpopulation-sensitive applications.
PPI-based statistical correction tools exhibit limitations in scenarios where the predictor achieves zero pilot error via fine-tuning, establishing clear boundaries for their use. The output head design is shown empirically to have a pronounced effect on simulation fidelity, which motivates further methodological investigation.
Future Directions
Anticipated future developments include cross-domain replications, systematic analysis of pilot sample size effects, alternative fine-tuning objectives explicitly targeting distributional or subgroup conditional alignment, and the design of simulators enhancing individual-level fidelity. Stronger backbone models or expanded context lengths may further refine recoverability, but subgroup auditing and robust evaluation remain key.
Conclusion
This work provides a rigorous, multi-axial protocol for auditing LLM-based survey simulators, demonstrating the benefits and limitations of prompt-based, rectification, and fine-tuning approaches. While pilot-based fine-tuning with discriminative output heads achieves state-of-the-art population-recovery metrics, substantial challenges remain for individual-level and subgroup-aligned simulation, underscoring the necessity for careful auditing and method development in the future deployment of LLMs for computational social science (2606.28963).

