- The paper introduces I-QMapper, an interactive tool that integrates error-aware qubit mapping with real-time device diagnostics.
- It employs a novel Layout-Quality Score (LQS) that synthesizes gate and readout errors to quickly identify performance bottlenecks.
- The tool supports multi-backend and multi-programming regimes, ensuring reproducibility and scalable quantum experiments on NISQ hardware.
I-QMapper: Error-Aware Layout Optimization and Device Diagnostics for NISQ Hardware
Motivation and Context
The evolution of NISQ hardware continues to expose inherent device variability and temporal instability in gate and readout errors, as well as coherence times. Qubit mapping in this context is fundamentally an error optimization problem, yet typical platform tools and automated pipelines either lack actionable calibration integration or relegate the user to static device reports. Informed layout selection—especially for noise-susceptible chemistry workflows and structured ansätze—demands interactive, temporally aware, and vendor-extensible tooling. I-QMapper directly addresses these needs by introducing a new paradigm for quantum circuit layout design: an interactive Jupyter-based visual and analytical tool that couples error-aware placement with rich device diagnostics and full workflow integration for IBM Quantum backends (2606.27508).
Integrated Workflow and User Interface
I-QMapper's interface streamlines the process from backend selection to experiment launch. The connection panel supports vendor selection, account management, backend enumeration, layout workflow choice, and mapper initialization, all decoupled from credential handling, thereby conforming to established Qiskit practices. This workflow supports rapid device switching and session reproducibility.
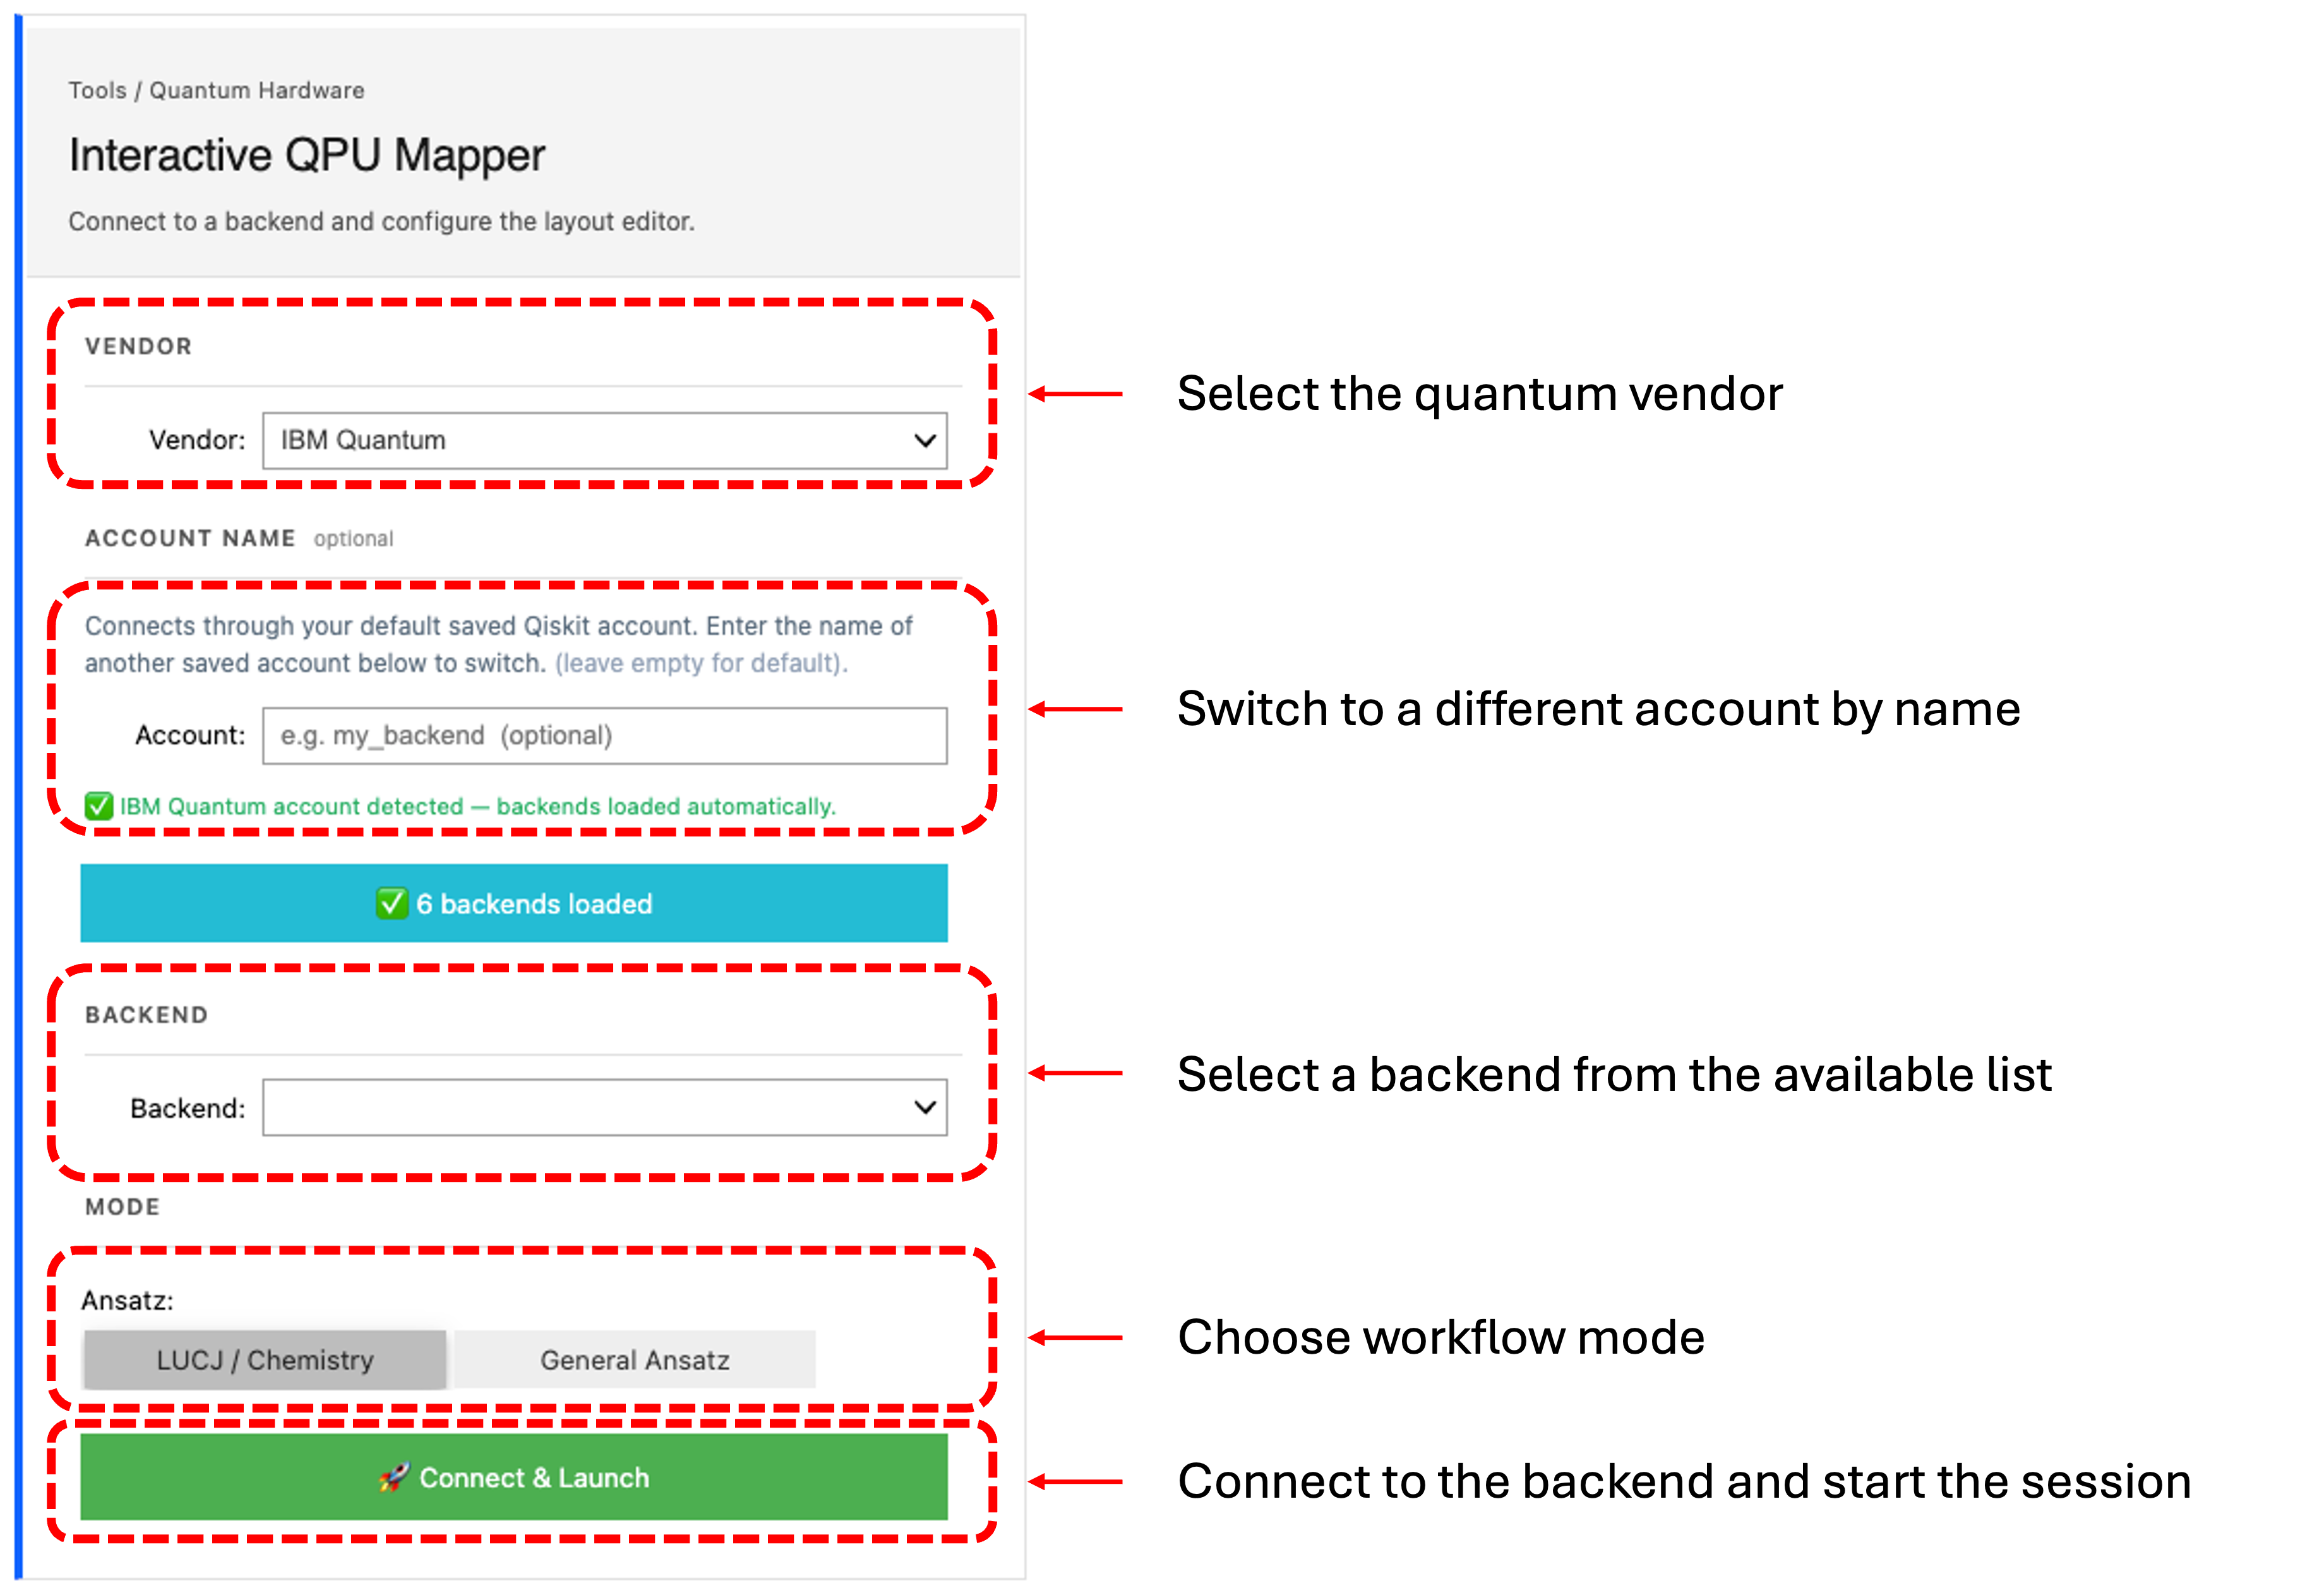
Figure 1: The connection panel encapsulates all device setup, backend selection, and experiment mode initialization into a coherent stepwise GUI aligned with Qiskit credentials management.
Design Mode exposes a comprehensive visualization environment for manual or automated qubit assignment, real-time feedback on layout quality, and custom circuit structure management. Hardware topology is displayed with native device coordinates as extracted from backend metadata, and the tool supports hardware-specific rendering for multiple IBM device families, such as the 156-qubit heavy-hex Heron and the 120-qubit Nighthawk.
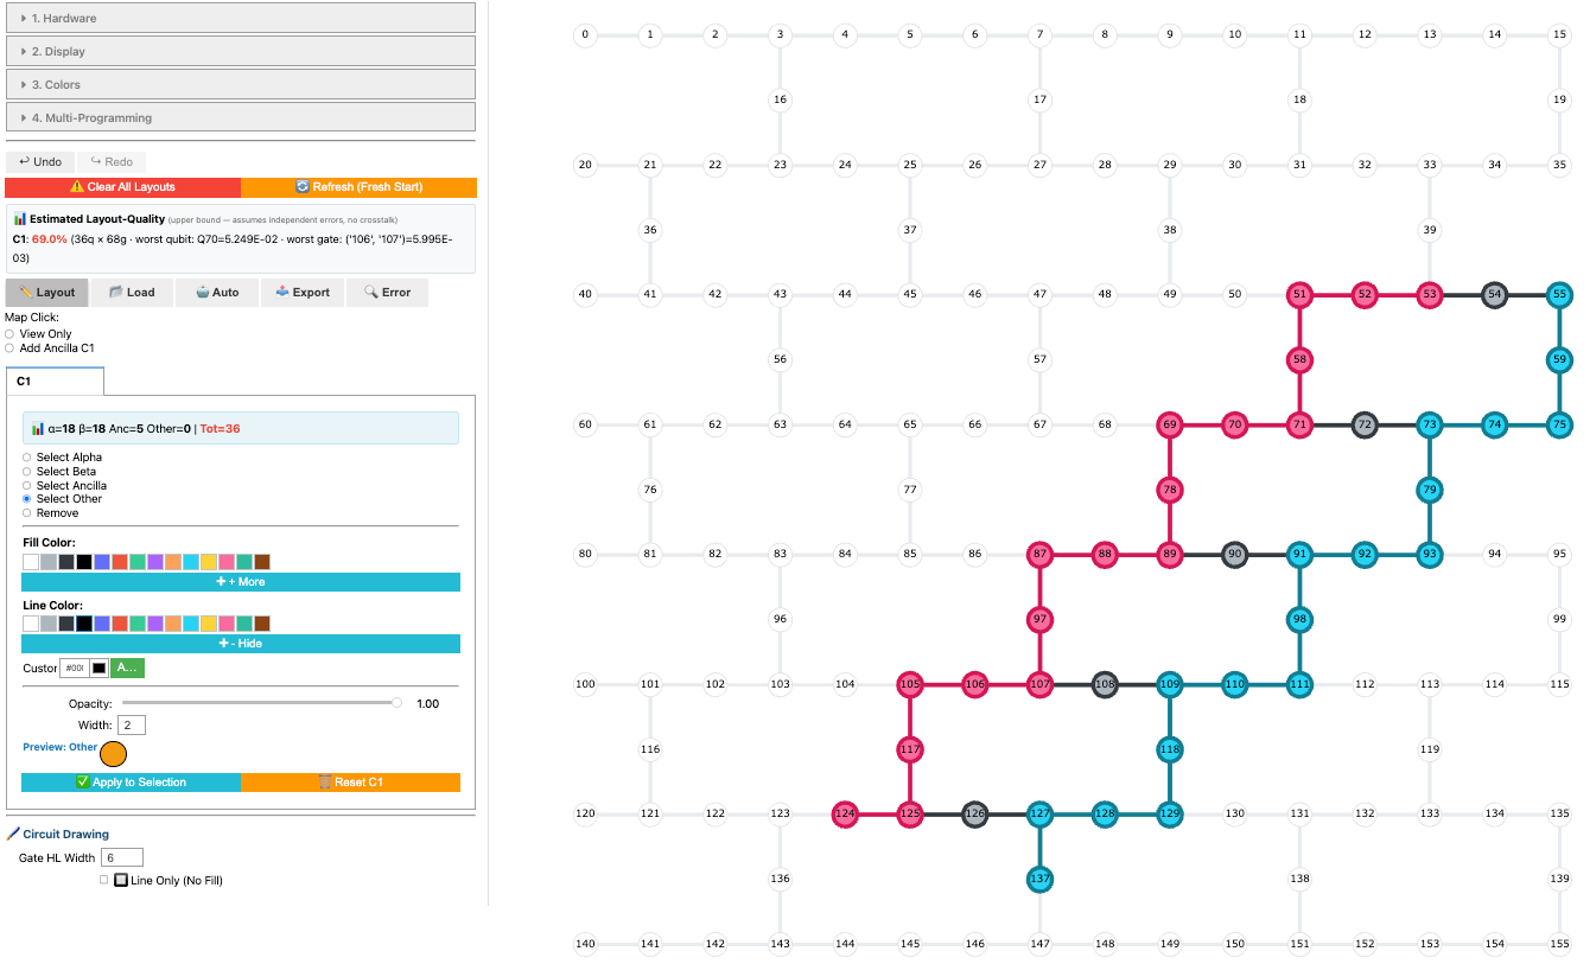
Figure 2: Design Mode showing device topology, circuit-aware layout assignment, real-time LQS feedback, and customizable visual styling organized in a modular sidebar.
The software architecture leverages ipywidgets for GUI components and Plotly for interactive visualization, with backend communication managed exclusively through Qiskit tools. Layouts and sessions are exportable in multiple formats for rigorous experiment reproducibility and downstream pipeline compatibility.
Error-Aware Layout Quality Metrics
The core innovation is the Layout-Quality Score (LQS), which synthesizes readout and two-qubit gate errors within the user-selected subgraph into a single interpretable scalar quantity. It is defined as
LQS=q∈Qlayout∏(1−εqro)×(qi,qj)∈Elayout∏(1−ε(qi,qj)2Q)
where Qlayout is the qubit subset, Elayout is the induced edge set, εqro denotes qubit readout errors, and ε(qi,qj)2Q is the physical gate error. LQS is updated in real time as the user edits the mapping. Aggregate scores are supplemented by identification of limiting elements (worst qubit/gate), making error bottlenecks immediately discoverable.
For structured chemistry applications, I-QMapper includes a domain-specific LUCJ workflow. Automatic layout search leverages device error maps and exposes the ensemble of valid embeddings, permitting expert selection based on both aggregate metrics and the user’s domain knowledge. Multi-programming support enables the distribution of multiple structured circuits onto a single device with optional separation buffers to mitigate intra-device crosstalk.
Temporal and Comparative Calibration Analytics
I-QMapper implements a robust backend calibration cache to support both real-time and historical device metrics acquisition. The GUI offers four temporal modes (Live, Snapshot, Intraday, Multi-day), with visualization and diagnostic tools for each.
Calibration displays are rendered as fully interactive QPU heatmaps, with distinct color channels for qubit and gate metrics, customizable color scales, and circuit-aware overlays for immediate quality assessment.
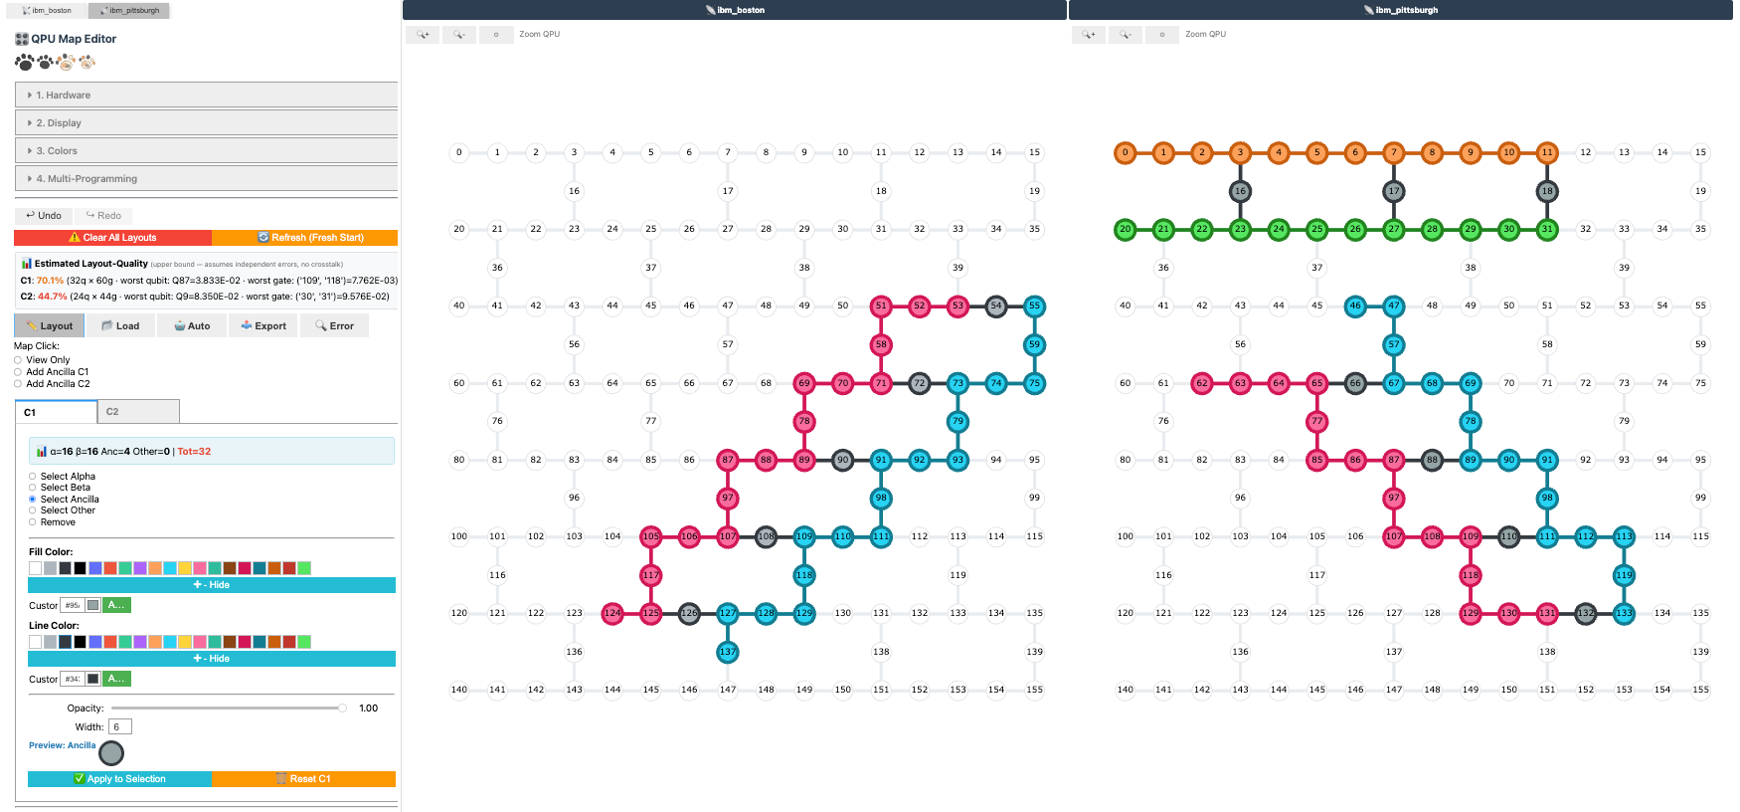
Figure 3: The QPU topology colored by calibration metrics, with layout-overlap highlighting to support intuitive error localization.
Delta-mode analysis enables differential calibration inspection, where error changes between temporal snapshots are encoded with diverging color scales, exposing device drift and identifying unstable elements. This is compatible with GIF/MP4 time-lapse export for detailed temporal post-mortem analysis.
The Analysis tab integrates multiple diagnostic modalities:
- Qubit Inspector: Aggregates all calibration properties of a selected qubit and its connected gates in real time.
- Trend Analysis: Plots time series for any property across chosen time windows, revealing instability or drift.
- Ranking Table: Orders qubits or gates by any selected metric, including coherence time and specific gate errors, driving informed choice based on operational priorities.
- Stable Finder: Identifies consistently high-quality elements across arbitrary time spans by enforcing a user-defined filter and minimum stability fraction.
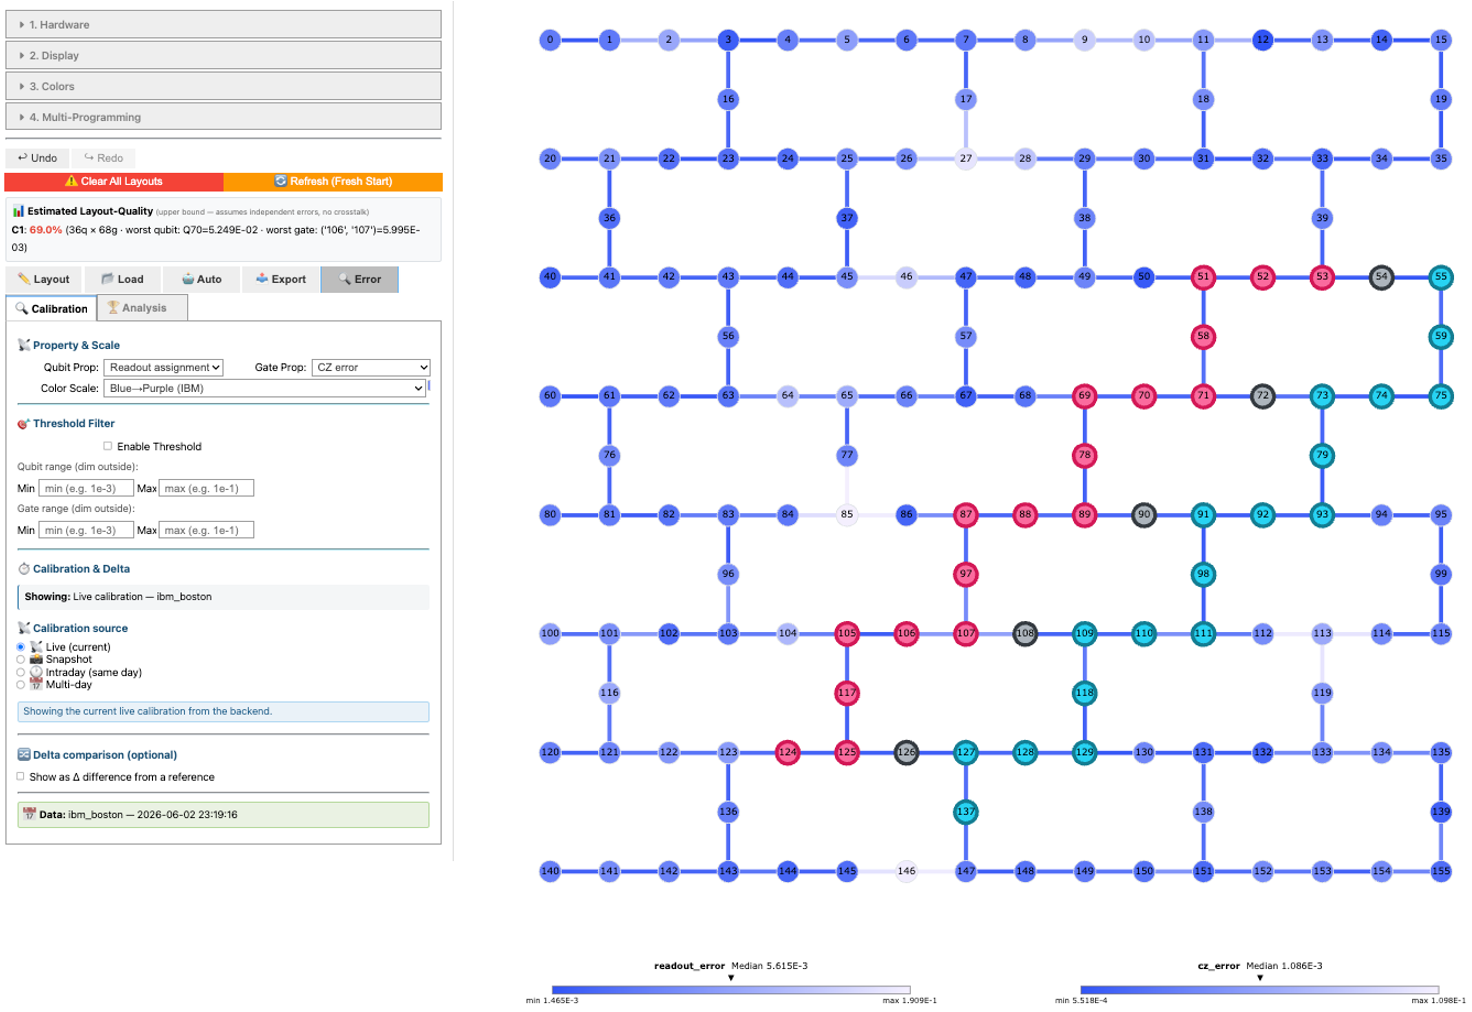
Figure 4: Diagnostic dashboard consolidates summary, trends, ranking, and stability analytics for rapid device assessment.
Together, these modules transcend snapshot-based device inspection, enabling longitudinal and comparative device characterization crucial for cross-run reproducibility and hardware-aware benchmarking.
Multi-Programming and Multi-Backend Capabilities
I-QMapper supports both intra-QPU and inter-QPU multi-programming regimes. The intra-QPU pipeline sequentially assigns multiple circuits to disjoint device subgraphs, with optional buffer regions to reduce crosstalk. Changes to any sublayout recursively trigger global re-optimization to preserve allocation consistency. The tool can also visualize and compare layouts and calibration landscapes of multiple devices side-by-side.
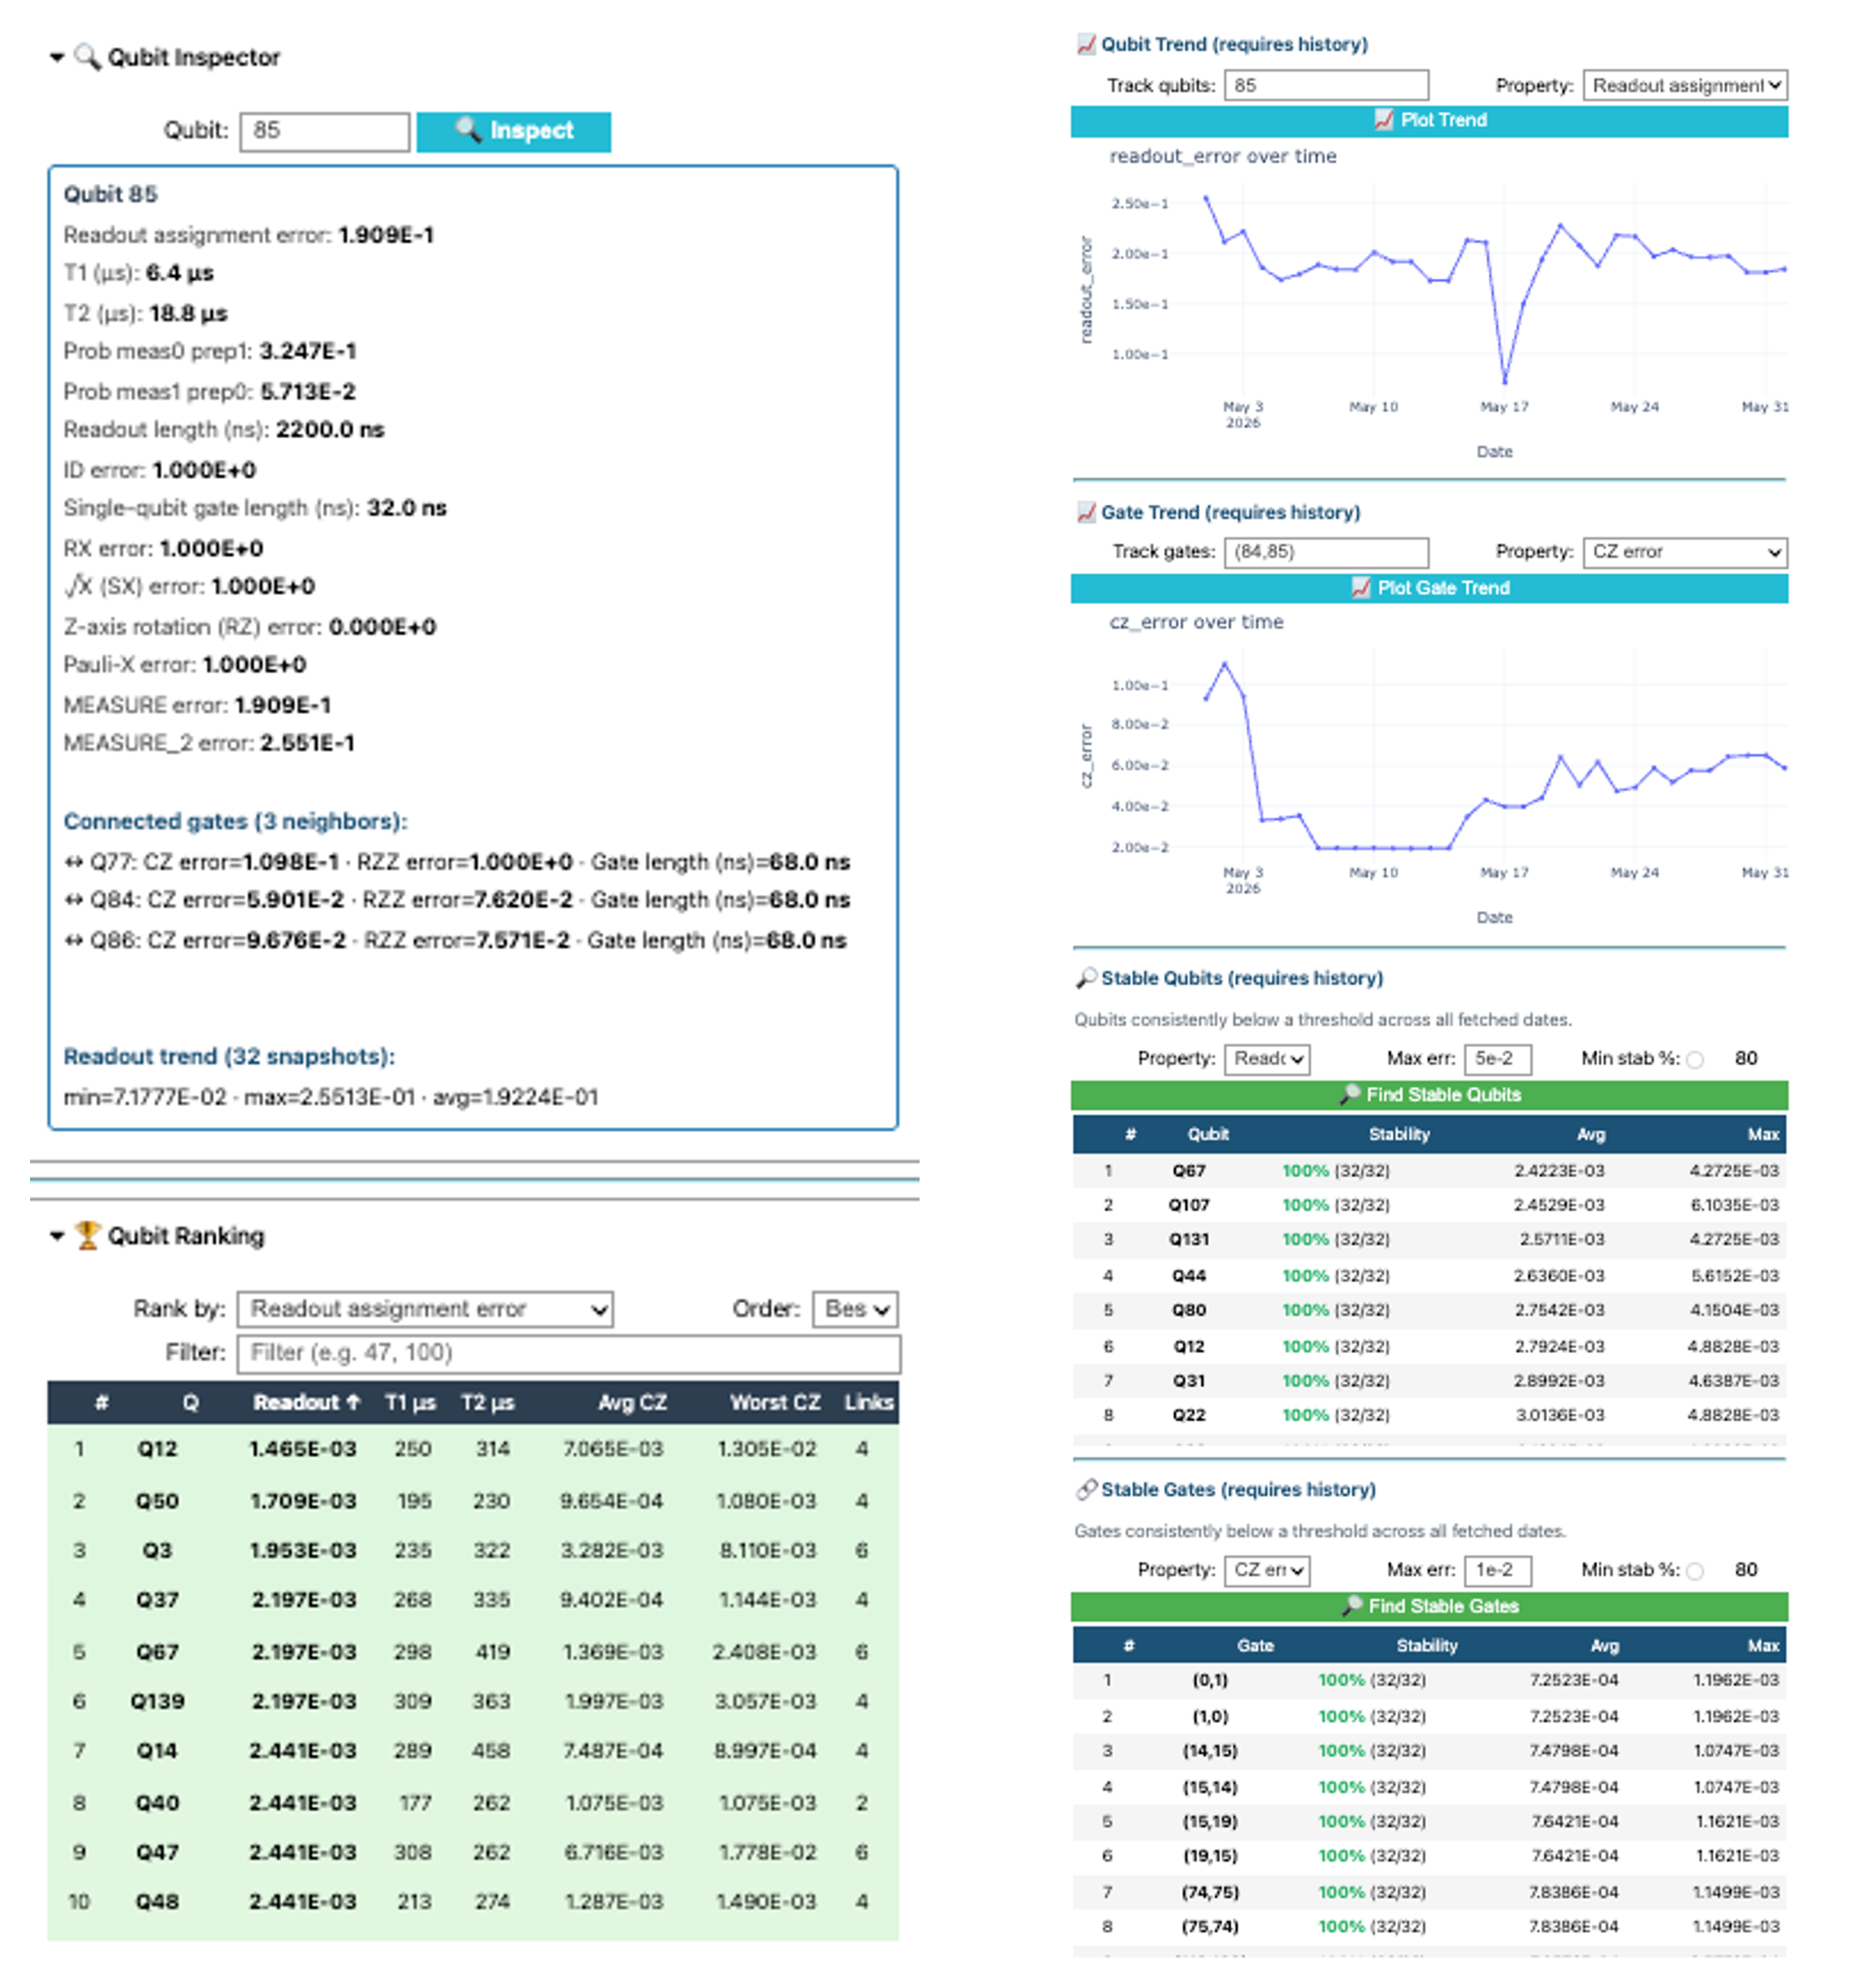
Figure 5: Layout comparison across two IBM Heron r3 backends, exemplifying both single- and multi-circuit placement regimes under distinct calibration profiles.
Implications and Future Directions
I-QMapper augments the quantum software stack by filling the "design-time" gap between static hardware-aware visualization and automated transpilation. The tool’s LQS framework lays groundwork for incorporating more general error models (including single-qubit gate errors and time-dependent drift priors), while the architecture is extensible for additional vendors and topologies. Integration with LSTM-based fidelity prediction [mao2025qfid], GNN-guided allocation [LeCompte2023], and crosstalk-aware compilers is a prospective extension. The platform's support for reproducible session export and real-time/historical analytics positions it at the center of robust, hardware-aware NISQ experimentation and benchmarking.
Conclusion
I-QMapper operationalizes device diagnostics and error-aware layout optimization within a unified, interactive environment. By integrating error metrics, temporal calibration analytics, and advanced diagnostic tooling with structured ansatz and multi-programming support, I-QMapper advances the practical deployment and benchmarking of quantum experiments on unstable NISQ hardware. The tool establishes an extensible framework for future calibration-aware, multi-vendor quantum workflow engines.

