- The paper demonstrates that maximizing the replication of simple dioptric spectrographs minimizes cost, volume, and risk while maintaining high performance.
- It employs analytical models to quantify the effects of detector format, binning, and optical configurations on spectral resolution, error propagation, and throughput.
- The study uniquely integrates an ecological metric into its trade-off matrix, highlighting sustainability alongside conventional engineering drivers.
Design Trade-Offs and Architectures for Wide-Field IFS at WST
Introduction
The paper "Guiding Design Choices for Wide-Field IFS: Trade-Offs Between Replication and Complexity for WST" (2606.19159) presents an exhaustive architectural study for the panoramic Integral Field Spectrograph (IFS) of the proposed 12-meter Wide-field Spectroscopic Telescope (WST). The authors systematically quantify key performance and engineering drivers—throughput, image quality, error propagation, volume, cost, and environmental sustainability—across a broad parameter space of spectrograph and detector architectures, exploiting both analytical models and preliminary optical designs. A core outcome is the formal resolution of the tension between many simple versus few complex replicated spectrograph units, incorporating an ecological metric—instrument carbon footprint—and rigorous consideration of contemporary detector technology readiness.
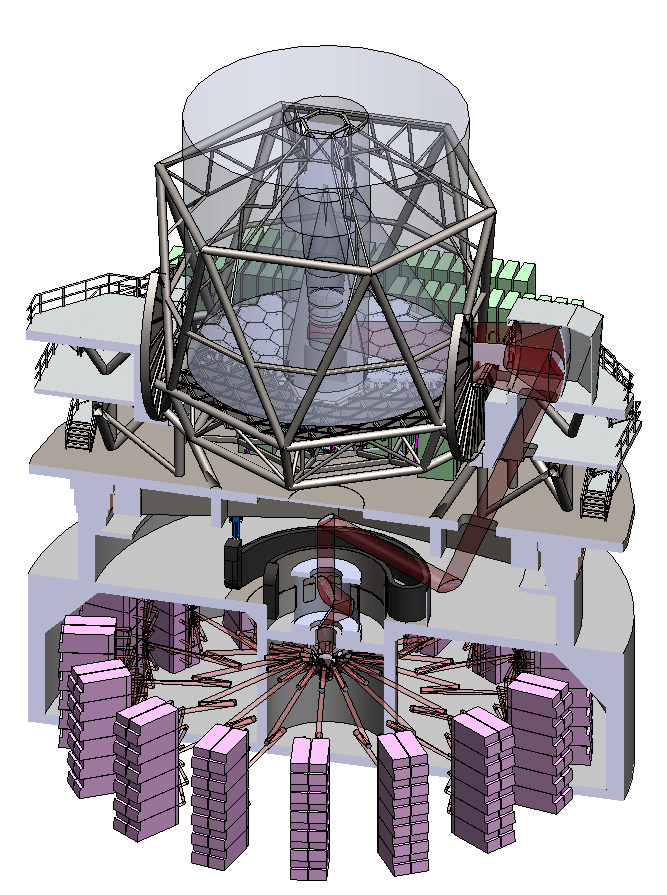
Figure 1: Cross-section of the WST facility layout, emphasizing the location and distribution of 192 IFUs and associated relays in the IFS system.
Trade-Off Methodology and Design Parameterization
The authors define a parameter space comprising detector pixel pitch, detector format, camera focal ratio, and spatial/spectral sampling. Two primary camera classes are considered: dioptric and catadioptric. Eight detector formats are evaluated, spanning pixel sizes (10–15 μm) and matrix dimensions (4k–9k), including binned variants, coupled with two spatial sampling regimes (square and rectangular spaxels). The parameterization directly informs the required number of spectrographs and the resultant geometric étendue per unit.
A central analytical result is that geometric étendue is a monotonic function of detector format and sampling, and serves as a first-order proxy for downstream design complexity (optical, mechanical, and financial). Increasing per-unit étendue decreases unit counts but exacerbates camera complexity and cost.
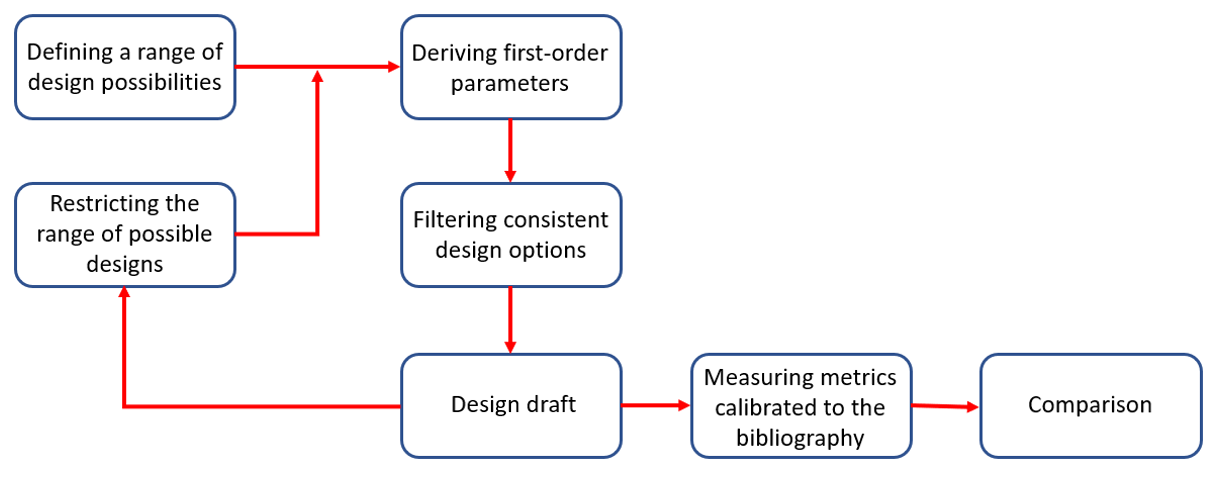
Figure 2: Flowchart illustrating the decision sequence for IFS spectrograph trade-offs, including primary design and filtering steps.
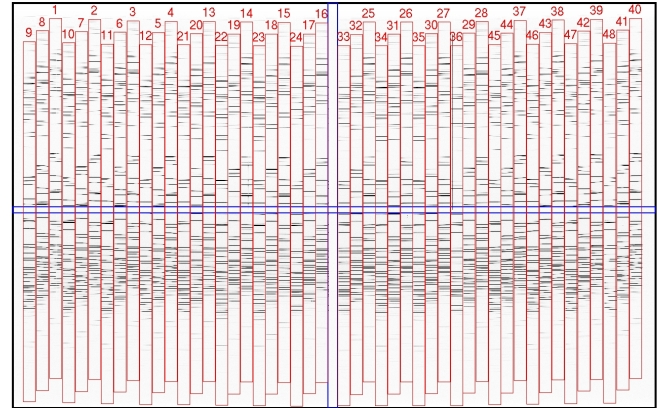
Figure 3: Layout of MUSE slitlet spectra on the detector, representative of IFS input pseudo-slits.
Throughput, Image Quality, and Spectral Resolution
Transmission optimization is achieved by balancing lens count (dioptric) against central obstruction (catadioptric). Analytical modeling constrains the allowable number of optical surfaces prior to throughput parity with obstruction-dominated architectures. The analysis systematically demonstrates that for detectors >60 mm, any incremental obstruction makes catadioptric designs uncompetitive; dioptric is unequivocally favored for large-format arrays.
Spectral resolution dependencies on detector format, binning, and sampling are mapped, establishing that 6k detectors with modest binning yield compliant performance margins, whereas 4k architectures require aggressive sampling, leaving no tuning flexibility.
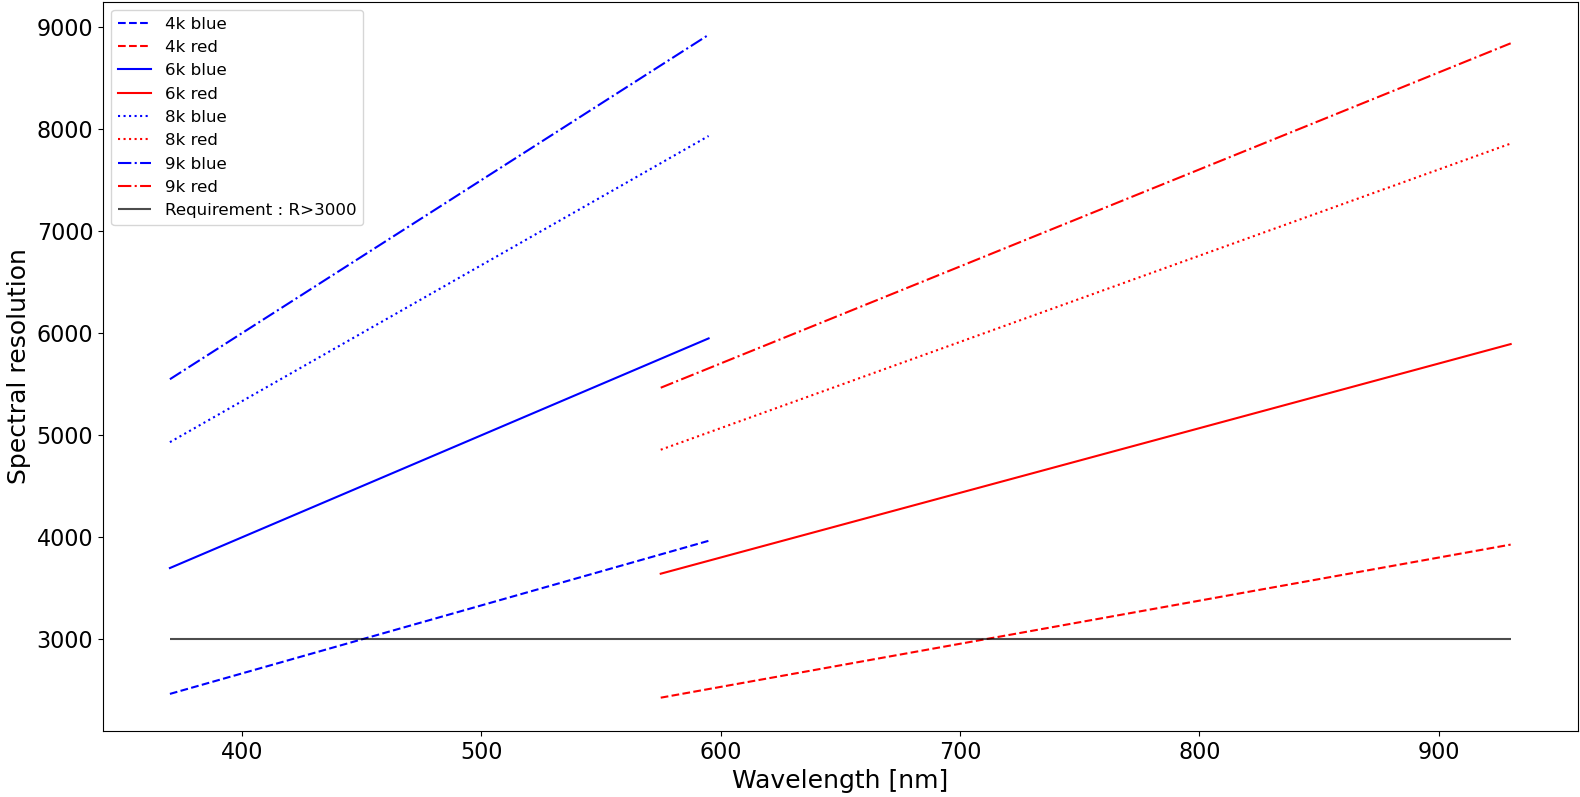
Figure 4: Spectral resolution across both arms as a function of pixel count along the dispersion axis, with sampling fixed at 2.4 pixels.
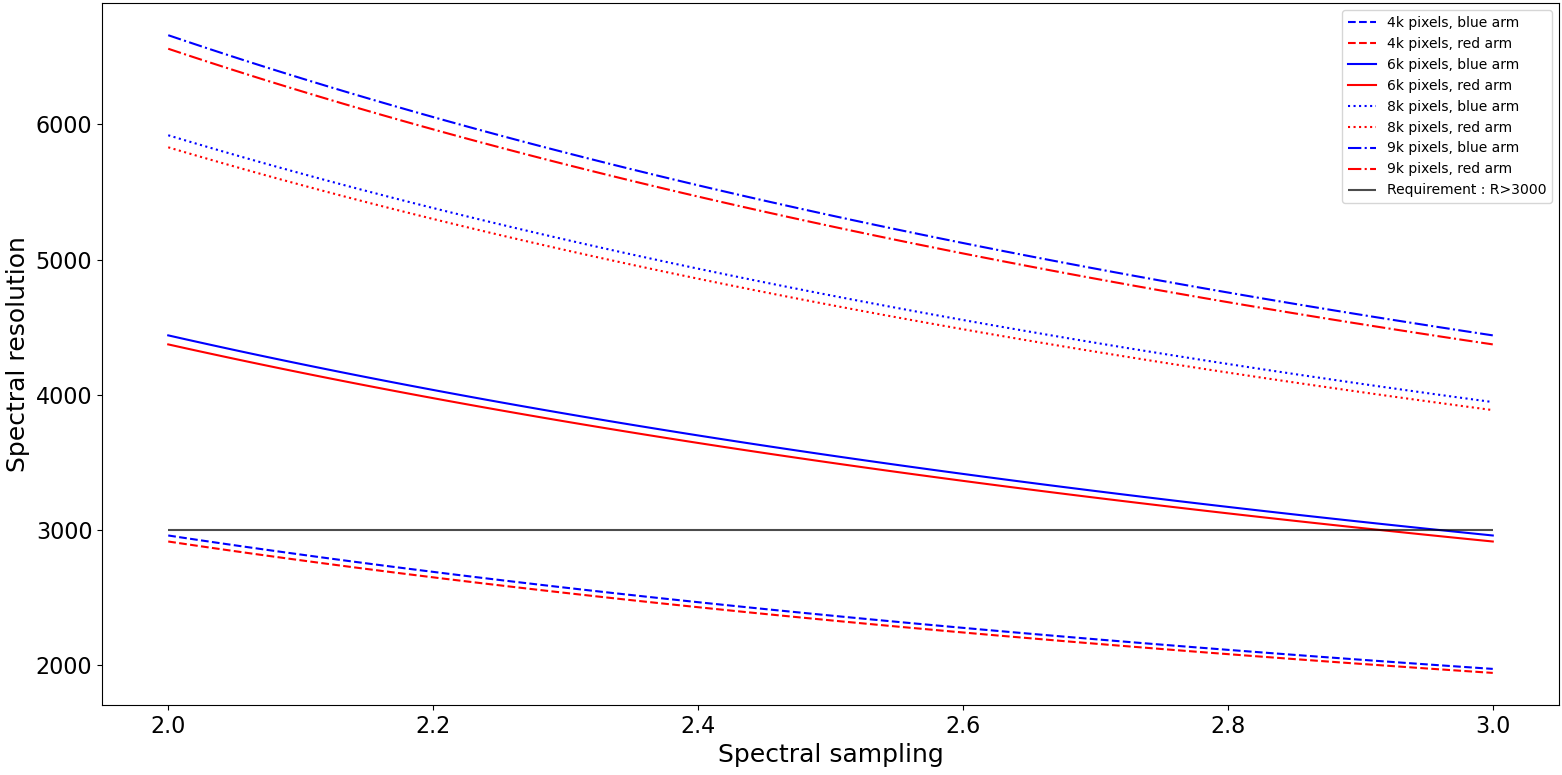
Figure 5: Spectral resolution at two reference wavelengths versus slit sampling, highlighting the design boundary imposed by the R > 3000 requirement.
Error Budgets
Quantitative error budgets are derived for both detector and spectrograph, with detector contributions (flatness, positioning, intrinsic PSF) shown to rise sharply at fast focal ratios. The analysis sets a practical lower bound of f/1.35; exceeding this pushes error budgets beyond MUSE-demonstrated reality and triggers intractable aberration correction complexity for the optics.
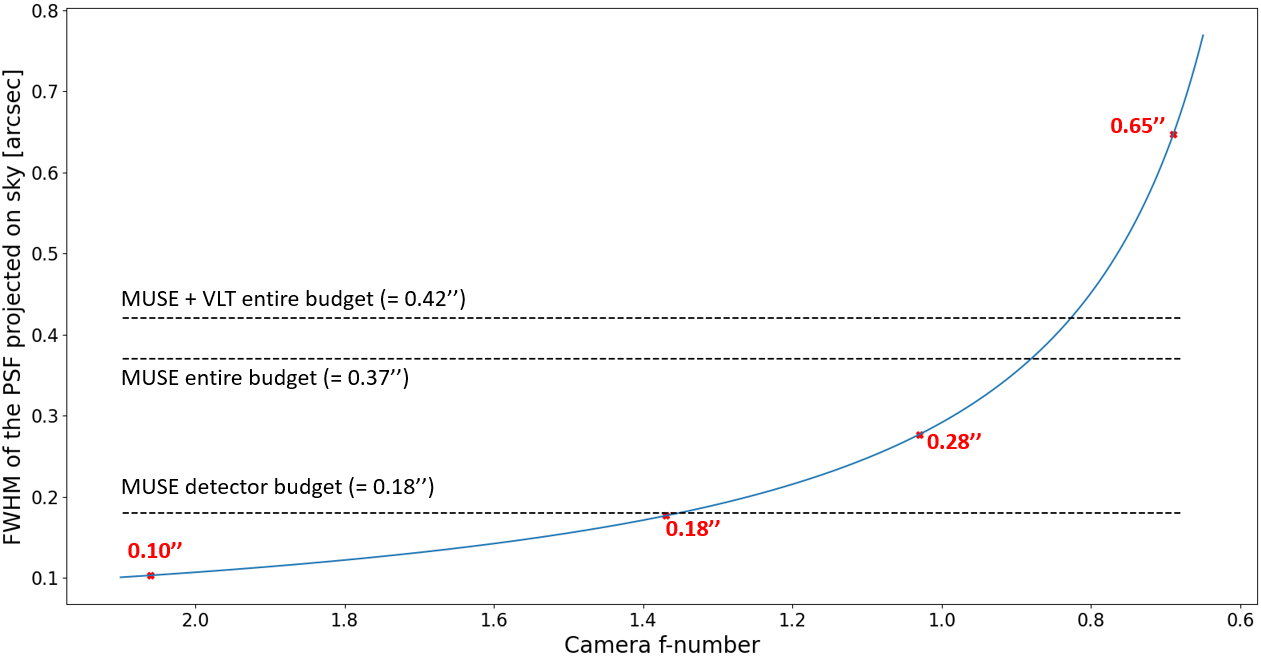
Figure 6: Detector error budget projected onto the sky as a function of camera f-number.
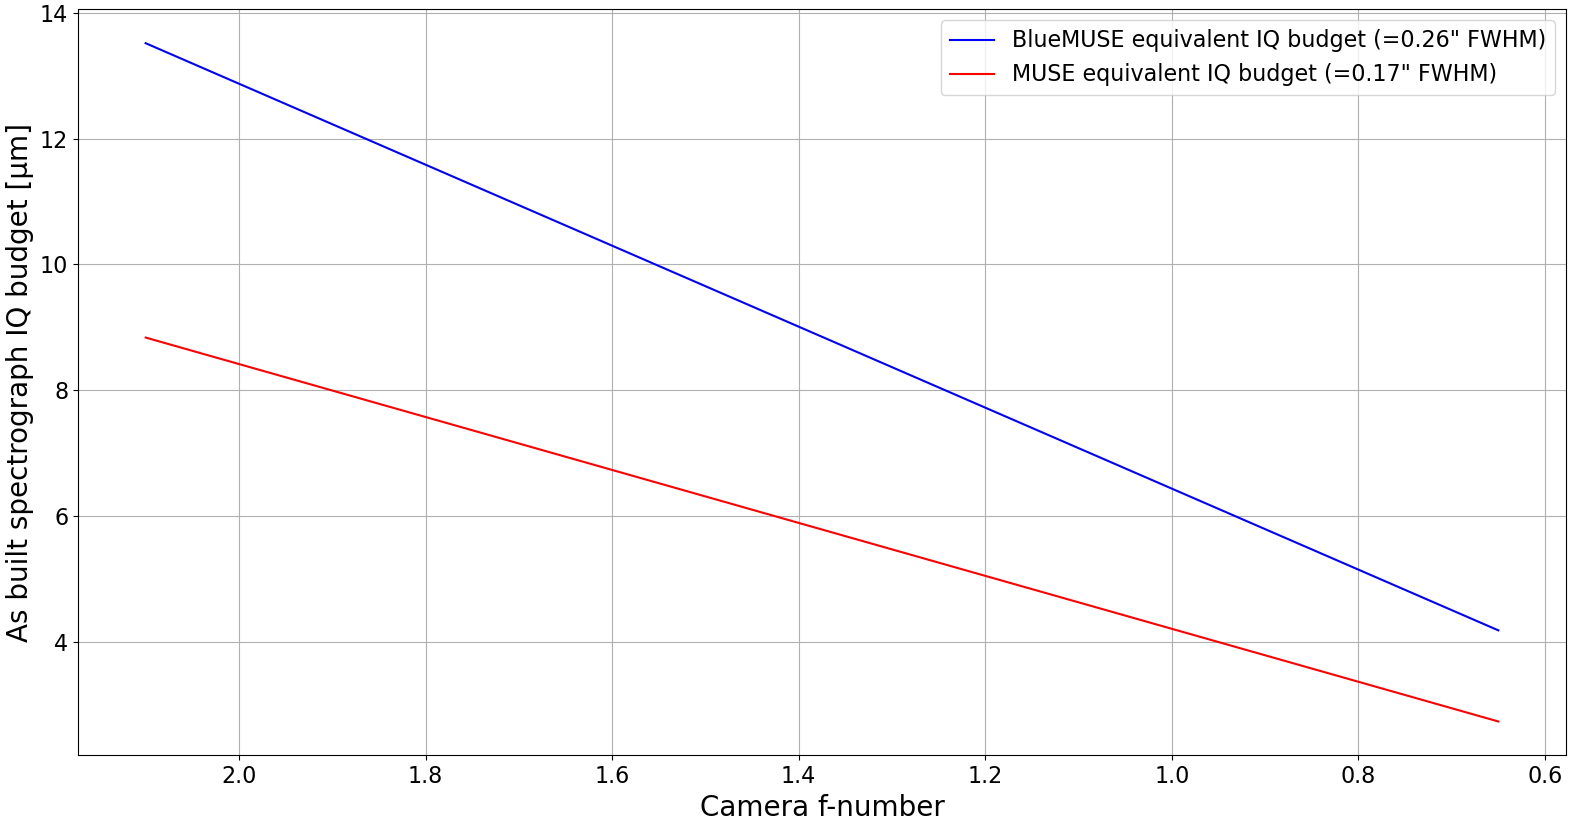
Figure 7: Spectrograph image quality budget for MUSE and BlueMUSE as a function of camera f-number, delineating complexity thresholds.
Volume and System Accommodation
A paraxial toy model, calibrated against existing IFSes, is leveraged to estimate per-unit and total system volumetrics. The steep non-linear growth in volume with optics diameter means that many small spectrographs collectively occupy less volume (and are easier to accommodate) than fewer large ones, inverting naïve expectations. This dictates practical limits for integration space, reinforcing the preference for high replication.
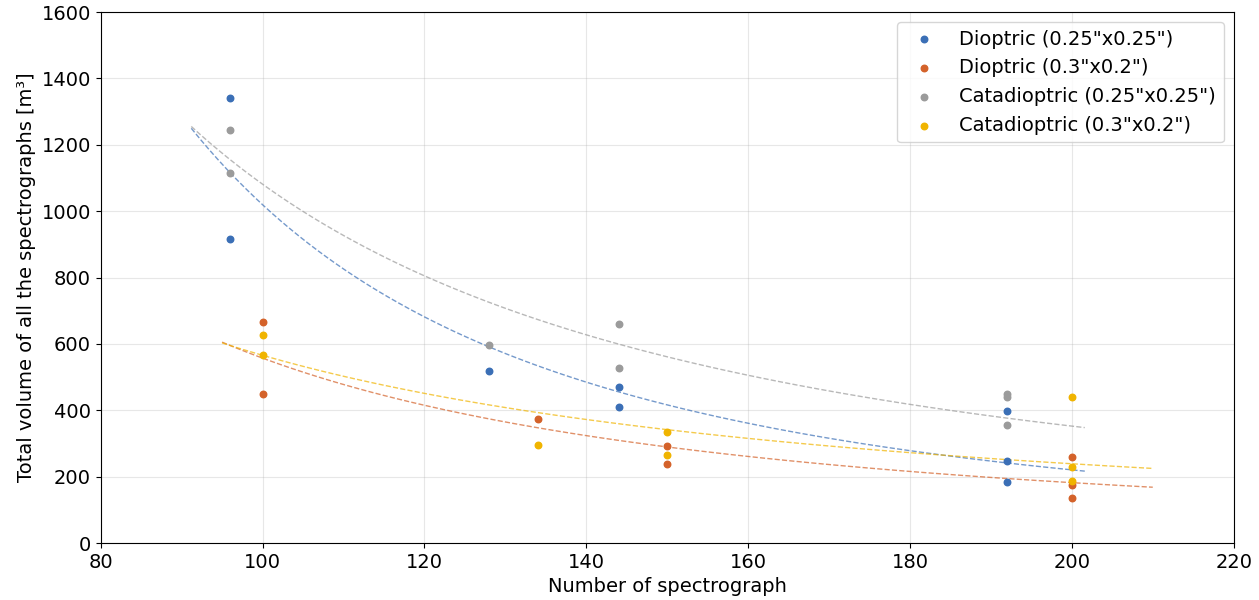
Figure 8: Aggregate spectrograph volume versus number of spectrographs, grouped by camera class and sampling.
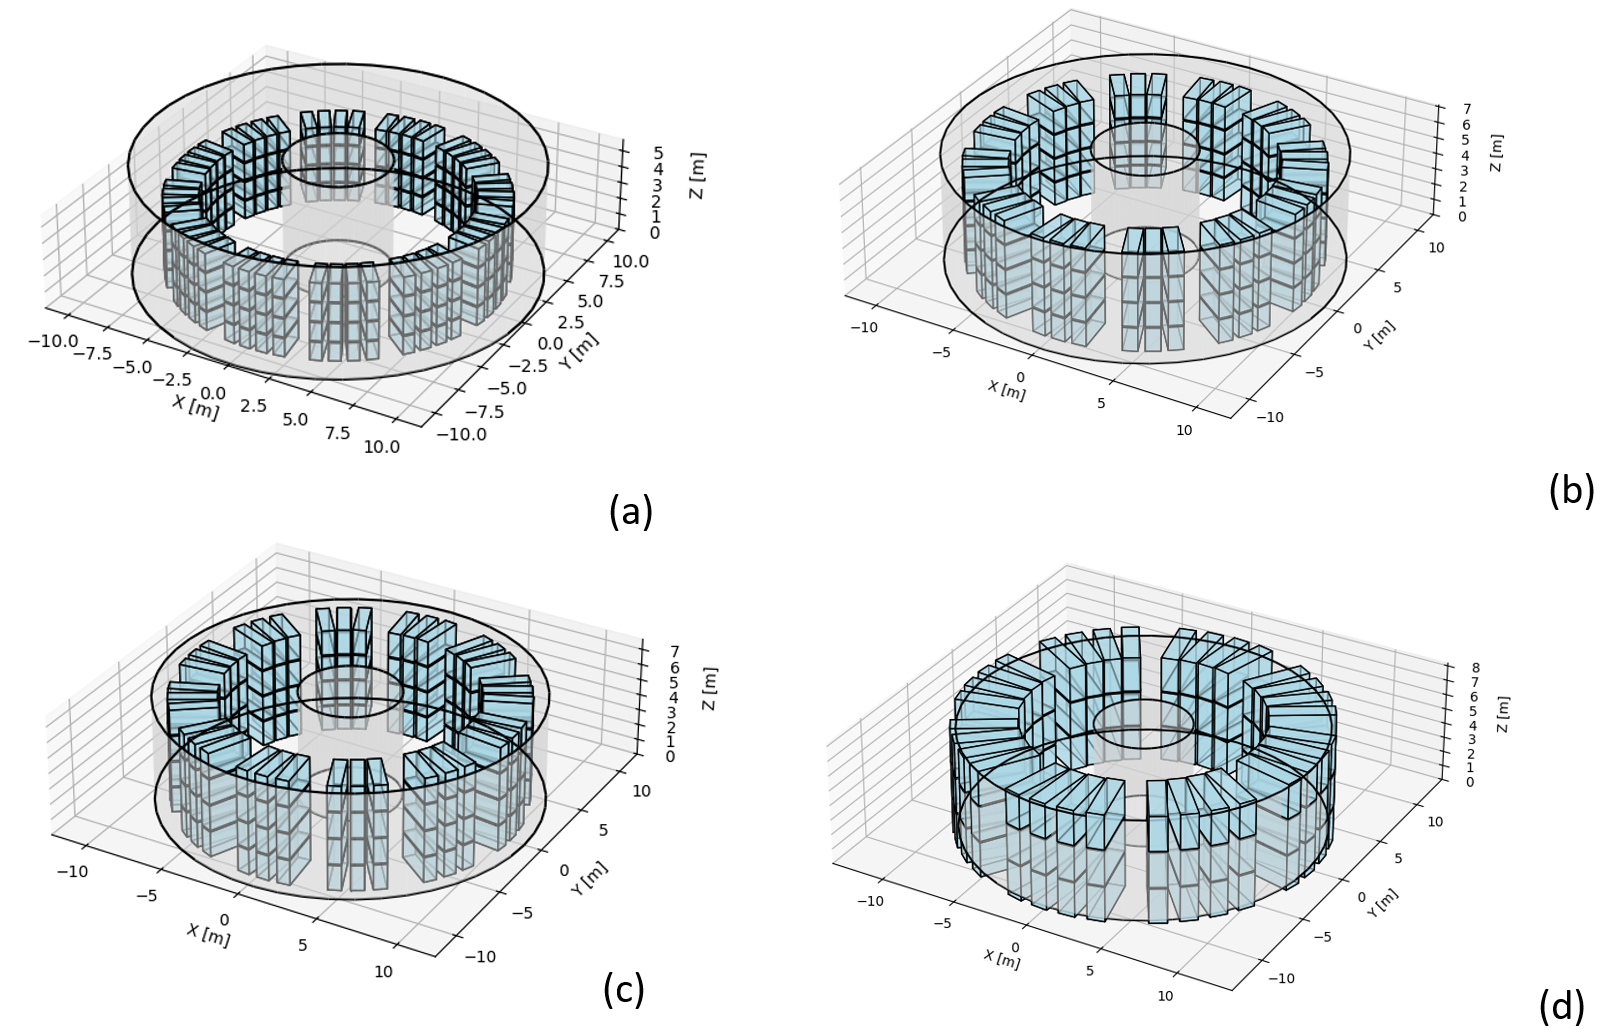
Figure 9: Renderings showing instrument room utilization for several representative design options.
Cost Modeling and Serial Effects
A cost framework is constructed from first-principle models, comprising TFU, a risk factor based on TRL, learning curve productivity gains, and inflation adjustment. Monte Carlo realizations account for uncertain model parameters. Results demonstrate that optics diameter scaling dwarfs reductions in unit count—more complex, fewer spectrographs always cost more. The learning curve enables strong cost amortization only in the regime of high replication.
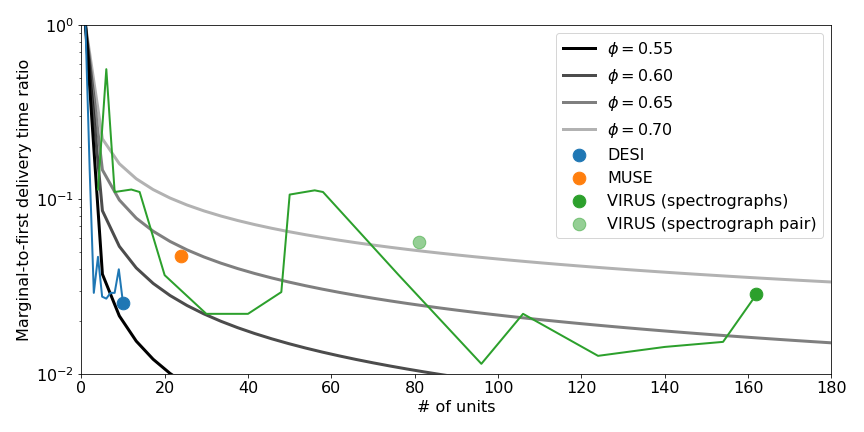
Figure 10: Empirical learning curves for recent spectrograph projects, illustrating productivity gains as a function of unit count.
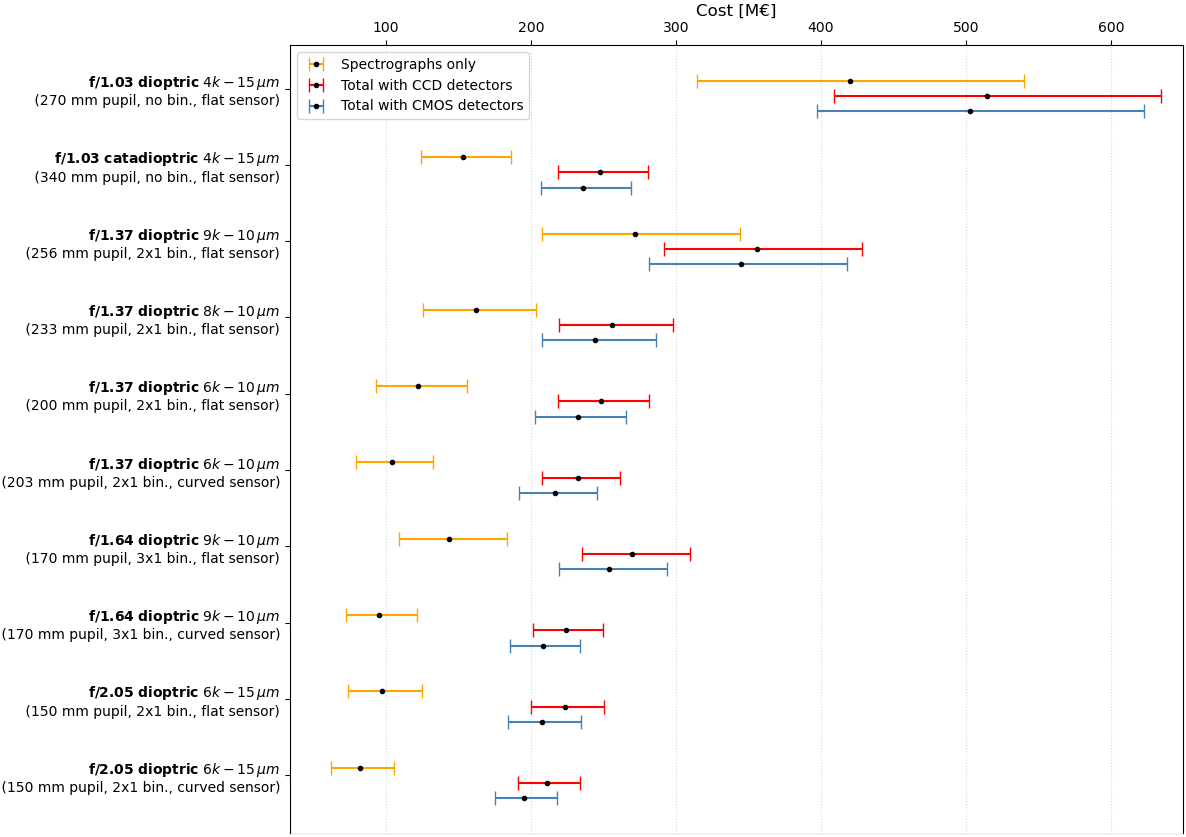
Figure 11: Monte Carlo-derived cost estimates for all viable architecture options, presented with confidence intervals.
Detector Technology and Curved Sensors
The analysis exposes detector technology as a critical uncertainty. High binning ratios demand CCDs for low effective read-noise; CMOSs without on-chip binning are not yet competitive. Options requiring extreme binning are therefore conditional on future CMOS advances or risk supply/cost constraints from a shrinking CCD market. The integration of curved detectors presents a clear technical pathway to lens reduction and throughput gains (2–2.5% per arm), as design models show. However, yield and cost risks associated with detector curving are incorporated in the final trade-off matrix.
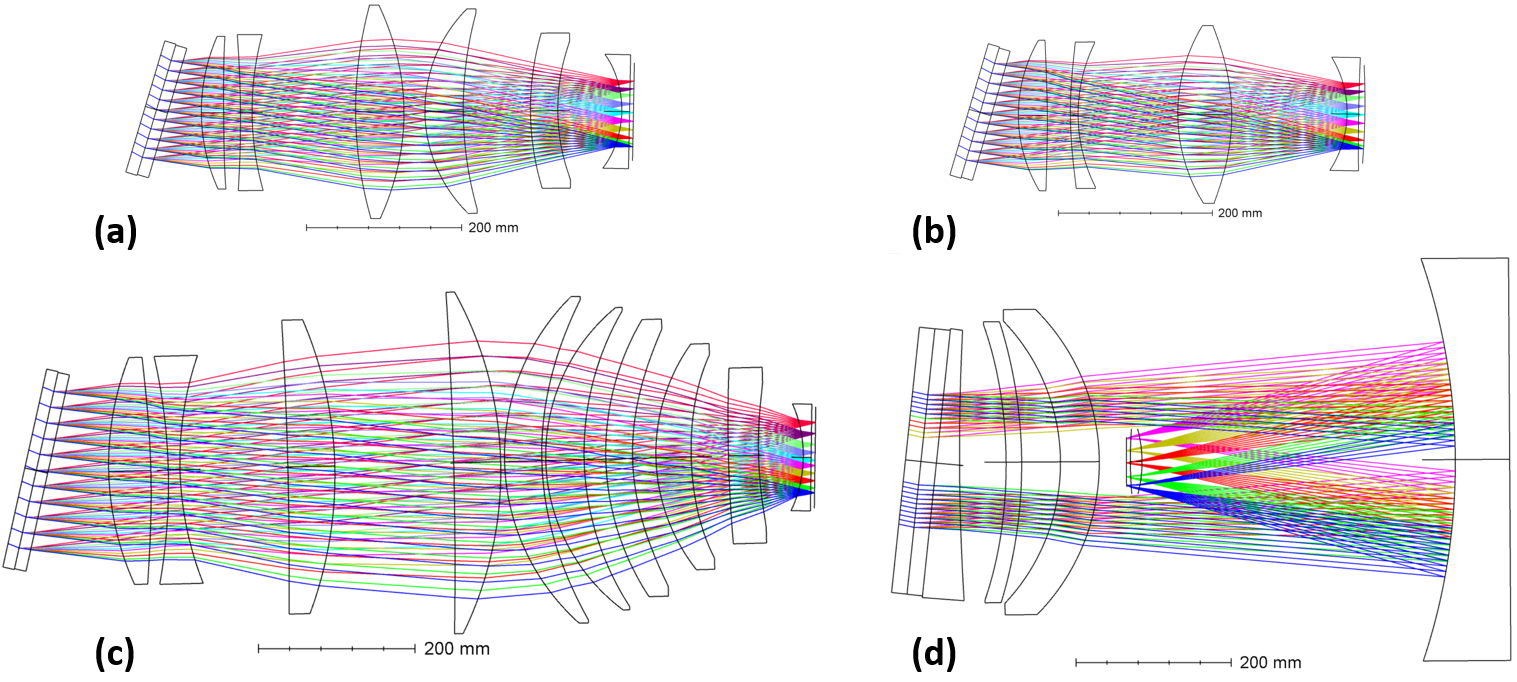
Figure 12: Comparative draft optical layouts for flat and curved detector camera assemblies across several architecture options.
Environmental Impact and Sustainability
Instrument carbon footprint is quantified using SimaPro for both construction and 20-year operations. The operational impact, dominated by detector and cooling power per unit, eventually surpasses the construction footprint for all reasonable lifetimes. Contrary to intuition, options with lower unit counts but less efficient detector/cooling technology can have higher total emissions than more numerous, CMOS-efficient architectures.
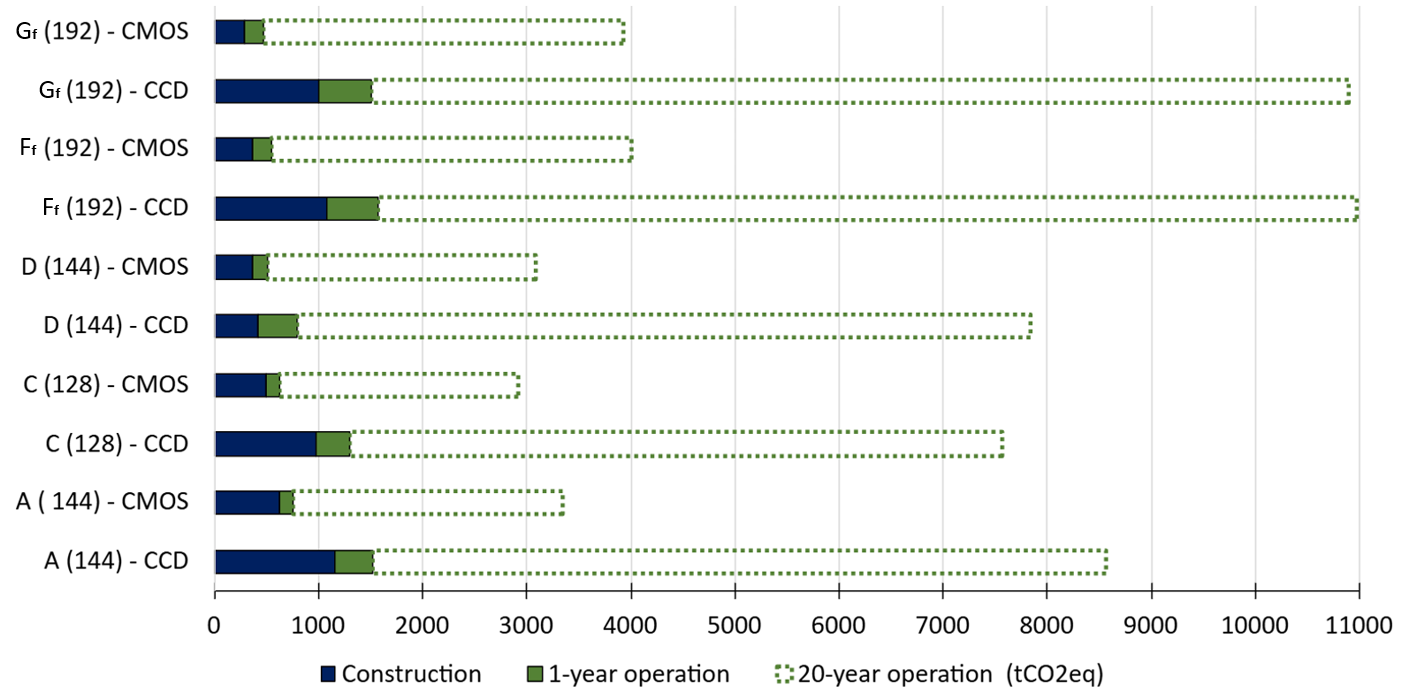
Figure 13: Comparison of construction and operational carbon footprints for design options with different detector/camera arrangements.
Synthesis: Trade-Off Matrix and Final Selection
A seven-criteria trade-off matrix, with cost/risk dominating (40%), aggregates all filtered design options. High-weight performance drivers are secondary, reflecting the dominant fiscal imperative of large-scale IFS projects. The results unambiguously favor designs with high replication (192 spectrographs) and moderate focal ratios, employing dioptric cameras and, where feasible, curved (toroidal/cylindrical) detectors. The three top-ranked configurations are:
- 6k-10μm, 2×1 binning
- 9k-10μm, 3×1 binning
- 6k-15μm, 2×1 binning
The 6k-15μm curved detector variant achieves the best global balance across cost, risk, performance, and sustainability.
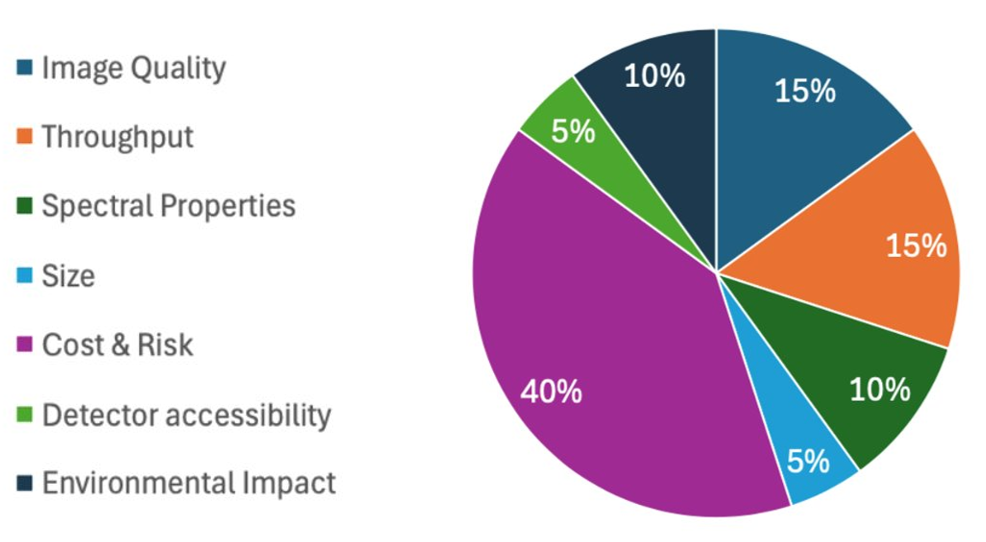
Figure 14: Weight distribution assigned to the seven criteria in the trade-off matrix underlying architecture ranking.
Theoretical and Practical Implications
The results have direct consequences for future wide-field IFS facility planning. Scaling analyses and empirical data converge on many simple units as a robust optimal, provided manufacturing and integration logistics are addressed. The findings strongly support incremental improvements in highly modular, MUSE/VIRUS-style architectures over speculative approaches that aim for major cost or volume breakthroughs through monolithic complexity. The deployment of curved detectors is technologically attractive, offering genuine system-level simplification and performance enhancement if manufacturing risk can be controlled. Conversely, the design is resilient to anticipated evolution in numerical aperture or field requirements, as primary drivers are not detector-limited but scaling-limited.
The study proposes a generalizable methodology for early-phase architecture filtering in large-scale spectroscopic instrumentation, with the inclusion of carbon footprint and serial-production effects providing a new dimension for decision-making. Future spectroscopic instruments, particularly for the upcoming ∼10-meter class survey facilities, should fully integrate mass manufacturing and environmental impact assessment into their design space exploration.
Conclusion
The comprehensive trade analysis for the WST IFS demonstrates that architectures predicated on maximal replication of simple, dioptric spectrographs with moderate focal ratio and compatible detector binning yield the most advantageous outcome in cost, throughput, volume, risk, and sustainability. The highest rankings are achieved by configurations that incorporate toroidal or cylindrical curved detectors, though fallback flat detector solutions remain viable if curving proves unfeasible. These results validate the prevailing consensus in recent IFS facility design and provide a robust framework for future optimization, with applicability extending to any high-multiplex astronomical survey facility seeking to maximize scientific return per euro and kilowatt-hour expended.