- The paper introduces Evaluation Cards, which systematically unifies fragmented AI evaluation reporting using a hierarchical rollout schema.
- It integrates benchmark metadata, evaluation run data, and model details through a canonical pipeline that resolves naming ambiguities and supports dual reader modes.
- Empirical findings reveal severe gaps in reproducibility and completeness, stressing the need for structured interpretive layers in AI evaluations.
Evaluation Cards: A Unified Interpretive Layer for AI Evaluation Reporting
Motivation and Positioning
The proliferation of AI evaluation results—across leaderboards, model cards, benchmark papers, and industry blogs—has given rise to a fragmented ecosystem lacking standard reporting conventions, making systematic comparison, reproducibility, and interpretability of evaluation results difficult. Current reporting artifacts and infrastructure address only partial segments of the evaluation lifecycle, rarely providing mechanisms for aligning metadata, evaluation run data, and benchmarking context into a unified, accessible, and traceable record. Most reporting standards lack dynamic, audience-adaptive interpretive layers and are not operationalized with large-scale extraction pipelines. "Evaluation Cards: An Interpretive Layer for AI Evaluation Reporting" (2606.09809) confronts these challenges by introducing a structured, extensible, and integrated reporting mechanism, capable of granular aggregation and actionable interpretive signaling.
Framework and Rollout Hierarchy
The central contribution of the paper is Evaluation Cards, a reporting schema derived from a systematic review of 52 papers and 12 stakeholder interviews. The framework distinguishes between artifact-side and process-side reporting, focusing on structured documentation fields most likely to be present in published artifacts without mandating exhaustive process traceability that could hamper adoption.
Evaluation Cards replace the flat (model, benchmark, score) paradigm with a five-level "rollout hierarchy," providing explicit stratification—Family → Composite → Benchmark → Split → Metric—that enables fine-grained traceability and avoids label collision, setup ambiguity, and metric conflation.

Figure 2: The rollout hierarchy for the Artificial Analysis composite, disambiguating 15 benchmarks in a nested structure.
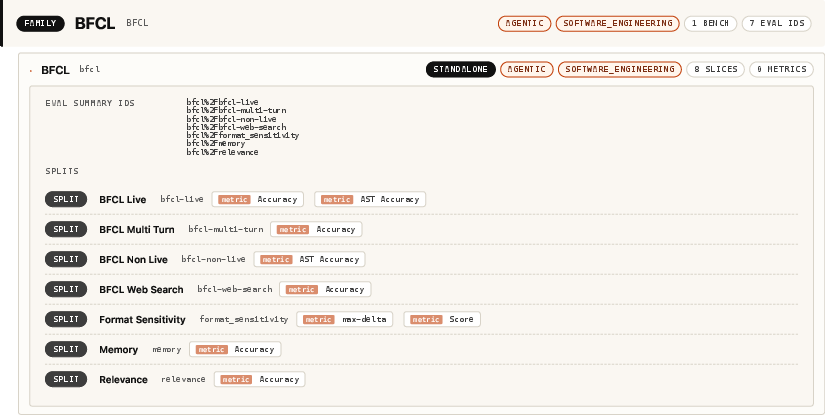
Figure 4: The rollout hierarchy for the BFCL benchmark, revealing the internal split structure (eight splits).
This hierarchical approach ensures every score is associated with its full context, supporting both top-down aggregation and bottom-up disambiguation. It prevents score fragmentation due to naming variability and underlies all subsequent signal computations.
Pipeline Integration and Operational Schema
Evaluation Cards operationalizes its schema by integrating three canonical data sources:
- Benchmark metadata (Auto-BenchmarkCards [hofmann2026auto]): Auto-extraction and validation of benchmark details, limitations, risk categorization, and taxonomies.
- Evaluation run data (EEE [Batzner*2026-qj]): Standardized per-run metadata, including harness, generation configuration, and provenance metadata.
- Model metadata: Normalized identifiers, developer, release date, and parameterization cross-referenced from curated data catalogs.
A dedicated canonicalization layer resolves aliases and versioned identifiers, addressing fragmentation in model and benchmark naming.
The backend pipeline consists of staged transformation, standardization, and enrichment, culminating in six canonical warehouse views and dual output reader modes for technical and policy consumption.
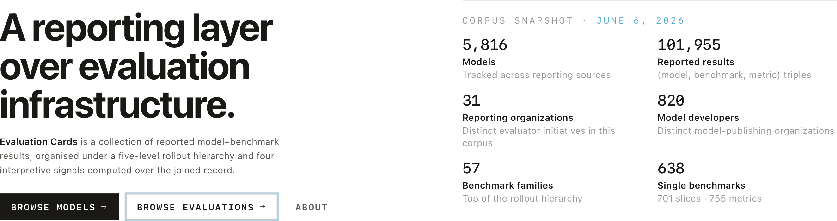
Figure 6: Corpus-level aggregation of the four interpretive signals across 5,816 models and over 100,000 evaluations.
Interpretive Signals
Evaluation Cards surface four primary integrity signals:
- Reproducibility: Indicates whether minimal configuration required to rerun an evaluation (temperature, max_tokens, harness, agentic parameters) is present. Signals are computed over (model, benchmark, metric-path) triples and flagged at row, model, and corpus levels.
- Completeness: Measures per-benchmark schema coverage (28 fields), distinguishing basic reporting from schema/operational completeness.
- Provenance: Tracks whether a result is first-party, third-party, or collaborative, and propagates annotated risk types to the evaluation summary.
- Comparability: Flags variant-dependent and cross-party score divergence (threshold >5% of metric span), surfacing non-uniform reporting and disincentivizing over-aggregation across setups or sources.
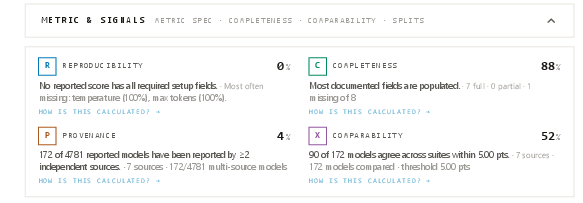
Figure 8: UI rendering of interpretive signals for an evaluation row, visualizing reproducibility, completeness, provenance, and comparability.
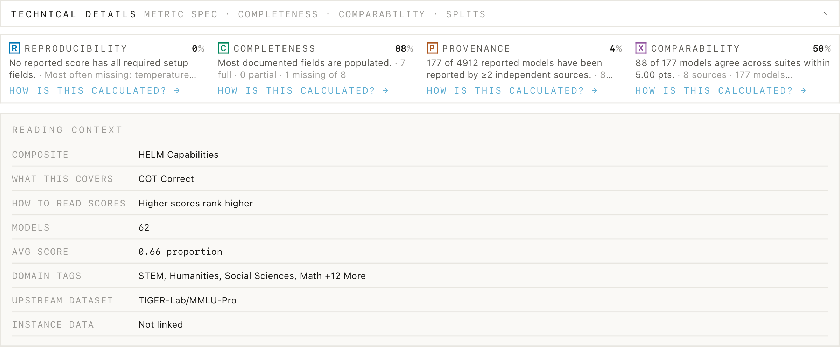
Figure 10: Detailed interpretive signals panel rendering all four signals and metric details for a benchmark entry.
These signals are rendered via user-adaptive reader modes. The research mode surfaces granular field-wise missingness, metric specification, and concrete configuration, while summary mode presents plain-language, risk- and provenance-focused caveats for policy actors.
Empirical Findings
Applying Evaluation Cards over a corpus of 5,816 models, 635 benchmarks, and approximately 102,000 reported results produces several quantified observations:
- Reproducibility: 96.5% of result triples lack key fields in the minimal reproducibility schema; the gap is most pronounced in first-party reporting (0.0% field population versus 16.6% in third-party reports).
- Completeness: Median benchmark-level completeness is only 10.7% against the schema; population rates for core documentation are below 20% for most fields not directly related to raw score reporting.
- Provenance/Comparability: 98.2% of (model, benchmark) pairs are observed from a single reporting party. In the rare case of multi-party reporting, more than half (51.9%) exhibit >5% cross-source score divergence.
These highlight a systematic deficit in both baseline reproducibility and cross-source comparability—especially acute in agentic and general benchmarks, which are most relevant for deployment decisions and risk assessments.
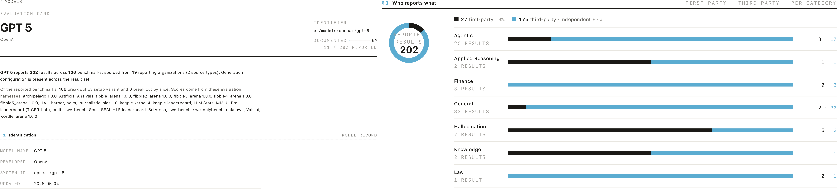
Figure 12: Model-level breakdowns for GPT-5, visualizing identification metadata, and distribution of first-/third-party evaluation coverage by benchmark topic.
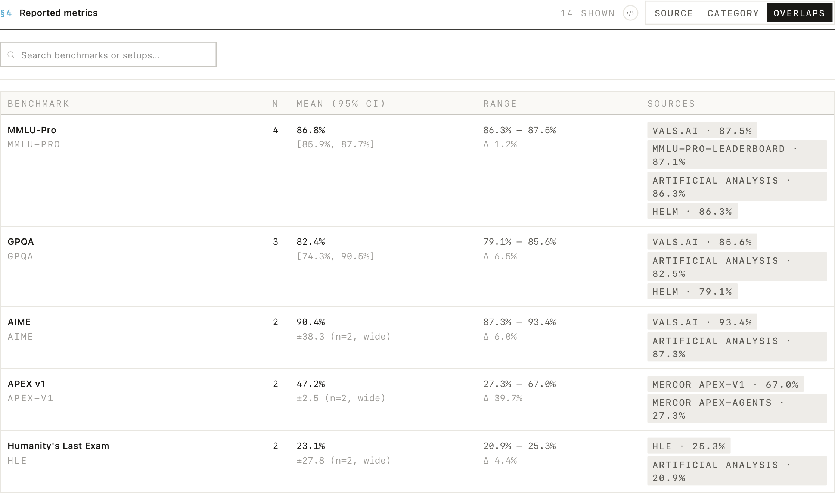
Figure 14: Cross-source divergence for GPT-5, providing direct per-source score ranges and contextual divergence.
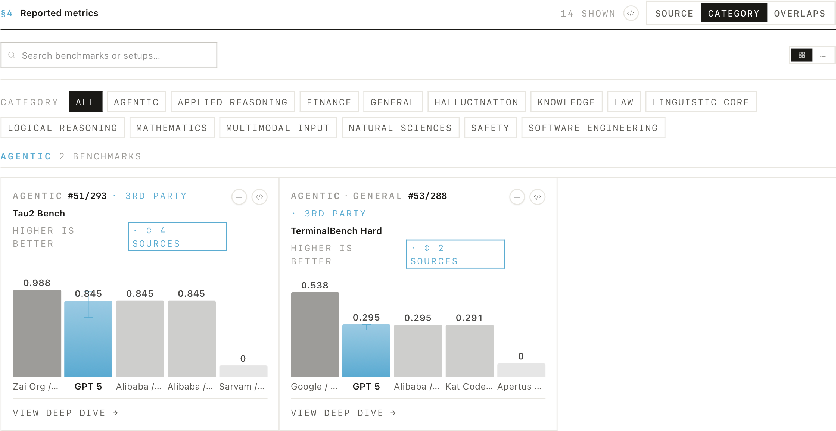
Figure 16: Comparative model-per-benchmark visualization for the category view, showing intra-source and inter-model distributions.
For high-value benchmarks such as MMLU-Pro, 98% of reported results lack the generation config for reproducibility, and inter-source divergence can exceed 40 points in comparable settings.
Policy Relevance, Community Model, and Extensibility
Evaluation Cards introduce a live, participatory open-source model, exposing all infrastructure, schema, and code publicly, and formalizing open governance for schema evolution, signal calibration, and interface adaptation. Integration with major platforms (e.g., Hugging Face, CAISI, AISI, etc.) and harmonization with other documentation artifacts (Model Cards, BenchmarkCards, Audit Cards) is in progress. The governance protocol is adapted to operationalize sustainable schema extension, backward-compatible versioning, and conflict resolution.
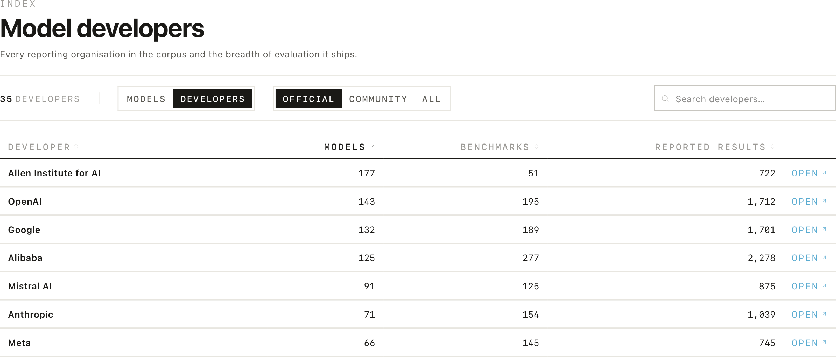
Figure 7: Developer-level view, enumerating organizations by number of reported models and benchmarks.
The pipeline supports extension to longitudinal trend tracking, benchmark contamination control, and non-LLM modalities.
Implications and Limitations
Practical Implications: Evaluation Cards supply downstream stakeholders with a direct instrument for interpreting, auditing, and comparing evaluation claims in deployment, governance, and regulatory contexts. The empirical quantification of widespread gaps in reproducibility and completeness indicates that score reporting is not, in general, a reliable proxy for model evaluation rigor or actionability without structured interpretive context.
Theoretical Implications: The findings substantiate the assertion that evaluation is a measurement science requiring robust documentation, provenance, and adaptive interpretive infrastructure. Flat reporting and static schema proposals are insufficient for addressing actionability gaps in the LLM evaluation lifecycle.
Future Directions: Extensions include:
- Richer process-side protocol documentation integration (e.g., linking with PREP-Eval preregistration).
- Automated detection and surfacing of benchmark contamination risks.
- Expansion to coverage of non-English benchmarks and non-LLM or multimodal models.
- Calibration of comparability thresholds and more granular uncertainty quantification (including error bar propagation [miller2024errorbars]).
Known limitations include source coverage bias (overrepresentation of English and frontier models), reliance on voluntary and extractable metadata, and a current focus on LLMs.
Conclusion
Evaluation Cards instantiate a scalable, schema-extensible, and community-adaptable interpretive layer on the fragmented AI evaluation reporting ecosystem. By systematically composing metadata, evaluation run data, and model context, and surfacing structured integrity signals via both technical and non-technical reader modes, Evaluation Cards enable actionable and trustworthy comparison of model claims, support regulatory and deployment readiness, and set a new baseline for rigor in public AI evaluation reporting.

Figure 18: Evaluation Card summary UI, exemplifying the policy-facing summary with benchmark goals, known issues, and interpretive caveats.
Figure 1: Policy note summary interface illustrating plain-language documentation of benchmark information for non-technical stakeholders.
The extensibility, quantifiability, and multi-view monitoring introduced by Evaluation Cards are expected to drive improved reporting standards and facilitate the evolution of responsible AI evaluation at scale.