WorldBench: A Challenging and Visually Diverse Multimodal Reasoning Benchmark
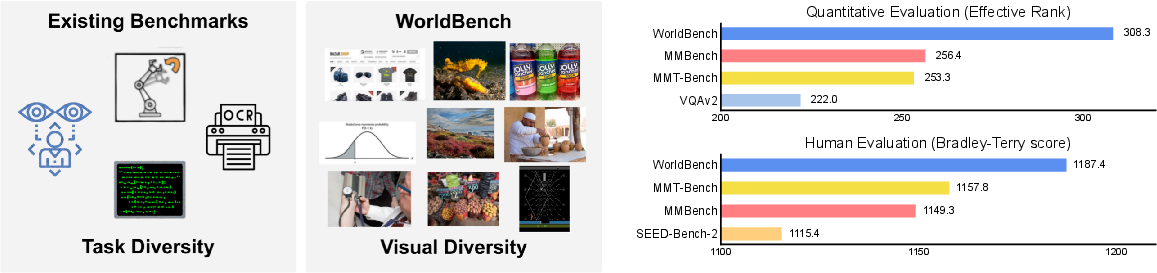
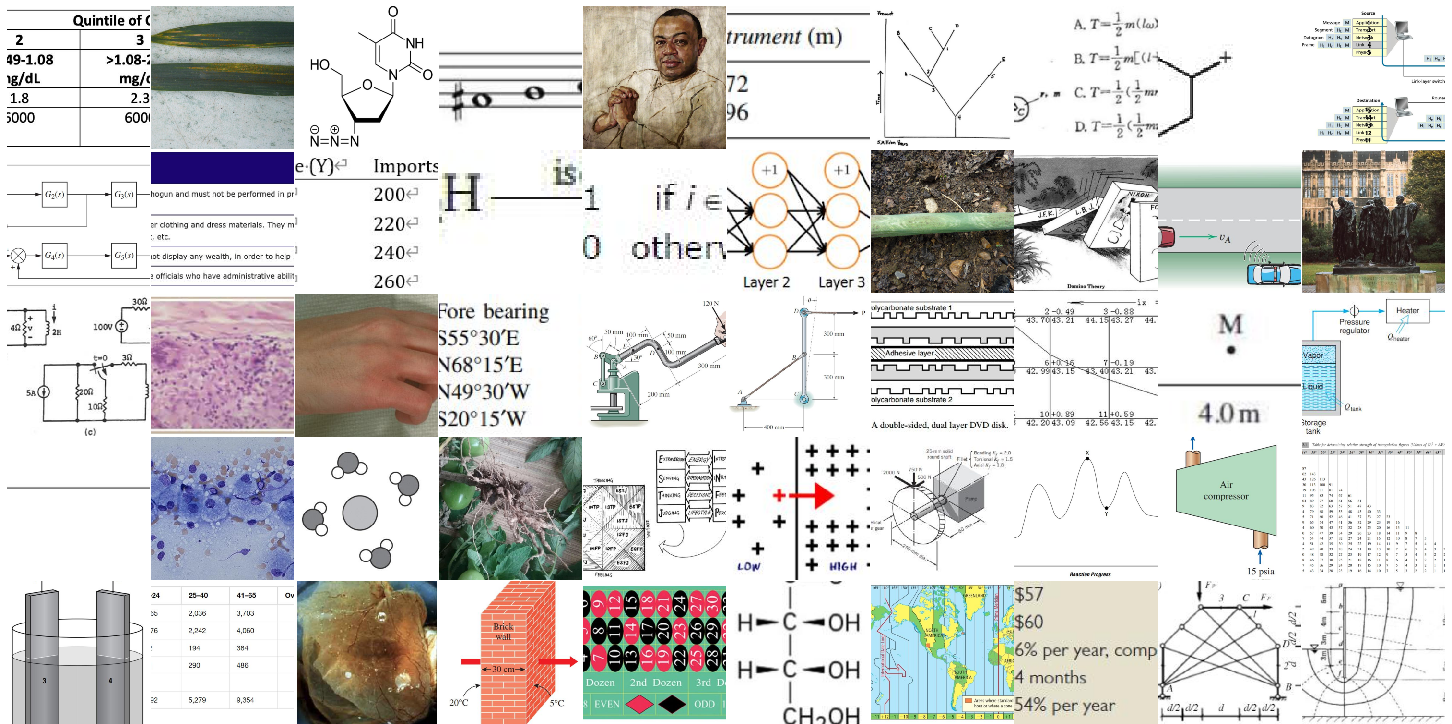
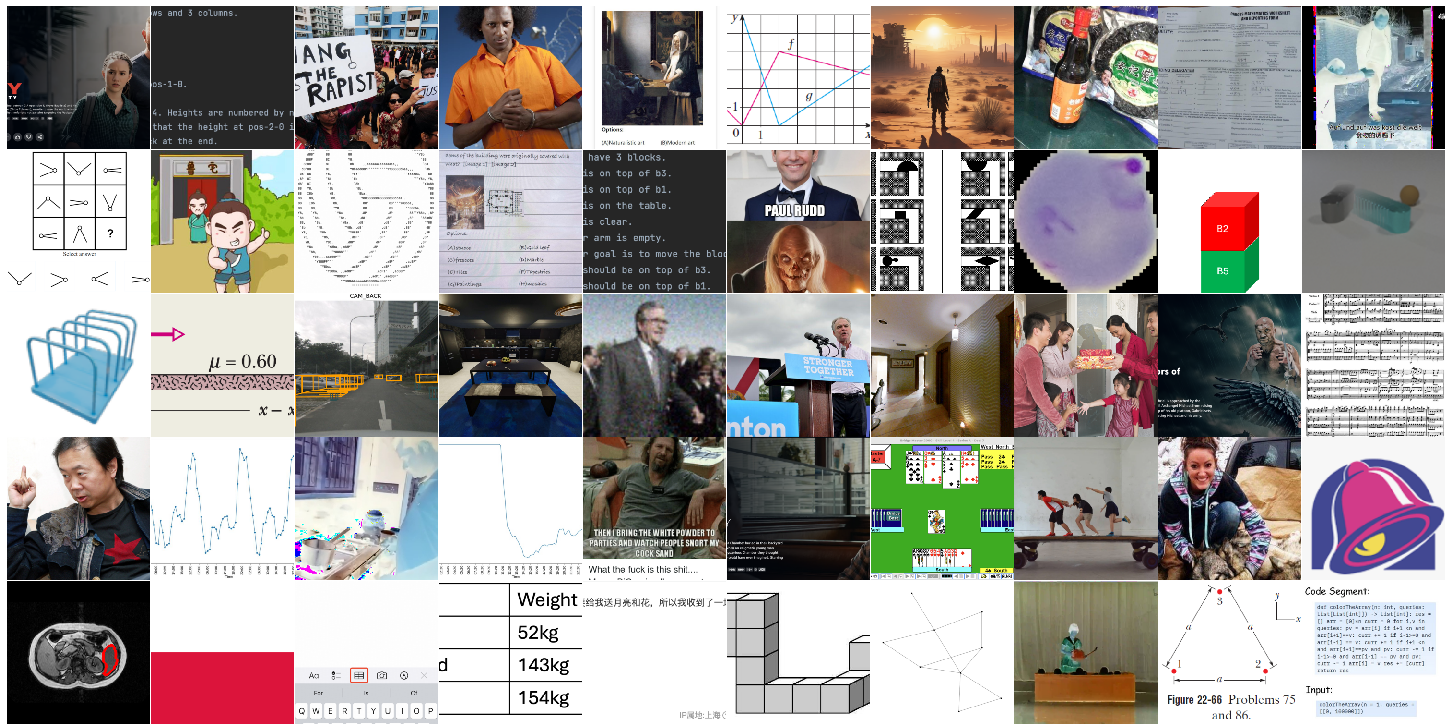
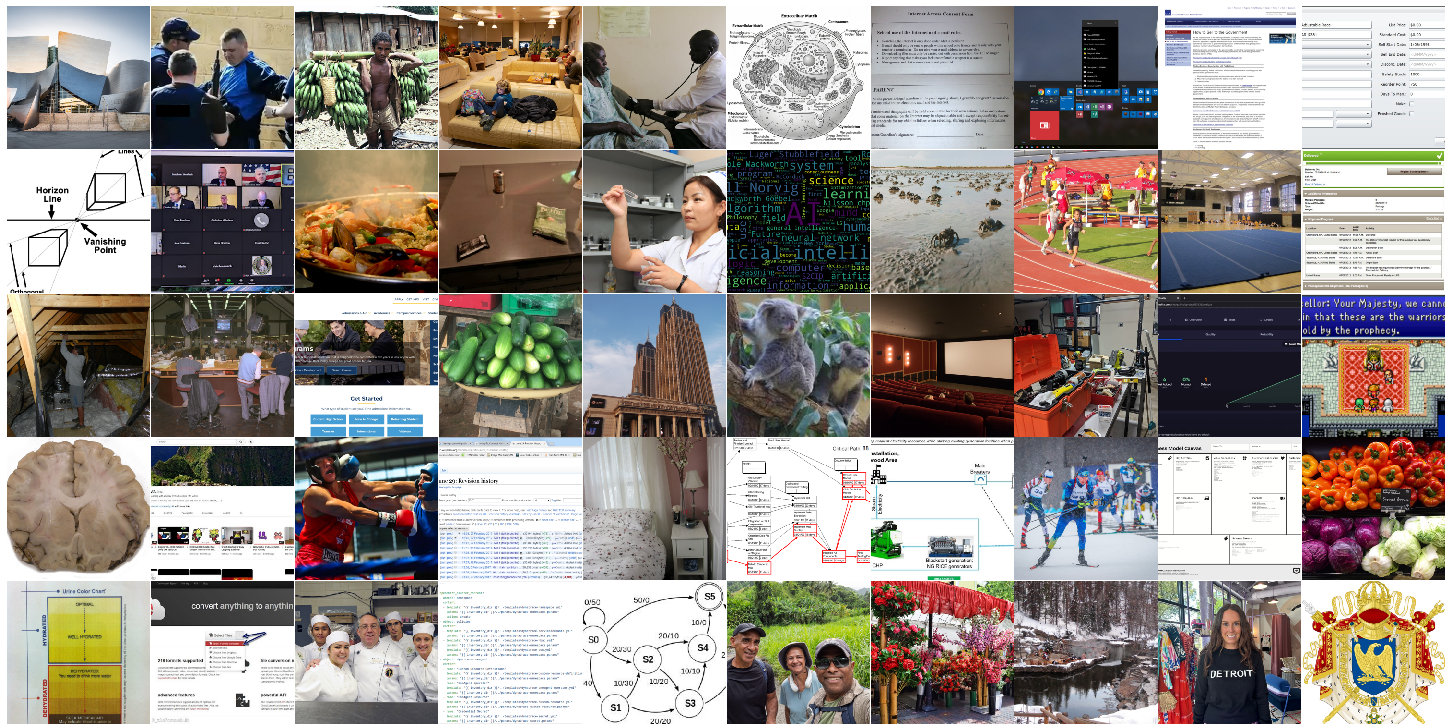
Abstract: In real-world applications, models are expected to perform reliably across diverse settings. Yet, many existing multimodal benchmarks expand task types without capturing the visual diversity needed to handle open-ended visual inputs. We present WorldBench, a challenging and visually diverse reasoning benchmark to evaluate Multimodal LLMs (MLLMs). We build a taxonomy of thousands of visual concepts across multiple domains (e.g., living things). Guided by this taxonomy, we curate a broad collection of images from search engines and existing datasets to comprehensively represent the visual world. Through structured trial-and-error, we manually design challenging questions that frontier MLLMs fail to answer. On quantitative and human evaluations, WorldBench achieves higher visual diversity than any existing diverse benchmark. Evaluating 15 MLLMs on WorldBench reveals weaknesses in visual understanding: even the strongest model reaches only 64.0% accuracy, while some models perform marginally above chance-level. We hope our work highlights the importance of visual diversity in building multimodal benchmarks.


Paper Prompts
Sign up for free to create and run prompts on this paper using GPT-5.
Top Community Prompts
Explain it Like I'm 14
What is this paper about?
This paper introduces WorldBench, a new “test” for AI systems that can see and understand images and text together (these are called multimodal LLMs, or MLLMs). Unlike many past tests that focus on lots of different task types, WorldBench focuses on something simpler but harder to get right: showing models a very wide variety of images from many parts of the real and digital world and asking questions that people find natural but current AI models find tricky.
What questions did the researchers ask?
Before building WorldBench, the team set out to answer a few simple questions:
- Can we build a benchmark that better reflects the visual variety of the real world, not just lots of task types?
- If we do that, will the images truly be more diverse than other benchmarks, both by math measures and by what people think?
- When we test today’s best vision-LLMs on this benchmark, how well do they actually perform, and where do they fail?
How did they do it?
To make WorldBench both broad and fair, the team followed a clear process.
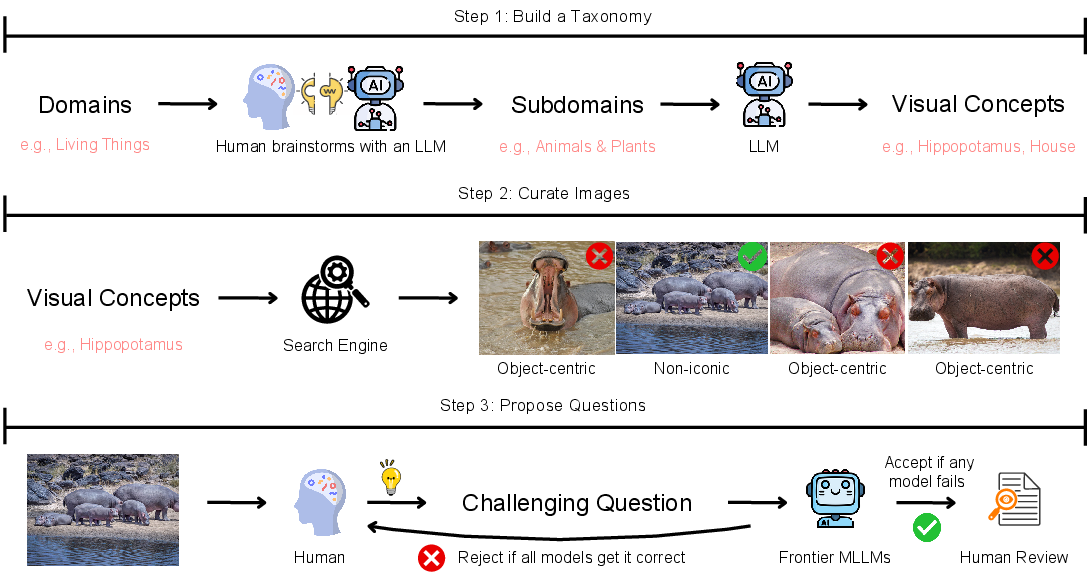
1) Building a “map” of visual concepts (a taxonomy)
Think of a taxonomy like a big, organized map of topics. The team:
- Created a list of thousands of fine-grained visual concepts across seven big areas (for example: animals and plants, events and activities, science and engineering visuals, websites and apps, games, and robot views).
- Used an AI assistant to suggest and refine this list, with humans checking and cleaning it up.
Analogy: If the visual world were music, they didn’t just pick “rock” and “pop”—they listed many genres, sub-genres, and specific artists to make sure the playlist had real variety.
2) Collecting diverse images
For each concept, they searched the web and existing datasets to find one high-quality image that really matched it. They avoided simple close-up “catalog” pictures and preferred more natural scenes with context, like how you’d actually see things in real life. For robot views, they drew from a robotics dataset so the images reflected what a robot’s camera might see.
3) Writing tricky but fair questions
For each image, they wrote a four-option multiple-choice question. Then they tested that question on several top AI models. If all models got it right, they revised the question to make it a bit more challenging—without making it confusing—until at least one strong model got it wrong. They also reviewed and fixed questions to remove ambiguity and ensure there was exactly one correct answer.
Analogy: It’s like giving a practice quiz to top students and adjusting the questions so they test true understanding, not just memorization.
4) Checking that the images are truly diverse
They measured diversity in two ways:
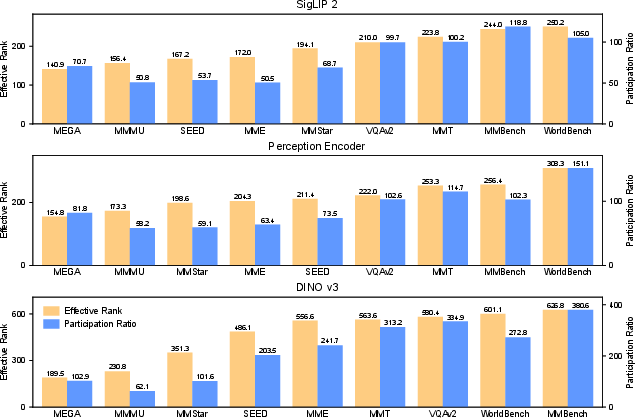
- Computer way: They turned images into “fingerprints” (called embeddings) using different vision models and checked how “spread out” those fingerprints were. If the fingerprints point in many directions, that means the set of images covers a lot of visual variety. Two diversity scores they used are called “effective rank” and “participation ratio.” Higher scores mean more variety.
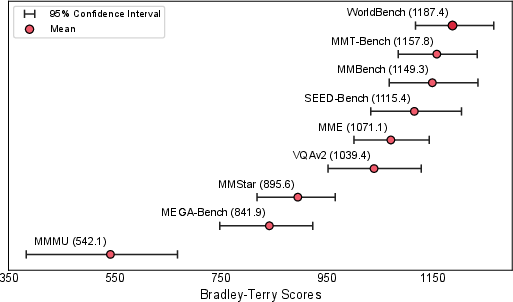
- Human way: They showed people two grids of 100 random images (from different benchmarks) side-by-side and asked, “Which set looks more diverse?” Then they used a simple rating method to rank the benchmarks.
5) Testing many AI models
They evaluated 15 popular multimodal models (both closed and open-source) by asking them all 2,000 questions and measuring accuracy.
What did they find?
Here are the main results and why they matter:
- WorldBench is more visually diverse.
- By math measures: Across different vision encoders, WorldBench usually ranked first or second in diversity scores. That means its images “cover more ground.”
- By people’s judgment: In head-to-head comparisons, human raters picked WorldBench as the most diverse image set overall.
- Today’s best models still struggle.
- Even the top-performing model scored about 64% overall. Random guessing on four choices would be 25%, so 64% is better than chance—but far from perfect.
- No model scored above 75% in any single domain. This shows that even strong models miss many questions that humans find straightforward.
- Models fail in very human ways.
- They often stumble on fine details (like counting or noticing small objects) and sometimes “guess” without grounding their answers in the image.
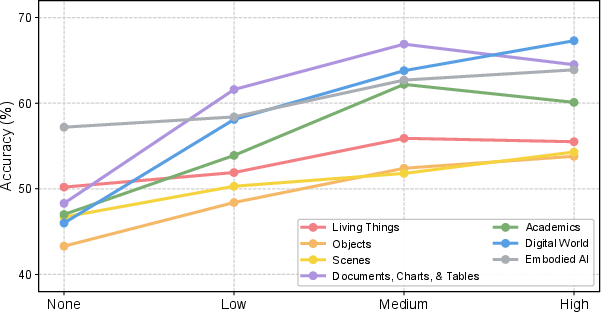
- “More thinking” isn’t always better.
- Some models can produce longer step-by-step reasoning. The team tested giving them more “thinking time,” but performance didn’t always improve. In some areas it plateaued or even got worse, suggesting that just adding more reasoning tokens isn’t a guaranteed fix.
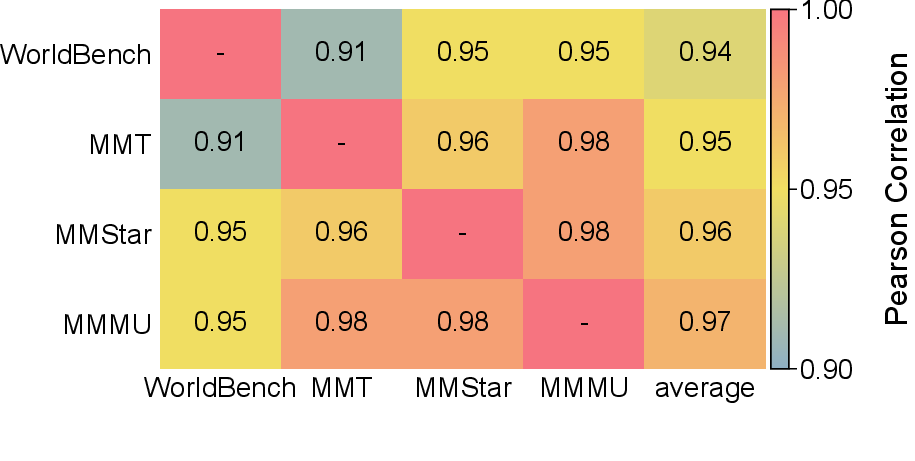
- WorldBench measures something different.
- Model scores on WorldBench didn’t line up tightly with scores on other benchmarks, suggesting WorldBench adds a fresh, useful angle—testing models on a broader, more realistic visual variety.
Why does this matter?
If we want AI that works well in the real world—on photos, screenshots, diagrams, websites, games, and robot views—we need tests that reflect that world’s variety. WorldBench shows that:
- Visual diversity is just as important as task diversity for evaluating AI.
- Current models still have significant gaps in basic visual understanding across many kinds of images.
- Simply making models “think longer” isn’t enough; we need better training and better grounding in images.
In short, WorldBench is a step toward fairer, tougher, and more realistic evaluation. It helps researchers see where models fail and how to make them more reliable for everyday, real-world use.
Knowledge Gaps
Knowledge gaps, limitations, and open questions
Below is a focused list of what remains missing, uncertain, or unexplored in the paper, phrased to guide concrete follow-up work.
- Reproducibility of the LLM-guided taxonomy: prompts, seeds, and revision criteria for taxonomy generation are not documented, making it hard to replicate or audit concept selection and pruning.
- Coverage of the “visual world” is undefined and unquantified: the paper does not specify what domains (e.g., medical, satellite/aerial, industrial, surveillance, historical, low-light/thermal) are excluded and why.
- One-image-per-concept design leaves intra-class variability untested; it is unclear how models would handle viewpoint, lighting, style, and context diversity within the same concept.
- Cultural, geographic, and demographic representation are not assessed; the dataset may overrepresent certain regions, lifestyles, or cultural artifacts due to search-engine bias.
- Multilingual visual content is not analyzed; the extent to which images contain non-English text (and how that affects difficulty) is unspecified.
- Robotics coverage is skewed by sourcing from a single dataset (AgentVQA); external validity to other robotic settings, sensors, or embodiments is unknown.
- Web/digital domains rely on static screenshots; the benchmark does not test interactive, temporal, or stateful aspects critical to web agents or GUI tasks.
- Image licensing and redistribution status are unspecified; compliance and long-term dataset availability are unclear for web-sourced images.
- Deduplication and near-duplicate detection are not reported; overlap within the benchmark and with pretraining corpora is unmeasured, risking data leakage and inflated performance.
- Data contamination checks are absent; there is no systematic screening for training-time exposure (e.g., perceptual hashing/CLIP-nearest-neighbor checks against common web-scale corpora).
- Balance across the seven domains is not quantified; per-domain counts and difficulty distributions are not reported despite claims of “more balanced” coverage.
- The non-iconic image criterion is qualitative; no operational definition or quantitative check ensures the intended scene/context complexity is consistently achieved.
- Multiple-choice format only: the benchmark does not evaluate free-form grounding, spatial reference resolution, or step-by-step reasoning fidelity beyond picking a choice.
- Distractor construction is under-specified; there is no analysis of answer option balance, position bias, or whether distractors can be eliminated via language priors alone.
- Question difficulty is defined by “at least one frontier model fails,” which risks overfitting to current weaknesses; forward-compatibility and stability of difficulty as models improve are untested.
- Different frontier model sets were used across question batches; cross-batch comparability and the effect of this non-stationarity on difficulty calibration remain unresolved.
- Human baseline performance is not reported; the claim that questions are “intuitive for humans” lacks empirical validation (e.g., accuracy, response time, IRT-based difficulty/discrimination).
- Inter-annotator agreement and systematic ambiguity checks are missing; reliance on LLM-assisted editing (Claude Code) without quantitative QA metrics leaves residual annotation uncertainty.
- Optional explanations for only some questions limit analysis of reasoning requirements and make it impossible to systematically evaluate model rationales or justification quality.
- Embedding-based diversity metrics (effective rank/participation ratio) may not reflect semantic diversity; their sensitivity to encoder choice is acknowledged but not deeply analyzed (e.g., across many encoders, seeds, crops, and feature layers).
- Human diversity study is small (12 volunteers, 360 comparisons) and potentially biased; no inter-rater reliability, blinding to dataset identity, or presentation-bias controls are reported.
- No statistical significance testing is provided for model performance differences; result variability due to sampling, decoding randomness, or API drift is not quantified.
- Decoding and sampling are not standardized across models; using default parameters and single runs obscures the impact of temperature/top-p on accuracy comparability and variance.
- Proprietary model versions can change over time; reproducibility of the reported results is uncertain without version pinning and archived artifacts.
- Failure analysis is anecdotal; there is no systematic taxonomy of error types (e.g., grounding, counting, OCR, commonsense) or per-domain/item-level diagnostics to guide model improvements.
- Correlation analysis with other benchmarks uses a limited model set; the high correlations (e.g., ~0.94) are not stress-tested for robustness or interpreted with significance intervals.
- No causal link is established between visual diversity and model difficulty; controlled ablations (same questions with more/less diverse image sets) are missing.
- Robustness is not evaluated (e.g., to cropping, scaling, blur, occlusions, color shifts); how visual diversity interacts with robustness remains open.
- Safety and fairness considerations are not discussed; potential sensitive content, stereotyping, or disparate error rates across groups are unmeasured.
- Maintenance and anti-overfitting strategy are unclear; without a hidden or regularly refreshed test set, the benchmark may saturate as models train on it.
- Extensions to video, multi-image reasoning, 3D, or audio are unaddressed; the benchmark currently evaluates only single-image inputs.
- Generalizability of the “reasoning budget” findings is limited; only one model (GPT-5.4) is varied, leaving open whether the non-monotonic trend holds broadly.
- The impact of OCR and text-heavy images is not isolated; there is no breakdown of how much performance depends on reading vs. pure visual perception.
- Per-domain/item metadata (e.g., OCR presence, motion blur, small objects) are not released or analyzed, limiting controlled studies of capability-specific deficits.
- Prompt sensitivity and instruction-following effects are not explored; alternative prompting strategies could materially change results but are not systematically tested.
Practical Applications
Immediate Applications
The following use cases can be deployed now using the benchmark, metrics, and workflows introduced in the paper.
- Robust benchmarking and model selection for multimodal products
- Sectors: software, e-commerce, media, robotics, autonomous web agents
- What: Use WorldBench’s 2,000 diverse, non-iconic images and challenging MCQs to compare and select MLLMs for production (e.g., UI understanding, scene understanding, digital content, robotics viewpoints).
- Tools/products/workflows: Integrate WorldBench into CI/CD as a pre-release QA gate for model upgrades; maintain acceptance thresholds by domain (e.g., “Digital/Web Agents,” “Robotics”).
- Assumptions/dependencies: Ensure dataset licensing for internal evaluation use; align task format (MCQ) with your product’s answer format via adapters.
- Dataset diversity auditing with embedding-based metrics
- Sectors: AI infrastructure, academia, enterprise ML platforms
- What: Apply effective rank and participation ratio on image embeddings (SigLIP2, Perception Encoder, DINO) to quantify and monitor visual diversity in training/eval sets.
- Tools/products/workflows: “Diversity Auditor” SDK that computes metrics across multiple encoders; dashboards that flag diversity collapse or over-representation of narrow domains.
- Assumptions/dependencies: Diversity rankings can vary by encoder; use multiple encoders and human spot-checks to validate.
- Red-teaming and product QA via structured trial-and-error question design
- Sectors: consumer assistants, customer support, enterprise copilots
- What: Reuse the paper’s iterative question-authoring workflow (probe frontier models, revise until failure) to identify brittle spots in your MLLM.
- Tools/products/workflows: Internal tool to auto-generate probes from your product’s screenshots/images and iterate until a target model fails; maintain a “fail set” for regression testing.
- Assumptions/dependencies: API access to strong baseline models; reviewer time to verify clarity and single-correct-answer constraints.
- GUI and web agent capability checks
- Sectors: RPA, enterprise IT, e-commerce, productivity tools
- What: Use “Digital/Web Agents” domains to test agents’ screenshot comprehension (e.g., shopping carts, app installs, booking flows) before deployment.
- Tools/products/workflows: Pre-deployment validation suite that scores agents on UI understanding tasks drawn from WorldBench-like panels.
- Assumptions/dependencies: Domain shift to proprietary UIs; may require collecting analogous in-house screenshots.
- Robotics perception evaluation
- Sectors: robotics, logistics, manufacturing
- What: Leverage the curated robot-centric images (sourced from AgentVQA) to evaluate VLM perception and grounding within robot POV contexts.
- Tools/products/workflows: Add a robotics panel to validation pipelines for perception stacks; track fine-grained failures (e.g., counting, ungrounded inferences).
- Assumptions/dependencies: Sensor/domain mismatch (lighting, motion blur, camera intrinsics); may need additional domain-specific images.
- Curriculum design for fine-tuning and data collection
- Sectors: AI model training, data labeling vendors
- What: Adopt the taxonomy-first, non-iconic image preference to curate balanced fine-tuning sets that avoid object-centric bias.
- Tools/products/workflows: Taxonomy-driven crawler with human-in-the-loop review; sampling quotas per domain to enforce breadth.
- Assumptions/dependencies: Licensing for collected images; content moderation for web-native imagery.
- Reasoning budget tuning for MLLM deployments
- Sectors: platform teams operating MLLMs at scale
- What: Use observed non-monotonic gains from “more reasoning tokens” to set per-domain token budgets that optimize latency vs. accuracy.
- Tools/products/workflows: Auto-tuner that sweeps reasoning budgets on a representative subset and selects cost-effective settings.
- Assumptions/dependencies: Behavior may vary across models and domains; periodic re-evaluation required after model updates.
- Procurement and vendor evaluation in enterprises and government
- Sectors: public sector, regulated industries, enterprise IT
- What: Add WorldBench scores (overall and domain-wise) to procurement RFPs to compare vendors’ claims on visual robustness.
- Tools/products/workflows: Standardized scoring rubric; requirement that vendors report diversity-aware metrics and pass model-agnostic evaluation.
- Assumptions/dependencies: Benchmark versioning and reproducibility; clear disclosure of evaluation protocols.
- Academic research baselines and ablations
- Sectors: academia, research labs
- What: Use WorldBench to study counting, grounding, and ungrounded inference errors; analyze benchmark correlations; test new visual grounding modules.
- Tools/products/workflows: Shared code/dataset; reproducible splits; ablation of encoder choices for diversity measurement.
- Assumptions/dependencies: Rapid model progress may change difficulty; maintain versions and leaderboards.
- Education and training on dataset bias and evaluation
- Sectors: education, workforce upskilling
- What: Classroom labs showing how task-centric benchmarks can mask failures and how visual diversity alters evaluation outcomes.
- Tools/products/workflows: Assignments using Bradley–Terry human judgments and effective rank computations.
- Assumptions/dependencies: Instructor access to model APIs and compute.
- Accessibility and alt-text reliability checks
- Sectors: accessibility tech, social platforms, CMS
- What: Use diverse, non-iconic images to test alt-text and image caption robustness on varied scenes and digital content.
- Tools/products/workflows: Regression suite on sampled panels; track improvements in challenging categories (e.g., web screenshots).
- Assumptions/dependencies: Adapt MCQs to generative outputs with rubric-based scoring; human spot-check for subjective cases.
- Continuous evaluation for data drift
- Sectors: platform ops, MLOps
- What: Use diversity metrics and domain-wise scores to detect drift in production workloads (e.g., a surge of diagram-like images).
- Tools/products/workflows: Monitoring that compares embedding covariance structure over time to a WorldBench-calibrated baseline.
- Assumptions/dependencies: Reliable logging of image inputs; privacy-preserving embedding pipelines.
Long-Term Applications
These opportunities require further research, scaling, or domain adaptation before broad deployment.
- Standards and regulation for visual diversity in AI evaluation
- Sectors: policy, compliance, standards bodies
- What: NIST-style guidance mandating visual diversity metrics and human-judged diversity in audits of high-impact multimodal systems.
- Tools/products/workflows: Certified test suites; public scorecards with domain-level breakdowns.
- Assumptions/dependencies: Consensus on metrics; governance for benchmark updates and responsible access to imagery.
- Automated benchmark generation that evolves with model capabilities
- Sectors: AI infrastructure, evaluation platforms
- What: Generalize the structured trial-and-error workflow into a “benchmark factory” that continuously curates new adversarial-but-natural items as models improve.
- Tools/products/workflows: Agentic pipeline orchestrating search, LLM taxonomy expansion, candidate question generation, frontier-model probing, and human verification.
- Assumptions/dependencies: API costs and rate limits; quality control to avoid ambiguous or unfair items.
- Domain-specific spinoffs (e.g., healthcare, finance, legal, industrial operations)
- Sectors: healthcare imaging and EHR UIs, finance back-office UIs, legal document UIs, industrial control panels
- What: Build “WorldBench-like” benchmarks with professional imagery and workflows (screens, scans, charts) to assess practical readiness.
- Tools/products/workflows: Partnerships for access to de-identified data; expert annotators; secure evaluation sandboxes.
- Assumptions/dependencies: Privacy, compliance (HIPAA, GDPR), domain expertise, licensing constraints.
- Training-data construction pipelines driven by taxonomy and diversity controls
- Sectors: foundation model developers, data vendors
- What: Industrial-scale pipelines that enforce visual diversity quotas, prioritize non-iconic views, and reduce near-duplicate overfitting.
- Tools/products/workflows: Diversity-aware samplers; adaptive quotas informed by effective rank trends; automated near-duplicate filters.
- Assumptions/dependencies: Scalable crawling contracts/APIs; robust deduplication; content safety filtering.
- Safety and fairness audits across visual contexts
- Sectors: regulators, civil society, risk and compliance
- What: Use diverse domains to study bias and safety behaviors in varied visual settings (e.g., web-native content vs. photos; different geographies).
- Tools/products/workflows: Stratified reporting; scenario libraries; disclosure templates for public transparency.
- Assumptions/dependencies: Labeling schema for sensitive attributes; ethical review; community oversight.
- Model architecture advances for fine-grained perception and grounding
- Sectors: AI research, product teams
- What: Develop modules and training objectives targeting counting, attention, and grounding deficits revealed by the benchmark; calibrate when added reasoning helps vs. harms.
- Tools/products/workflows: New loss functions; attention supervision; program-of-thoughts for visual tasks with budget-aware decoding.
- Assumptions/dependencies: Compute budget, open-sourced training code, reproducibility infrastructure.
- General-purpose “Visual Diversity Score” as a procurement KPI
- Sectors: enterprises buying MLLM services
- What: A standardized, model-agnostic score (multi-encoder ER/PR + human BT ratings) reported in SLAs and vendor scorecards.
- Tools/products/workflows: Third-party audits and certification; periodic re-scoring.
- Assumptions/dependencies: Industry buy-in; robust legal framing for comparative claims.
- Continuous evaluation loops for agents and robots
- Sectors: autonomous web agents, robotics, warehousing
- What: Integrate WorldBench-style panels into RL/online learning loops as validation gates to catch regressions in perception and instruction-following.
- Tools/products/workflows: Shadow evaluation in pipelines; fail-case mining and curriculum augmentation.
- Assumptions/dependencies: Bridging sim-to-real gaps; preventing overfitting to eval sets (need rotating panels).
- Marketplace ratings and consumer disclosures
- Sectors: consumer AI platforms, app stores
- What: Public-facing labels indicating a model’s visual robustness across domains (e.g., “Digital,” “Robotics”).
- Tools/products/workflows: Independent testing labs; periodic updates with new panel rotations to prevent gaming.
- Assumptions/dependencies: Standardized protocols; legal review of claims.
- Human-in-the-loop dataset QA assistants
- Sectors: data operations
- What: Operationalize the paper’s “Claude Code-assisted” review flow into tools that suggest fixes for ambiguous items and enforce single-answer constraints at scale.
- Tools/products/workflows: Reviewer consoles with suggested edits and explanations; batch triage pipelines; audit trails.
- Assumptions/dependencies: High-quality LLMs for copyediting and disambiguation; human oversight for acceptance.
- Cross-benchmark correlation analysis for capability coverage
- Sectors: AI eval platforms, research
- What: Use WorldBench’s low correlation with task-centric suites to design minimal-but-comprehensive evaluation portfolios that reduce redundancy.
- Tools/products/workflows: Portfolio selection tools; budget-aware evaluation planners.
- Assumptions/dependencies: Access to multiple benchmarks; ongoing tracking as models evolve.
Glossary
- AgentVQA: A dataset/benchmark focused on agent-related visual tasks for evaluating models. "AgentVQA~\citep{anonymous2025agentvqa}, a unified benchmark for agentic visual understanding."
- agentic visual understanding: The study of visual perception in the context of autonomous agents acting in environments. "a unified benchmark for agentic visual understanding."
- Bradley--Terry model: A probabilistic model for converting pairwise comparison outcomes into a global ranking of items. "We aggregate these pairwise votes into a global ranking using the Bradley--Terry model~\citep{bradley1952rank}"
- bootstrap confidence intervals: Resampling-based intervals used to quantify uncertainty in estimated quantities. "we compute bootstrap confidence intervals~\citep{diciccio1996bootstrap}."
- Chain-of-Thought: A prompting/decoding approach where models produce intermediate reasoning steps before the final answer. "to enable the generation of intermediate Chain-of-Thought reasoning steps~\citep{wei2023chainofthoughtpromptingelicitsreasoning}"
- effective rank: An entropy-based measure of the effective dimensionality of a covariance matrix’s spectrum. "{WorldBench} often ranks first or second in effective rank~\citep{roy2007effective} and participation ratio"
- Elo-style rating: A normalized scoring scale (inspired by chess ratings) used to present comparative strengths. "the resulting scores are then linearly rescaled to Elo-style rating for readability."
- eigenvalues: The principal variance components of a covariance matrix, indicating spread along orthogonal directions. "and denote its eigenvalues by ."
- embedding-based diversity metrics: Diversity measures computed on learned feature representations (embeddings) of images. "using both embedding-based diversity metrics and human judgments."
- feature covariance matrix: The covariance matrix of feature vectors (embeddings), capturing variance structure across features. "the effective rank and participation ratio of the feature covariance matrix computed from image embeddings"
- frontier MLLMs: The most capable, cutting-edge multimodal LLMs available at the time of evaluation. "we manually design challenging questions that frontier MLLMs fail to answer."
- LLM: A high-capacity neural model trained on text to perform language tasks; here also used to help build the taxonomy. "This process is semi-automated with a LLM and involves light human effort."
- L2-normalized embeddings: Feature vectors scaled to unit Euclidean (L2) norm to standardize magnitude. "extract their -normalized embeddings "
- Multimodal LLM (MLLM): A LLM that can process and reason over multiple modalities (e.g., text and images). "to evaluate Multimodal LLMs (MLLMs)."
- non-canonical perspectives: Non-standard viewpoints of objects/scenes that provide richer contextual information. "non-iconic images (or non-canonical perspectives~\citep{palmer1981cannonical})"
- non-iconic images: Images that are not tightly cropped or staged around a single object, instead depicting rich, contextual scenes. "we prioritize non-iconic images (or non-canonical perspectives~\citep{palmer1981cannonical}) with richer contexts"
- participation ratio: A spectral measure indicating how evenly variance is distributed across eigenvalues of a covariance matrix. "{WorldBench} often ranks first or second in effective rank~\citep{roy2007effective} and participation ratio"
- Pearson correlation: A statistic measuring linear correlation between two variables; here, between benchmark accuracies. "we compute the Pearson correlation between model accuracies"
- sample covariance matrix: The empirical covariance estimate computed from observed data (here, embeddings). "We then compute the sample covariance matrix "
- sigmoid function: The logistic function mapping real numbers to (0,1), often used to express probabilities. "where is the sigmoid function."
- taxonomy: A hierarchical organization of concepts used to guide comprehensive image collection and coverage. "we construct a large-scale taxonomy containing thousands of fine-grained visual concepts"
- Vendi Score: A diversity measure equivalent to effective rank when using cosine similarity. "This is equivalent to the Vendi Score~\citep{friedman2022vendi} with cosine similarity."
- vision encoder: A pre-trained model that maps images to vector representations (embeddings) capturing visual semantics. "Vision encoders~\citep{radford2021learning, zhai2023sigmoidlosslanguageimage, oquab2023dinov2} are pre-trained on millions or even billions of images"
- Web Agents: Systems that perceive and act within web interfaces to complete tasks. "three subdomains---\textcolor{gray}{Robotics}, \textcolor{gray}{Games}, and \textcolor{gray}{Web Agents}."
- zero-centered feature matrix: A matrix of features with the mean subtracted so each dimension has zero empirical mean. "define the zero-centered feature matrix:"
Collections
Sign up for free to add this paper to one or more collections.