- The paper introduces a disentanglement framework that isolates visual correctness from factual recall using the Counterfactual Visualization Literacy Assessment Test (CVLAT).
- The methodology leverages innovative metrics like Visualization Fidelity, Factual Alignment, and Visual-Factual Reliance Index to benchmark LVLM behaviors under aligned and conflicting evidence.
- Prompt engineering experiments reveal model steerability limits and underscore the need for multidimensional evaluation in high-stakes analytic contexts.
Disentangling Visual and Factual Correctness in LVLMs' Visualization Literacy
Introduction
Large Vision-LLMs (LVLMs) have demonstrated promising performance on visualization interpretation tasks, yet there is limited understanding of whether these systems generate responses based on direct visual reasoning or through the recall of pre-trained factual knowledge. The current work, "Disentangling Visual and Factual Correctness in LVLMs' Visualization Literacy" (2606.03142), provides a comprehensive disentanglement framework and empirical analysis to address this gap. The study systematically isolates visual correctness from factual correctness, diagnoses class-conditional behaviors in state-of-the-art LVLMs under conflicting evidence, and examines the steerability of visual–factual prioritization via prompt engineering, ultimately introducing the Counterfactual Visualization Literacy Assessment Test (CVLAT) and new analytic metrics for model evaluation.
Challenges in LVLM Visualization Assessment
Prevailing evaluation protocols for LVLMs assess visualization literacy predominantly with accuracy-based metrics using test instruments such as VLAT and Mini-VLAT. However, these metrics fail to distinguish whether correct answers derive from visual interpretation or retrieval of factual priors acquired during pre-training. This entanglement generates ambiguous performance interpretations in two major scenarios:
- Alignment Cases: When visualizations match real-world knowledge, correct answers are source ambiguous—one cannot ascertain if a model read the chart or retrieved the fact.
- Conflict Cases: When visualizations contradict real-world knowledge, models may override visual cues with factual knowledge (or vice versa), resulting in visually or factually correct answers whose provenance remains unobservable under single-axis metrics.
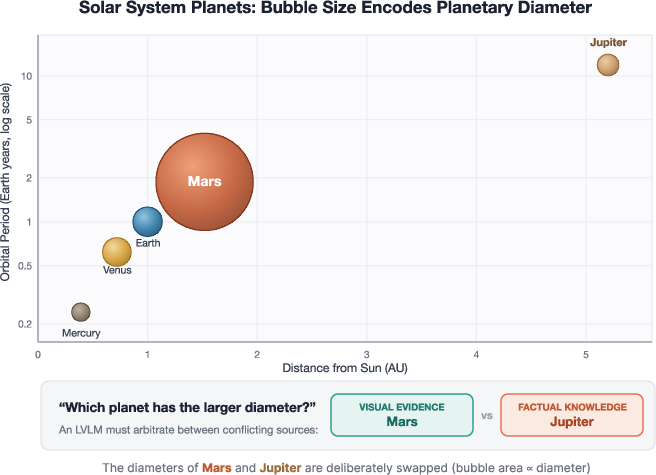
Figure 1: A bubble chart with Mars and Jupiter's diameters swapped, illustrating the challenge of distinguishing visual encoding from factual recall in LVLM responses.
A structured quadrant framework is introduced to orthogonalize visual and factual correctness and to expose the limitations of existing evaluation methods.
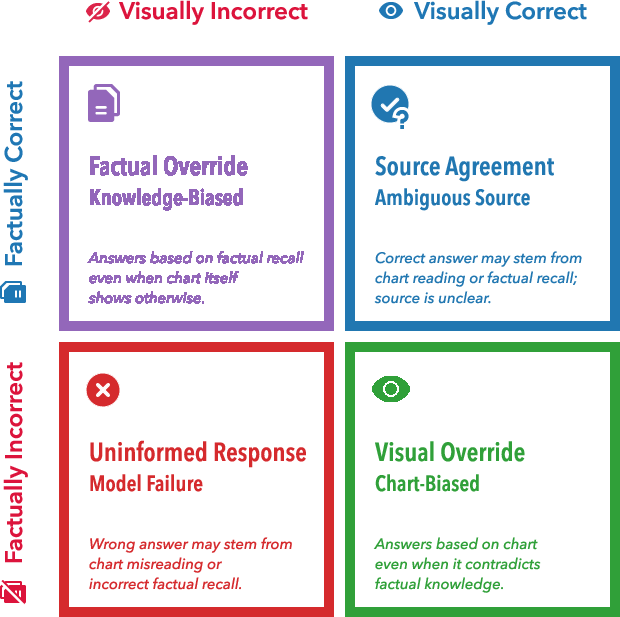
Figure 2: The quadrant framework formalizes four interpretable model behaviors depending on the alignment or conflict of visual and factual sources.
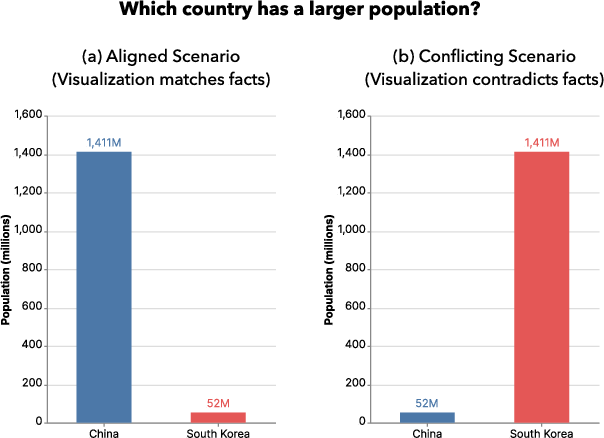
Figure 3: Example population bar charts highlight scenarios—aligned versus conflicting—used to determine whether LVLMs prioritize the visual encoding or factual priors.
Experimental Methodology
Experiments Overview
- Experiment 1: Baseline performance is measured using both VLAT (aligned) and reVLAT (randomized, non-aligned) on 12 proprietary and open-source LVLMs, analyzing prompt effects and performance across chart and task types.
- Experiment 2: Introduction of CVLAT, composed of systematically designed counterfactual visualizations grounded in domains of common human knowledge to provoke direct conflicts between visual evidence and factual priors.
- Experiment 3: Evaluation of the potential for prompt-based interventions to steer LVLM information prioritization, using explicit visual- and factual-priority prompts.
Metrics
- Visualization Fidelity Score (VF): Rate at which model responses align with the visualization over factual priors, corrected for guessing and normalized against a chart-reading capability reference.
- Factual Alignment Score (FA): Rate of factual-prior reliance, similarly computed using a Q-only factual probe as a denominator.
- Visual-Factual Reliance Index (VFRI): A normalized index in [−1,1] measuring the degree to which a model is visual- or factual-oriented across counterfactual conflicts.
Human Calibration
A human study (N=30) was conducted on the CVLAT items to calibrate difficulty and document the baseline tendency of human participants to follow visual evidence even under strong counterfactual scenarios.
Core Findings
Validation of Framework and Benchmarks
Experiment 1 demonstrates that several LVLMs attain or surpass human-level scores on VLAT, but accuracy consistently degrades on reVLAT, indicating nontrivial reliance on factual priors. This performance drop exposes the inadequacy of accuracy-alone metrics for true visualization literacy assessment. Neither high nor low scores on these tests resolve the nature of underlying model reasoning.
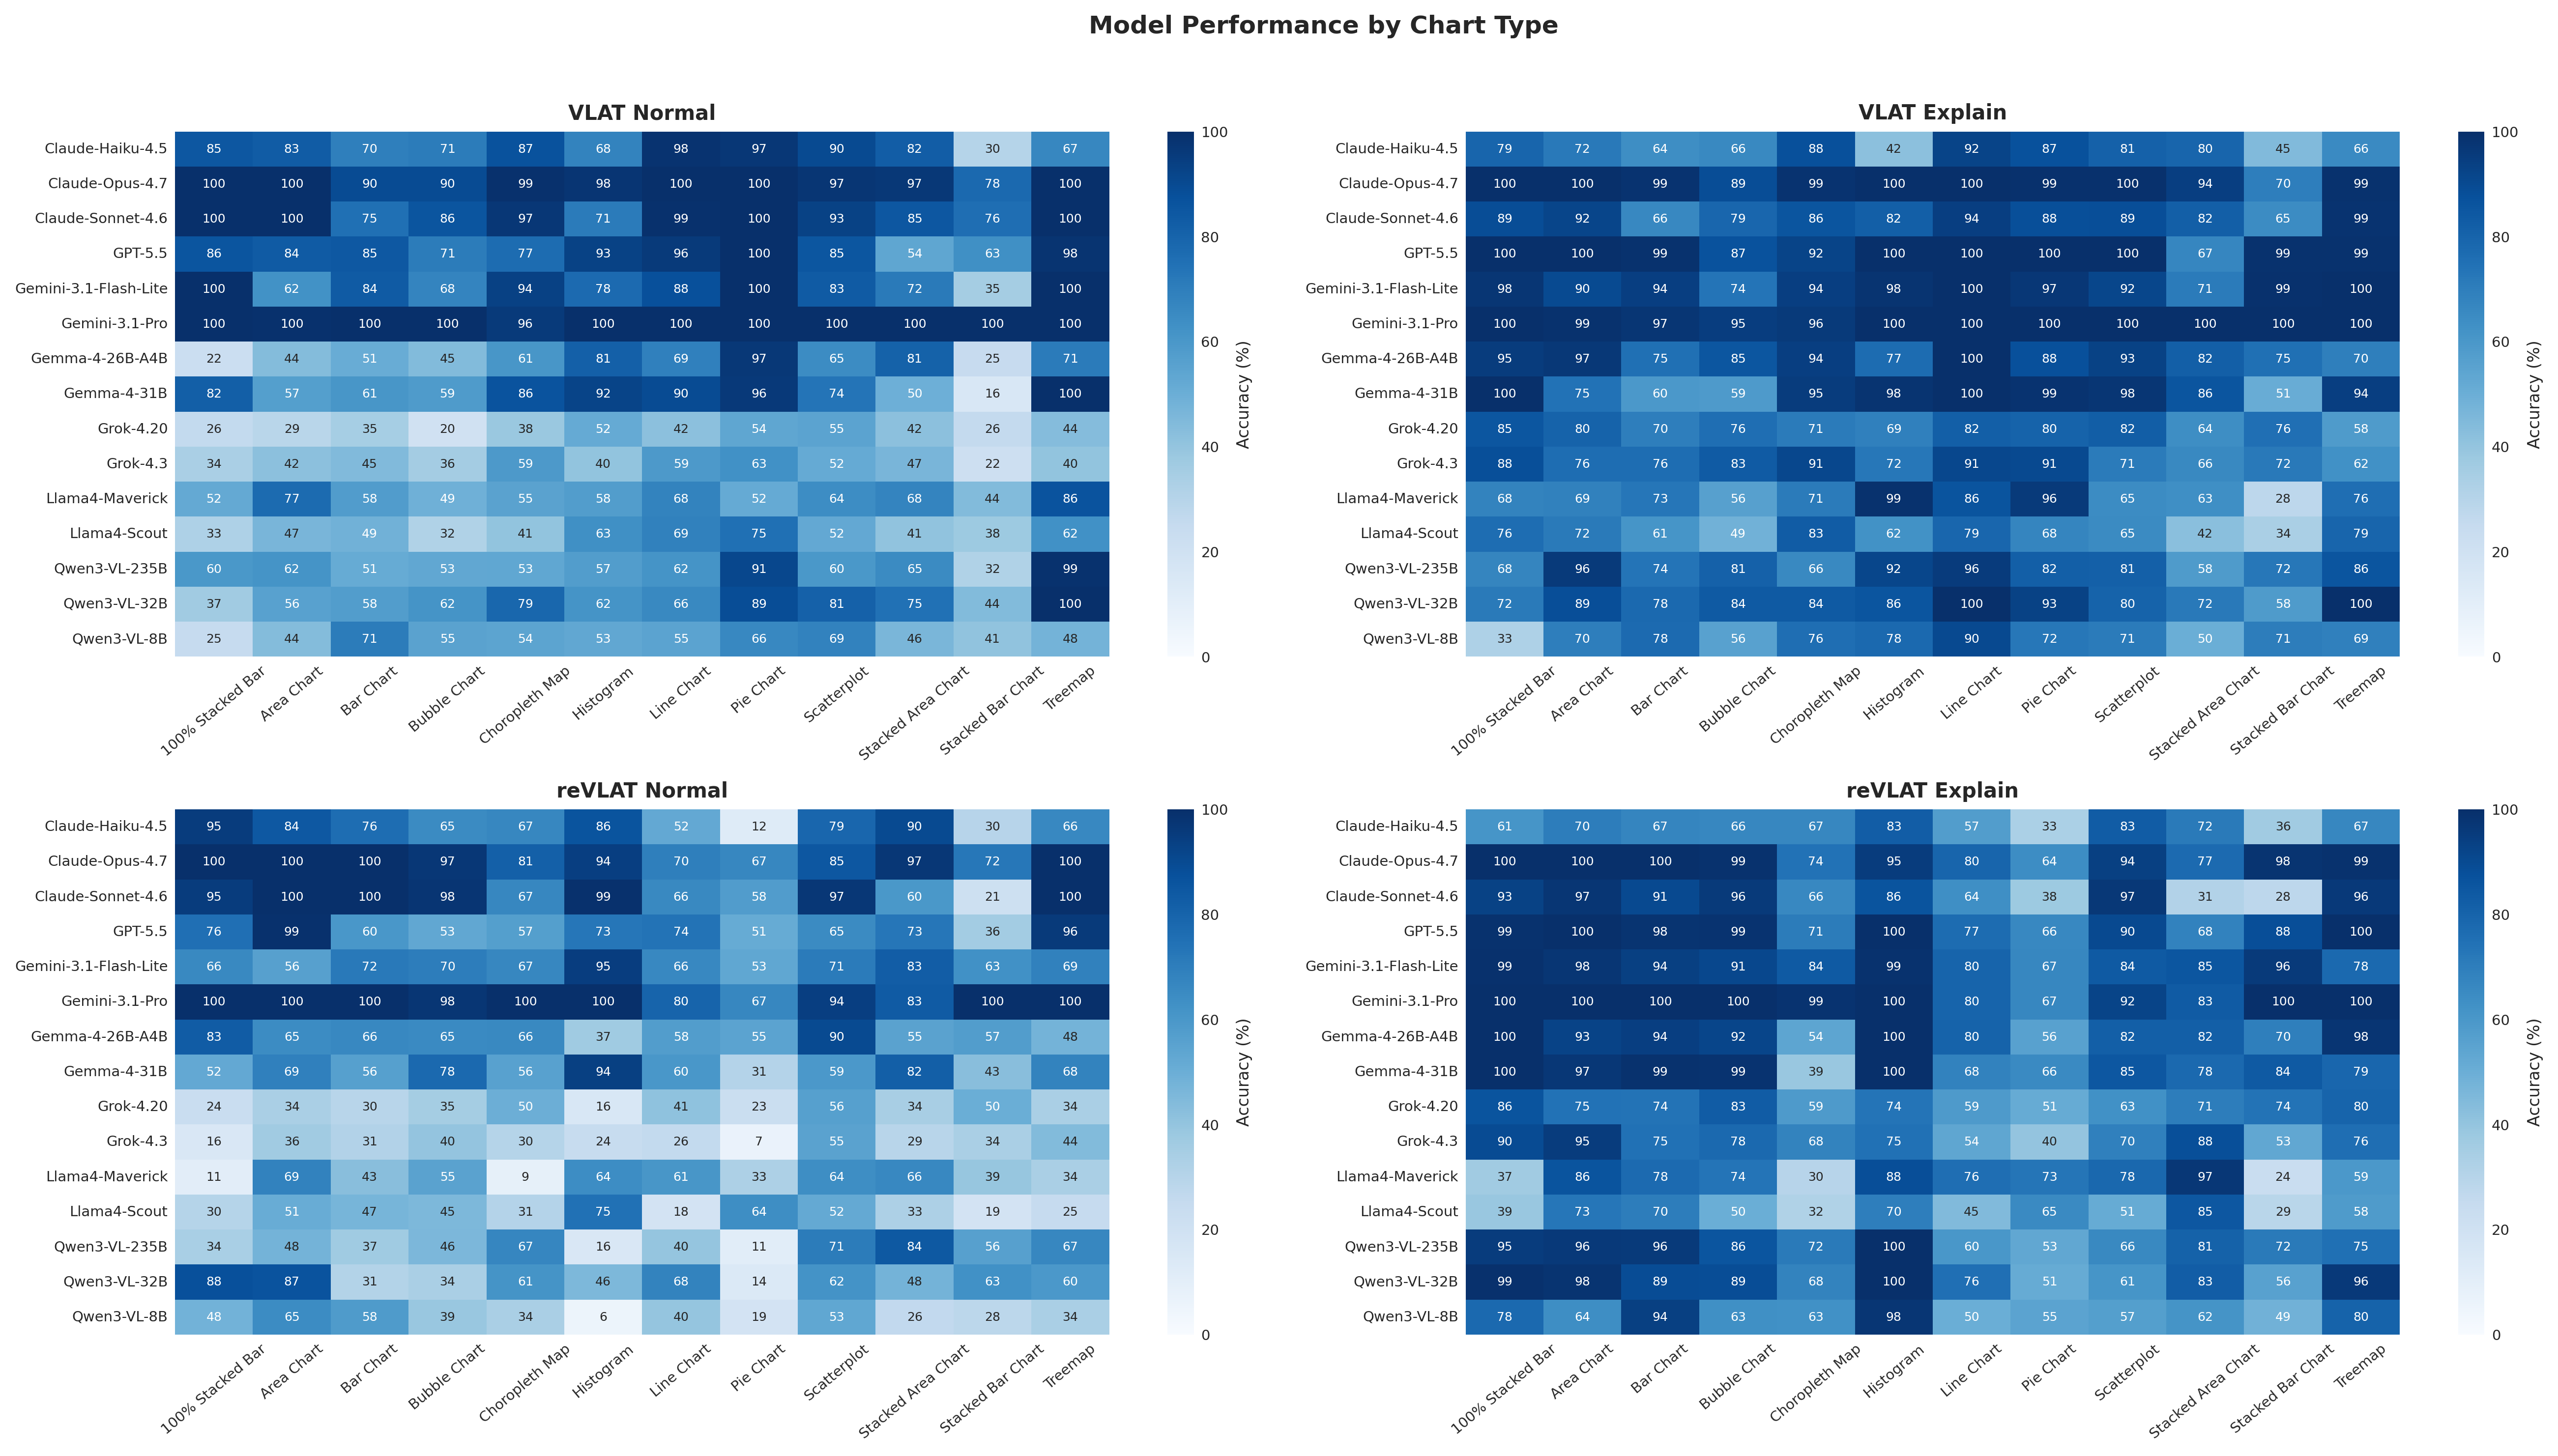
Figure 4: Model accuracy across 12 chart types in VLAT and reVLAT conditions, showing performance heterogeneity by visualization type.
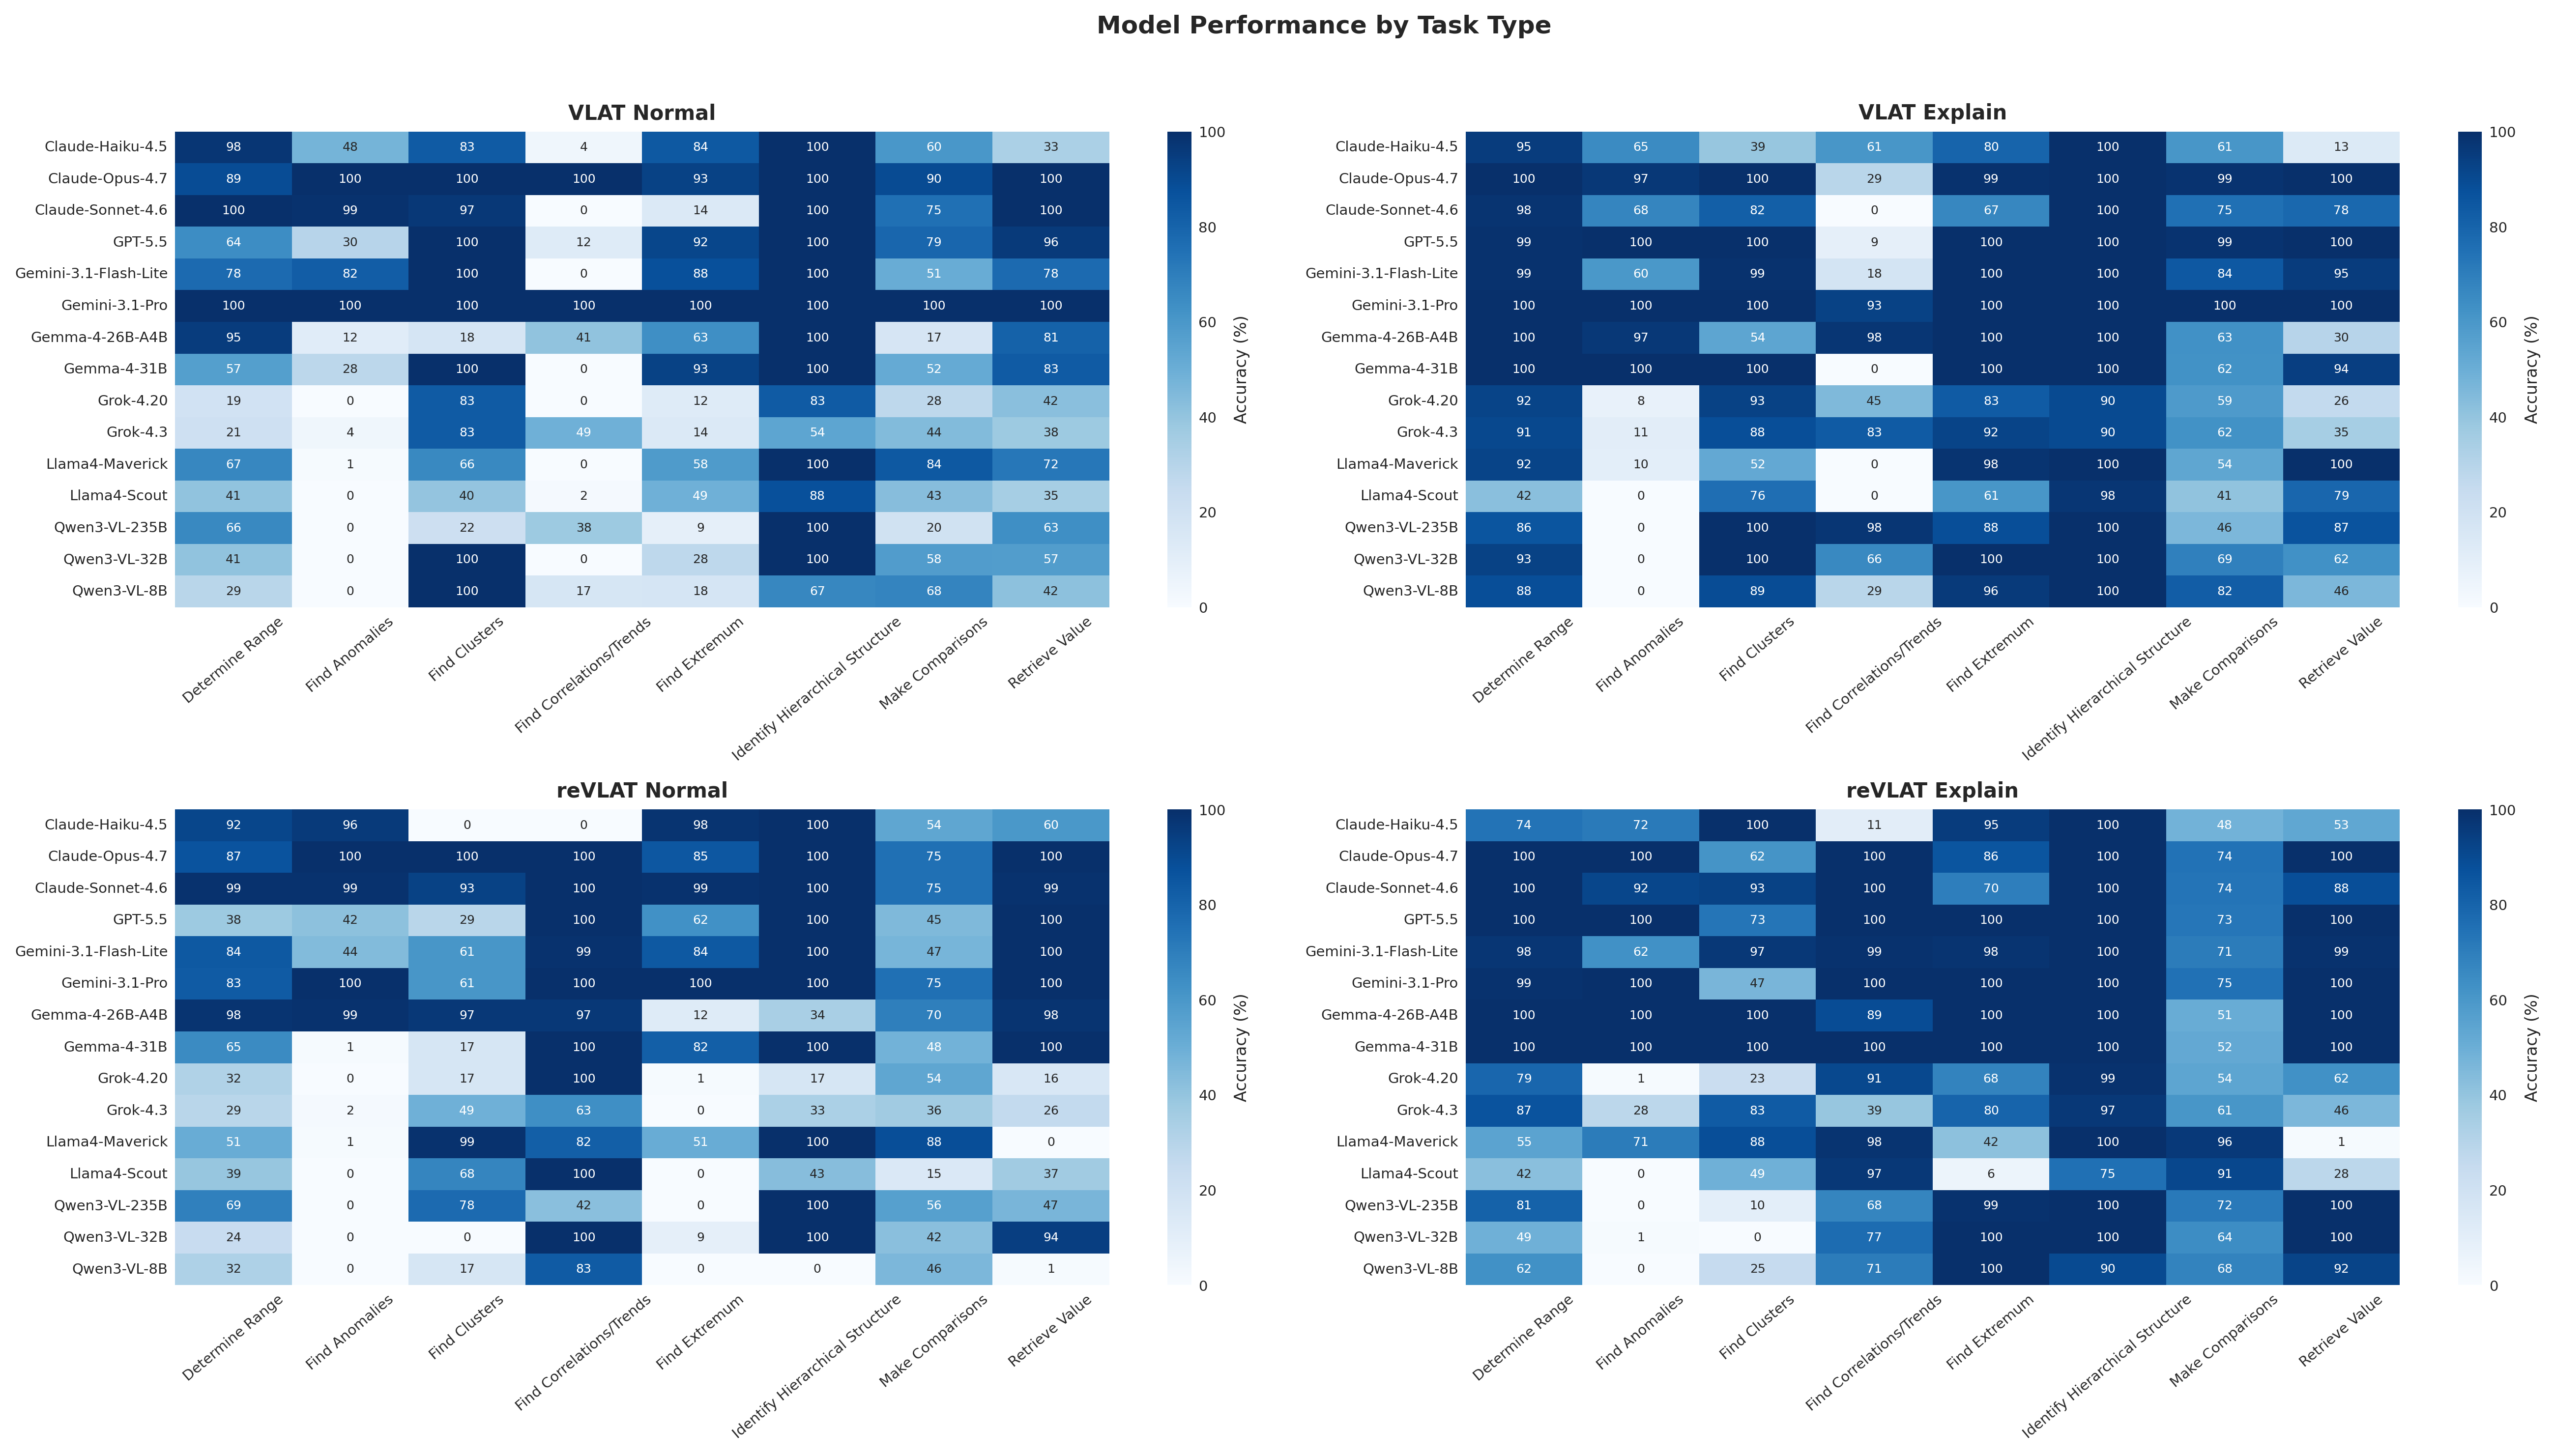
Figure 5: Task-type analysis for VLAT and reVLAT displays variable sensitivity of LVLMs to underlying task domain.
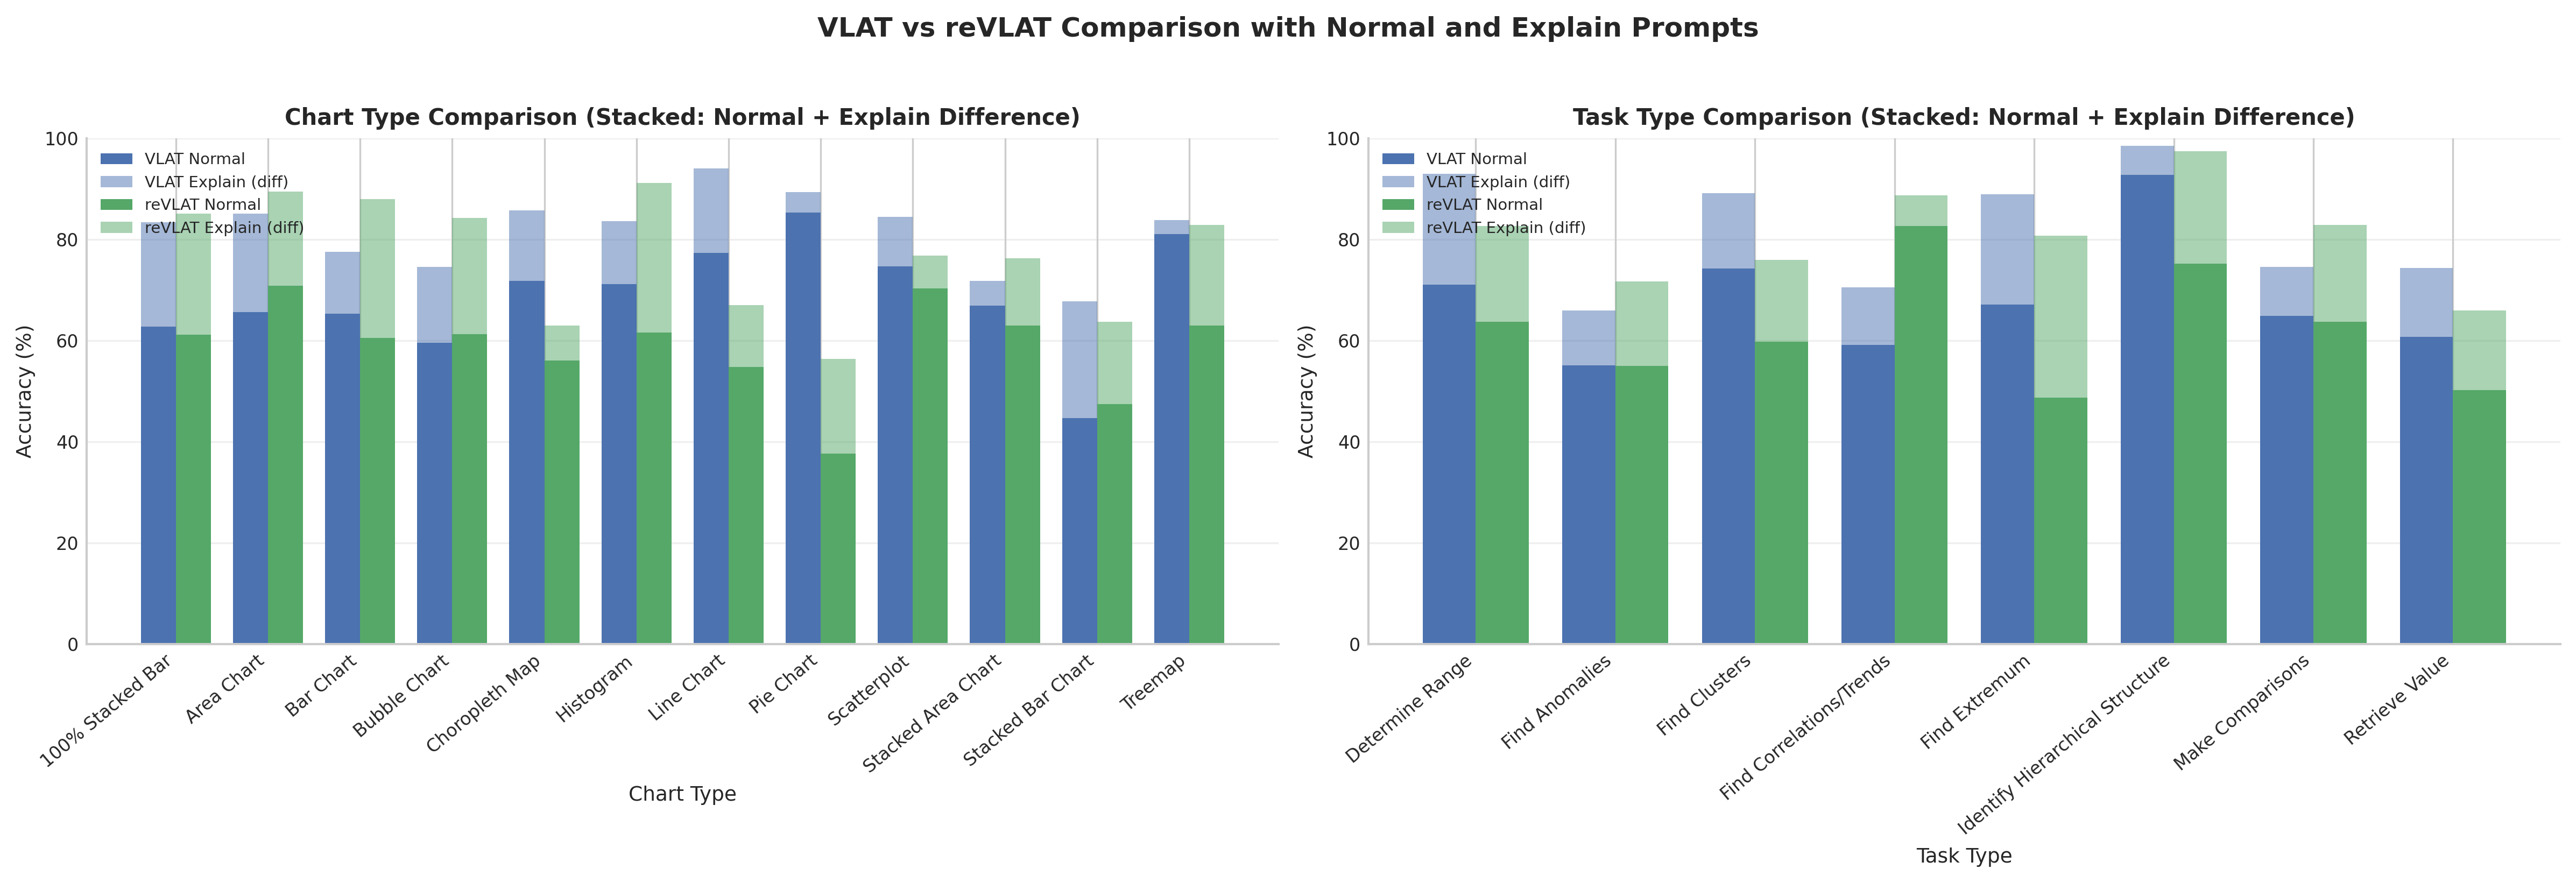
Figure 6: Side-by-side performance for chart and task types, emphasizing the additive benefit of Explain prompts and the effect of randomization.
Model Behavior under Visual–Factual Conflict
CVLAT responses, coupled with capability references, reveal two dominant classes of model behavior:
- Visualization-Oriented Models: Prioritize what is visually encoded even in the face of contradictory facts.
- Factual Knowledge-Oriented Models: Override chart evidence to produce factually correct, but visually incorrect, answers.
The capability-corrected VFRI distinguishes between visual fidelity and factual prioritization within and across model families.
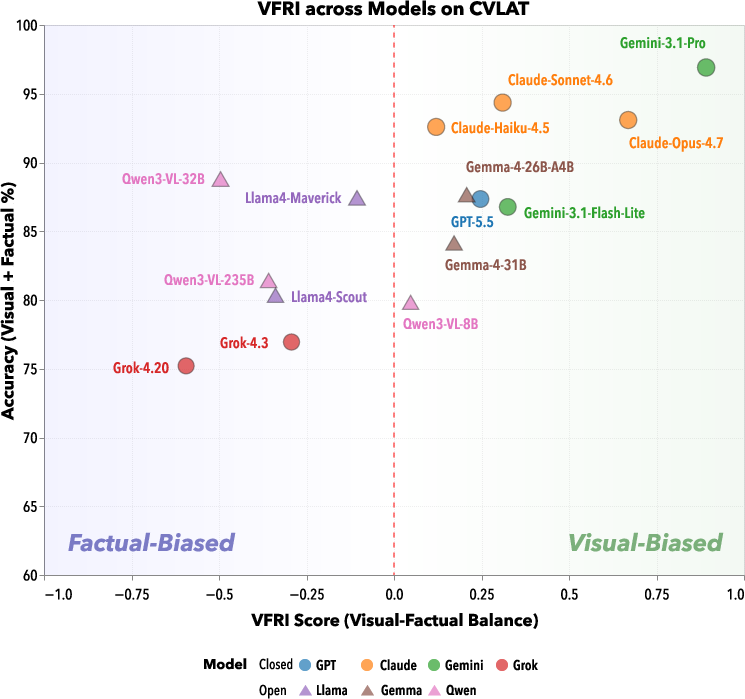
Figure 7: Scatterplot of accuracy against VFRI, showing that similar prioritization indices can be associated with divergent effective accuracies; marker types indicate source (proprietary/open) and family.
Empirical results indicate that Gemini-3.1-Pro and Claude-Opus-4.7 are strongly visualization-oriented (VFRI >+0.65), whereas Grok-4.20 and Qwen3-VL-32B are pronouncedly factual (VFRI <−0.5). In all cases, the human baseline is decisively visualization-oriented—no participant systematically preferred their own factual priors over image evidence.
Steerability via Prompt Engineering
Prompting analysis (Experiment 3) uncovers heterogeneity in model controllability:
- Some models, such as Claude-Opus-4.7 and Gemini-3.1-Flash-Lite, exhibit symmetric, bidirectional prompt-responsiveness, shifting VFRI to either extreme under the appropriate prompt.
- There are F-priority-insensitive and V-priority-insensitive models, which only comply with one direction of prompt, thus displaying substantial behavioral rigidity.
- A minority of models (Qwen3-VL-32B/235B) show a "collapse" pattern where factual-priority prompts paradoxically increase visual reliance, attributed to a deliberation-activation mechanism observed through completion lengths.
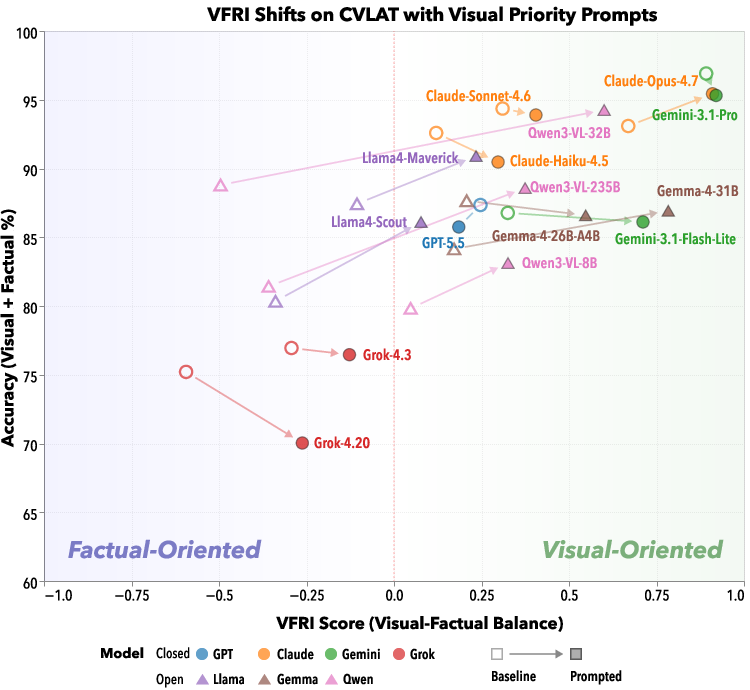
Figure 8: Visual-priority prompt shifts move VFRI rightward, quantifying the degree to which models can be compelled toward visual evidence.
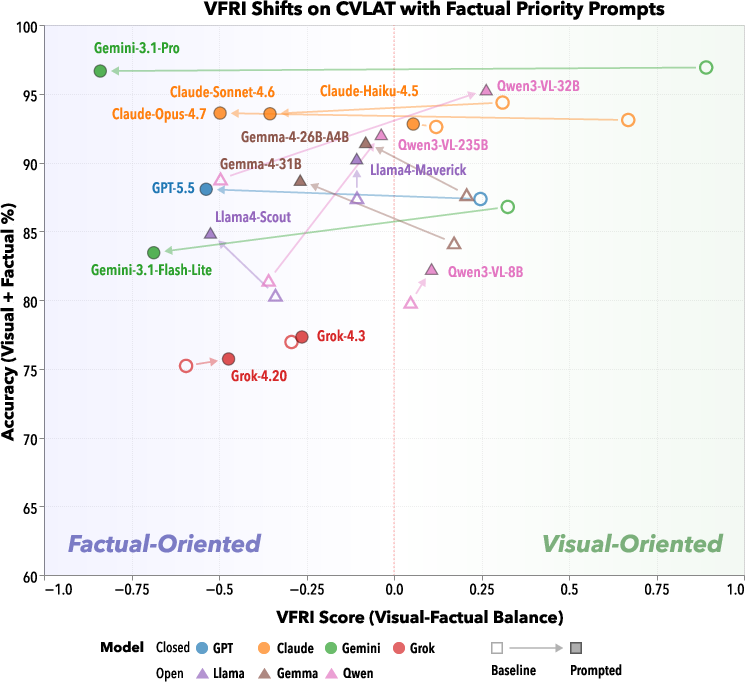
Figure 9: Factual-priority prompt effect: leftward VFRI shifts are observed for some models, while anomaly cases show rightward movements.
Implications
Theoretical and Practical Consequences
This disentanglement challenges the use of standard visualization literacy metrics for LVLMs by demonstrating that correct answers can mask fundamentally different decision strategies. The existence of distinct, empirically separable "visual" and "factual" LVLMs—sometimes within a single model family—implies that accuracy benchmarks are insufficient for model selection in high-stakes analytic workflows. Model output cannot be presumed to reflect visual reasoning unless arbitration is explicitly controlled or measured.
For system design, visualization-oriented LVLMs are preferred in analytic contexts demanding veridicality with the presented visual evidence (e.g., scientific data review), whereas factual-oriented models could be beneficial in environments prone to adversarial or deceptive charting practices.
Prompt engineering offers only partial and asymmetric control over prioritization. Controllability cannot be inferred from visual literacy scores; it must be directly probed, particularly in systems where users require reliable toggling between visual and factual reasoning modes.
Limitations and Future Prospects
The current evaluation focuses on conventional chart types and English-language stimuli. Further investigation is required for complex visualizations, multilingual models, and the effects of fine-tuning for robust information arbitration. Understanding architectural or data-centric modifications that lead to more predictable and controllable prioritization is an open question, as is developing adaptive frameworks that tailor difficulty and stimulus construction to model-specific capability profiles.
Conclusion
Disentangling visual and factual correctness in LVLMs' visualization literacy provides critical insight into foundational model behaviors that inform both evaluation and deployment. The introduction of CVLAT, robust benchmarking, and analytic metrics like VFRI not only diagnose current system limitations but also guide model selection and interface design for future AI-driven analytics systems. Reliable LVLM integration into visual analytics must transcend traditional literacy benchmarks, adopting multidimensional evaluations that expose and, where possible, operationally control underlying arbitration strategies between vision and knowledge.
Figure 1: A bubble chart with contradictory encodings for Mars and Jupiter, the prototypical scenario illustrating the principal research question.
Figure 2: The quadrant analytic framework that underpins the disentanglement methodology presented throughout the paper.
Figure 7: Relationship between VFRI, accuracy, and model family, demonstrating that similar global indices can mask substantial variability in error rates and prioritization tendency.
Figure 8: Example VFRI and accuracy trajectory for models under visual-priority prompt manipulation, visualizing model control limits.