- The paper presents a full lifecycle power management framework that scales a 150 MW datacenter with 83,000 GPUs by optimizing per-GPU power limits to maximize throughput.
- It applies rigorous empirical calibration and P70-based aggregation methods to correct measurement biases and ensure reliable performance validation.
- A dynamic, hierarchy-aware controller recovers an extra 2–4% throughput by exploiting underutilized power while integrating power and cooling considerations.
End-to-End Power Management for Hyperscale AI Clusters: Analysis of "Provisioning to Runtime Optimization of a +100 MW AI Cluster"
Overview
"Provisioning to Runtime Optimization of a +100 MW AI Cluster" (2605.24461) provides a comprehensive analysis of power management for hyperscale AI clusters, specifically focusing on a 150 MW datacenter with 83,000 NVIDIA GB200 GPUs. The study reports in-depth experiences and findings across the entire lifecycle of AI cluster deployment, from initial power planning (provisioning), through deployment validation, to dynamic runtime operations. This work is notable for its empirical grounding, the scale of infrastructure considered, and the integration of power-aware methodologies with the practical constraints of modern AI workloads and datacenter architecture.
Datacenter Architecture and Power Delivery
The paper describes an air-cooled, multi-building datacenter with modular power distribution and distinct failure domains, emphasizing heterogeneity in rack and hardware types. The compute core is the "Catalina pod" (Figure 1), customized to maximize per-GPU network bandwidth and throughput by doubling network I/O versus NVIDIA GB200 reference designs.
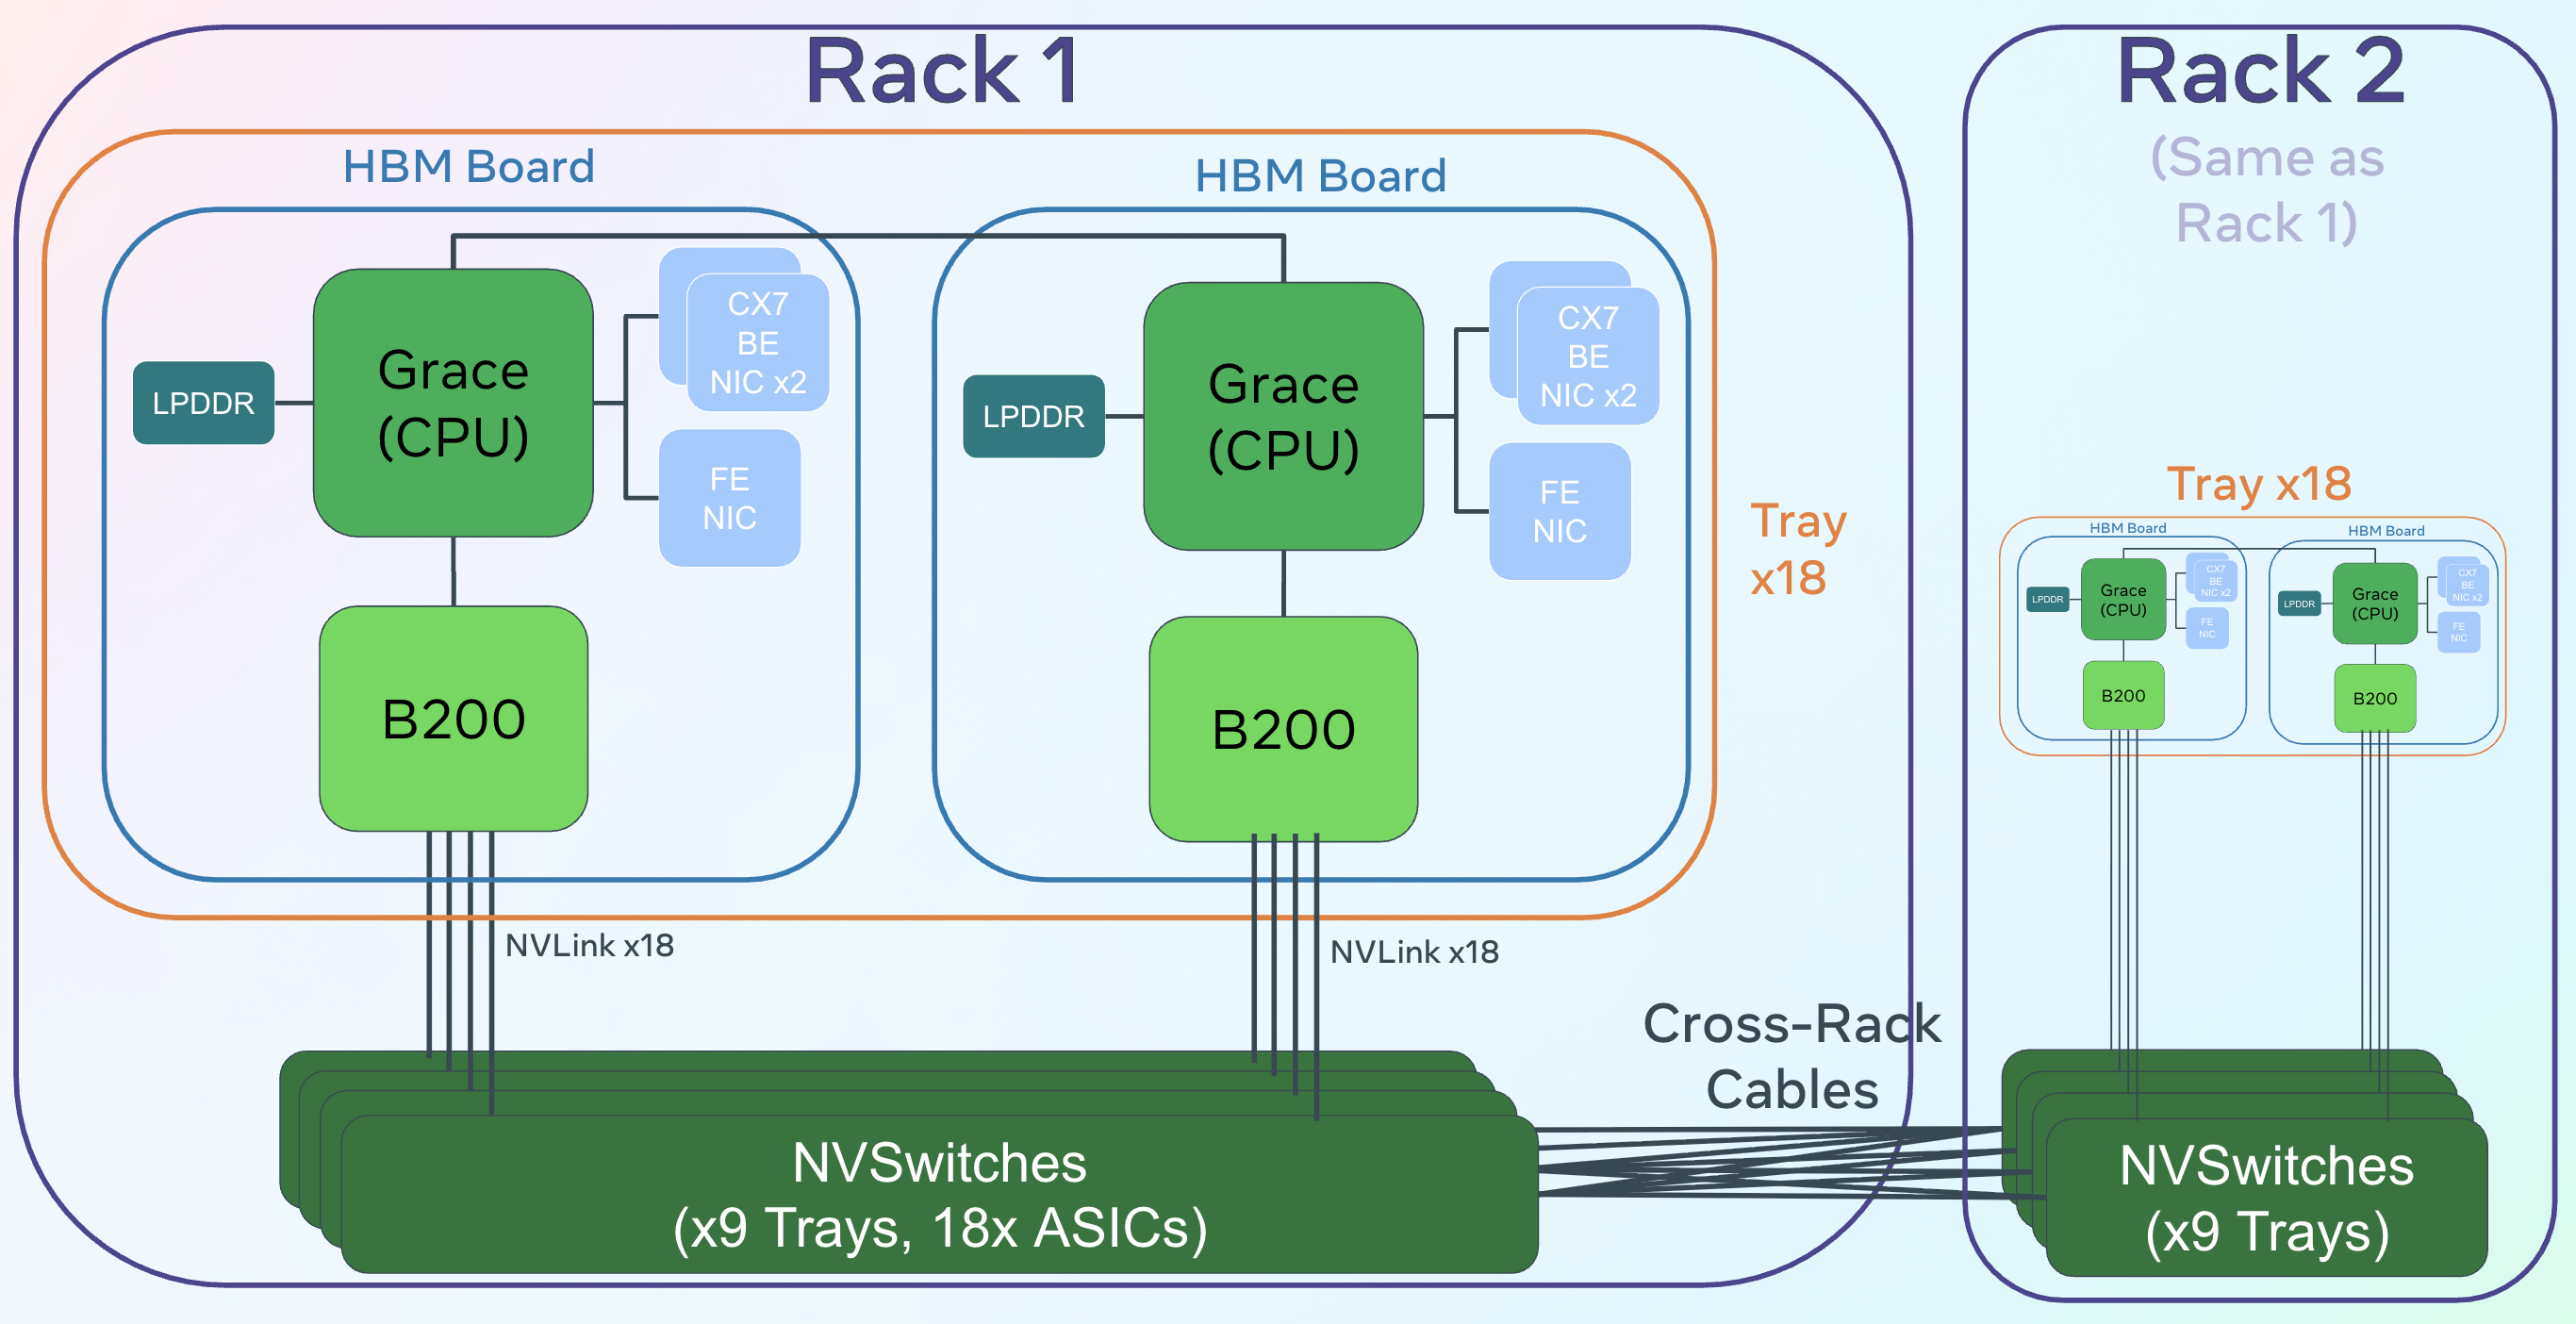
Figure 1: The Catalina pod GB200 configuration.
The backend networking is RDMA-centric and highly hierarchical, illustrated in Figure 2, facilitating optimized spray for packet entropy across the fabric. Performance modeling demonstrates the substantial impact of back-end networking bandwidth when scaling the cluster size (Figure 3).
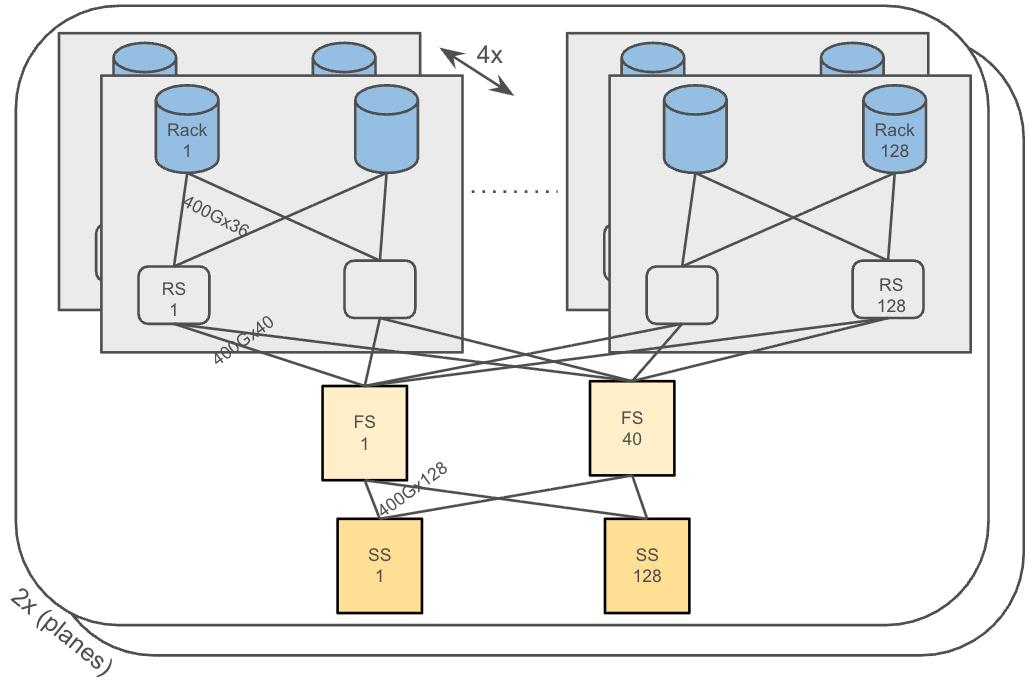
Figure 2: Back end network schematics featuring a three-level hierarchy to provide high-entropy packet distribution.
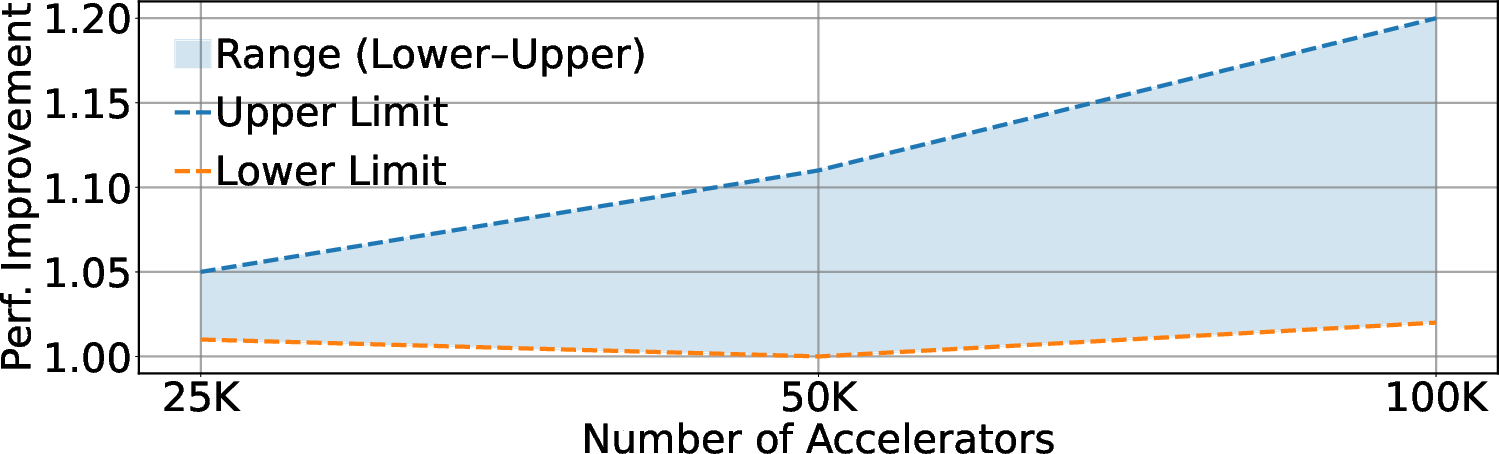
Figure 3: Performance improvement realized when moving from 50GB/s to 100GB/s per-GPU bandwidth as cluster size increases.
Thermal management eschews facility-provided liquid cooling in favor of distributed Air Assisted Liquid Cooling (AALC), resulting in a complex rack composition (Figure 4). The power distribution network consists of Main Switch Boards (MSBs), intermediate switchboards, and Reactor Power Panels (RPPs), with fine-grained monitoring and significant heterogeneity in headroom (Figure 5).
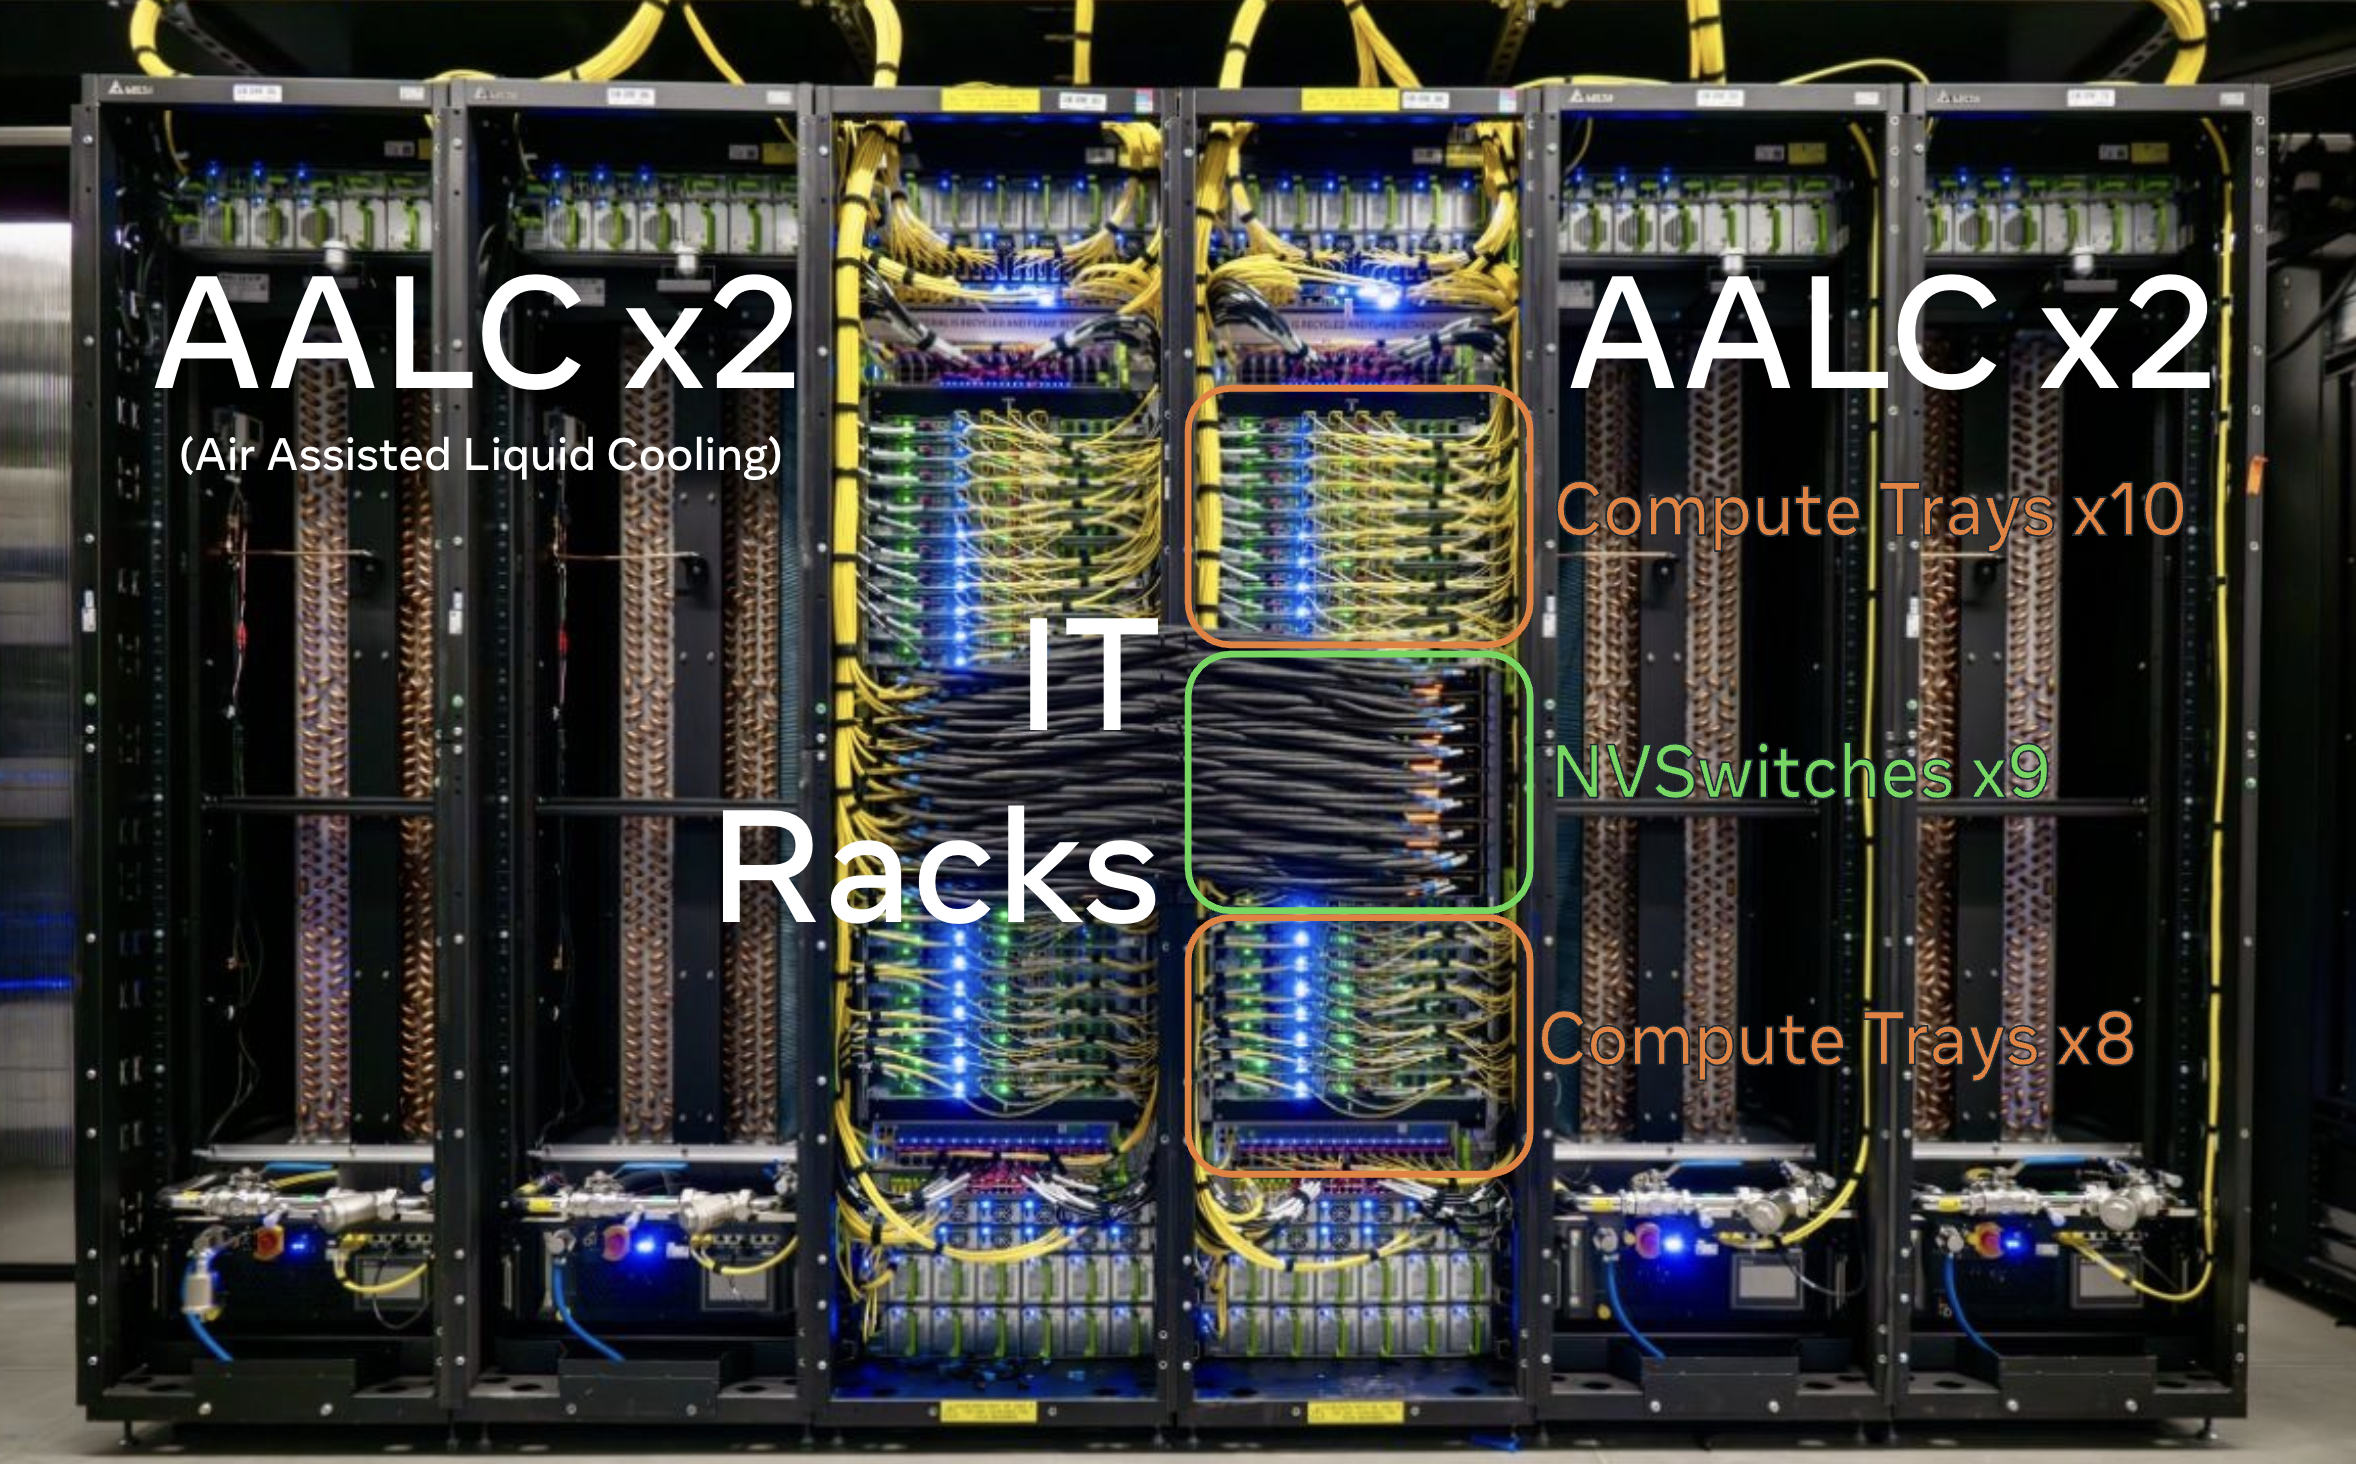
Figure 4: A Catalina-based pod with interconnected IT racks and AALC units, each rack hosting 36 GB200 GPUs for dense deployment.
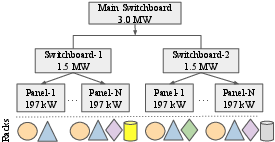
Figure 5: Schematic of power delivery hierarchy showing heterogeneous rack types and variable power headroom across domains.
Three-Phase Power Management Pipeline
Phase 1: Provisioning and Early Planning
Planning must be finalized 6–12 months before hardware availability, relying on modeled power/performance curves and conservative derating factors. Unlike historical reliance on max-TDP, optimal decisions target cluster-level performance per watt, selecting power limits (80% of TDP per GB200) maximizing aggregate throughput, not peak per-GPU performance.
Empirical analysis (Figures 9 and 10) revealed:
- Near-linear FLOPS decline down to ∼1000W, with sharp degradation at lower limits.
- HBM bandwidth remains stable until <900W.
- Workload arithmetic intensity modulates sensitivity to power capping.
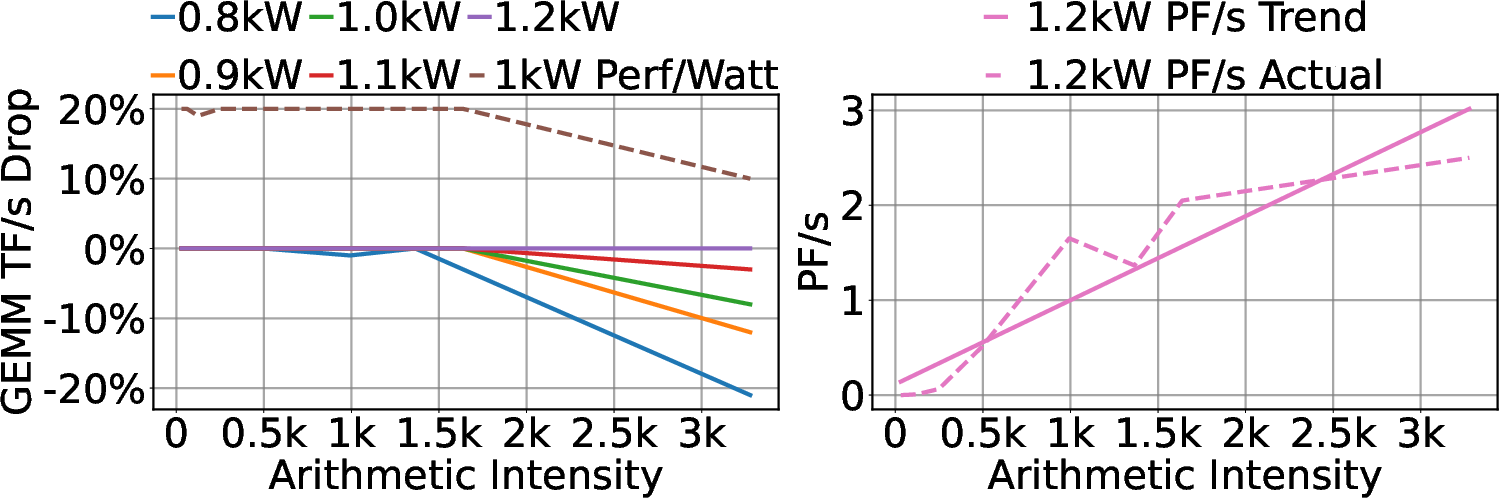
Figure 6: GB200 FP8 FLOPS versus power limit, showing inflection as power cap drops below 1000W.
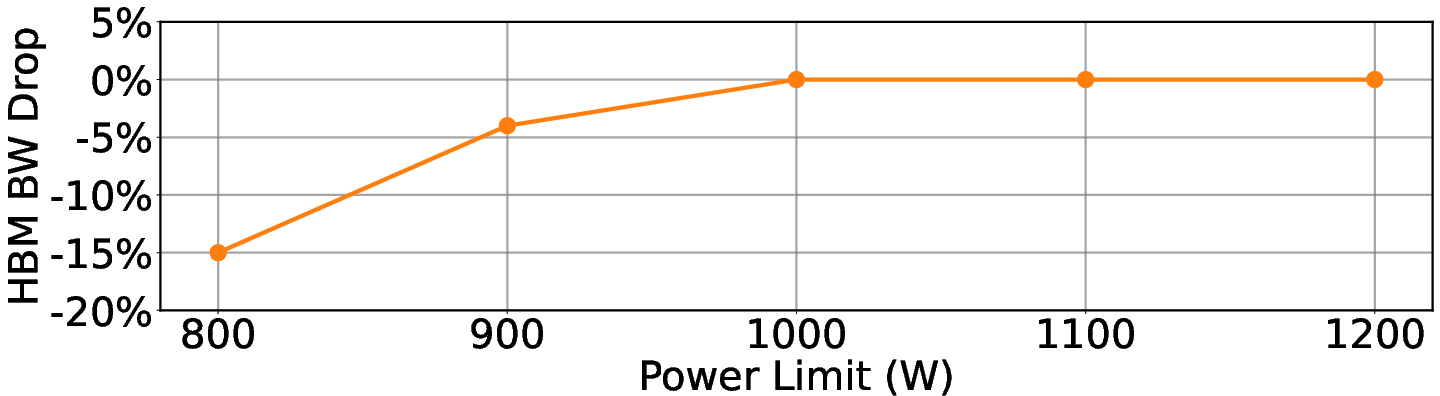
Figure 7: HBM bandwidth is insensitive to power limit until a threshold, then declines sharply at lower values.
Consequently, under fixed cluster budgets, reducing per-GPU power can increase total cluster throughput (Figure 8) due to higher GPU count, with the optimal point identified ∼960–1000W per GB200 (80–83% TDP).
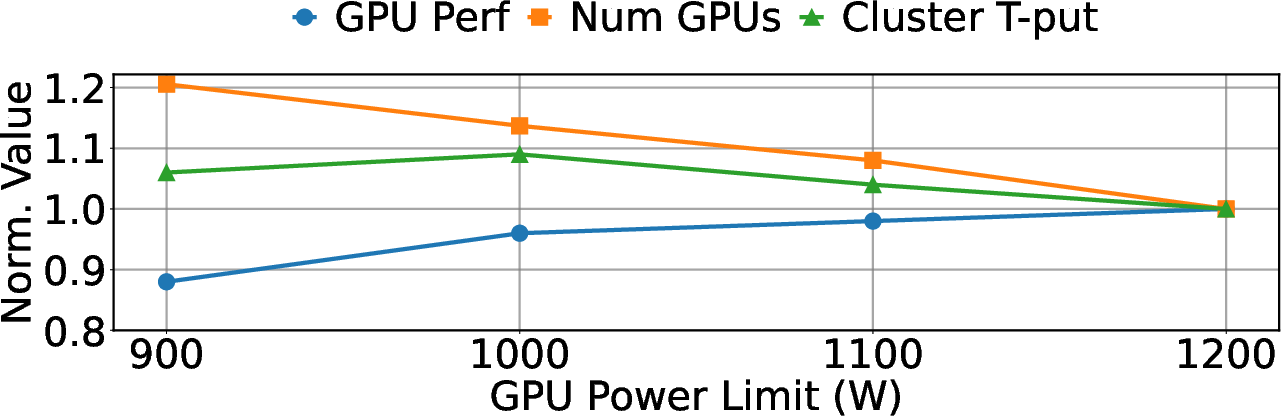
Figure 8: Tradeoff between per-GPU power and cluster throughput, demonstrating non-monotonic dependencies due to density and architectural limits.
Phase 2: Deployment Validation
Upon hardware arrival, live measurements calibrate earlier models. Fleet telemetry, dominated by PSU-integrated sensors, systemically overestimates rack power. Rigorous cross-validation with oscilloscope and RPP-level Data Center Infrastructure Management (DCIM) sensors (Figure 9 and Figure 10) supports using the 70th percentile (P70) of PSU samples as an unbiased estimator for aggregate power (Figure 11, Figure 12).
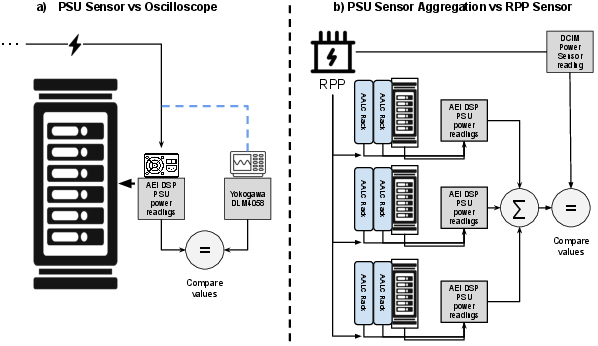
Figure 9: Validation of PSU measurements using reference-grade oscilloscope and RPP DCIM sensors.
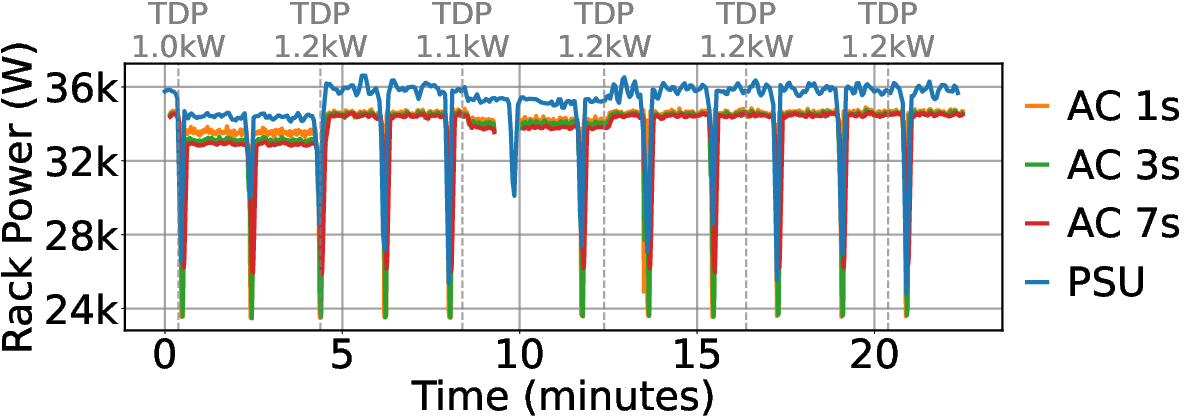
Figure 10: PSU measurements compared with oscilloscope readings, highlighting systematic overestimation.
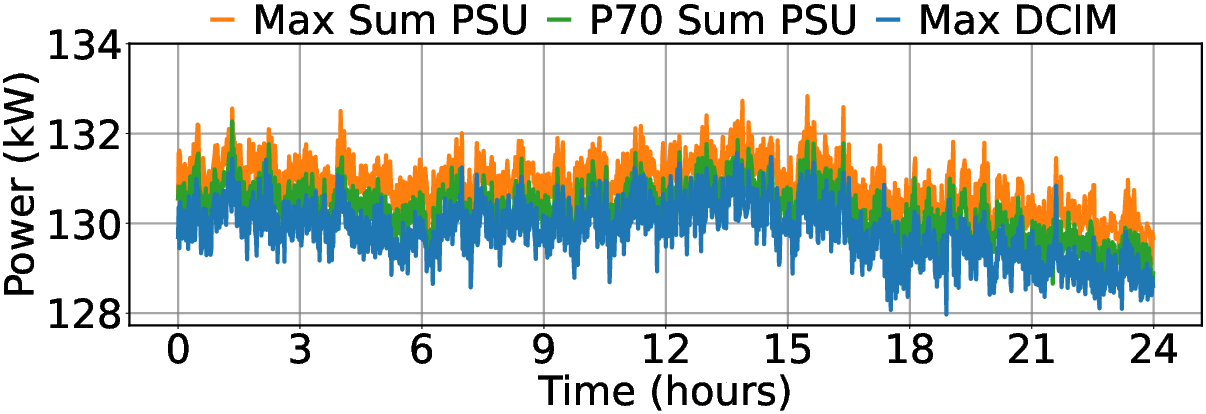
Figure 11: DCIM-PSU maximum value agreement is optimal using the P70 aggregation of PSU readings.
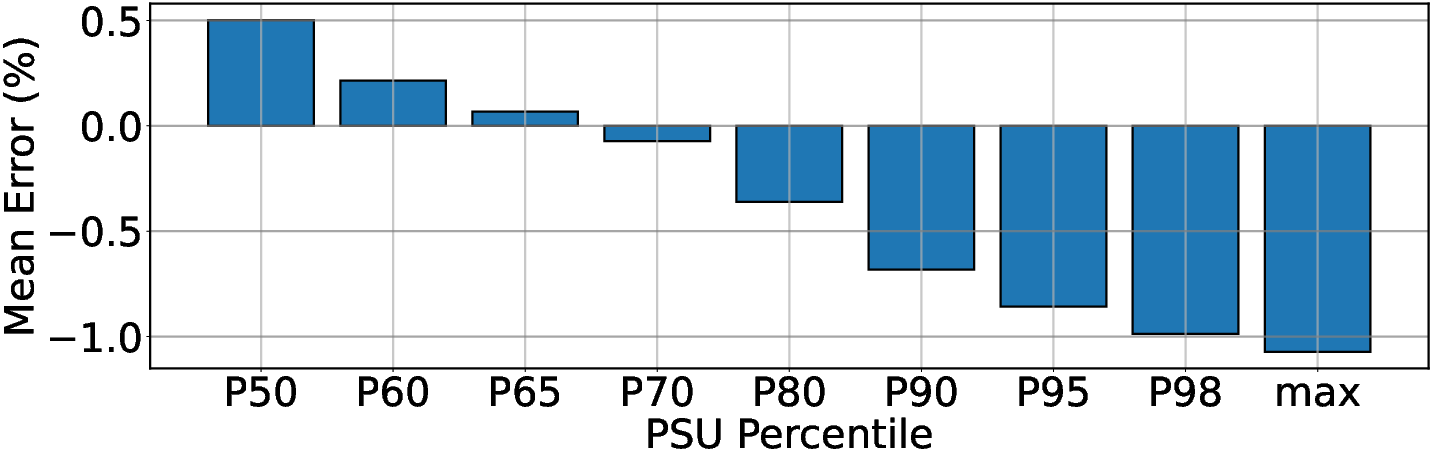
Figure 12: Error analysis of aggregation methods confirms P70 minimizes bias.
Static placement and hardware heterogeneity cause significant, persistent power imbalance. Headroom CDFs (Figures 16–19) at MSB and RPP levels show that while average buffer can be $100$–$200$W/GPU, a non-trivial fraction of power devices have much less, limiting any global boost in power allowance.
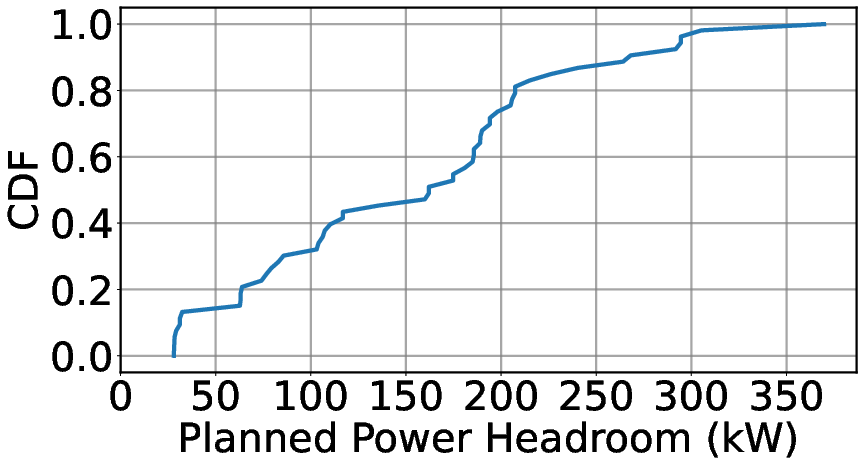
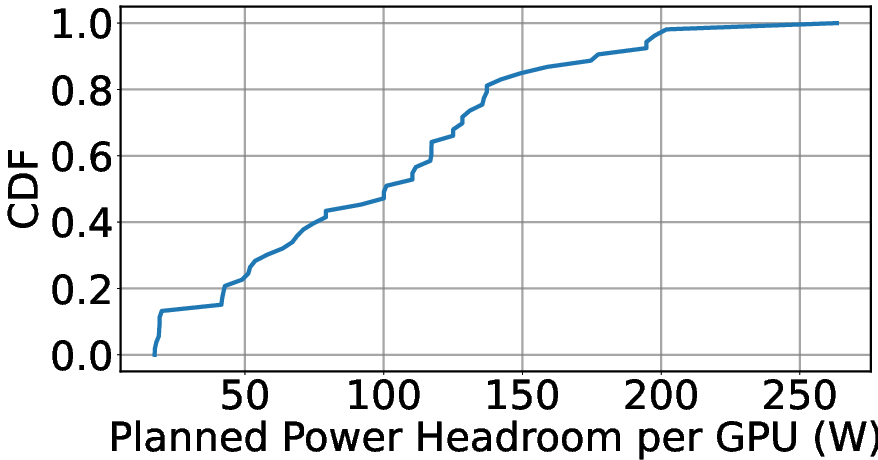
Figure 13: Planned power headroom distribution per MSB—variance indicative of structural placement heterogeneity.
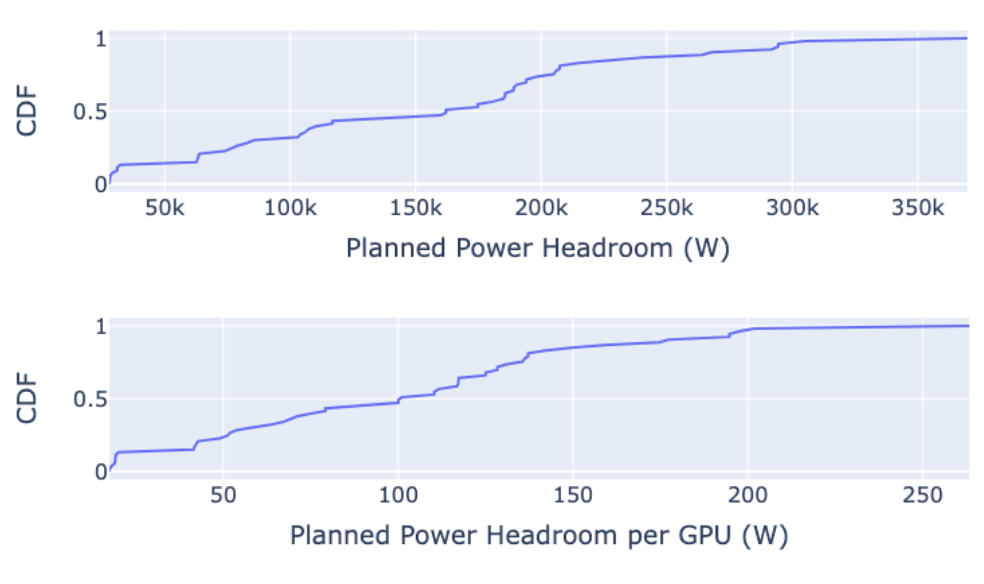
Figure 14: Planned power headroom distribution per MSB in absolute terms, corroborating cluster-level asymmetry.
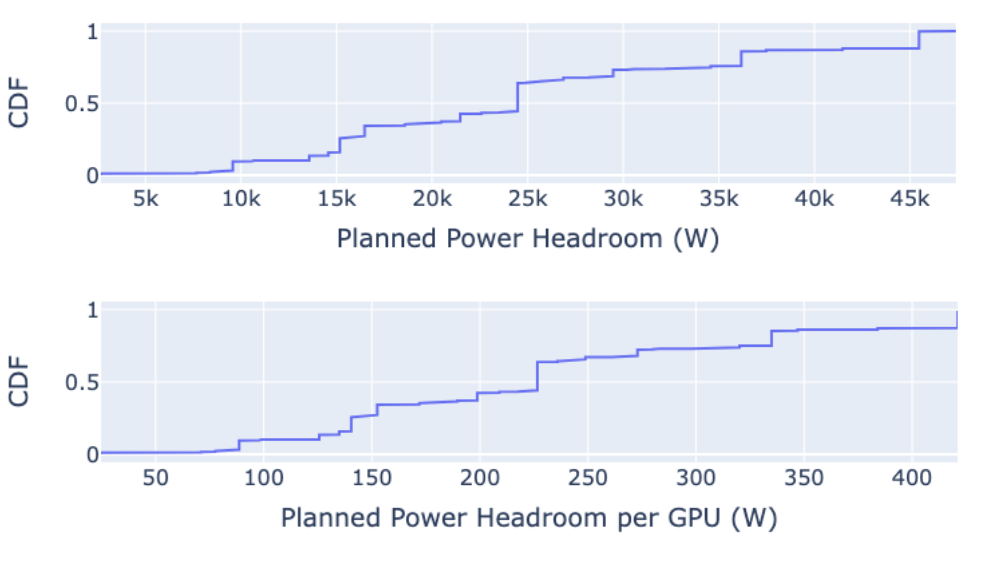
Figure 15: Distribution across RPPs, showing less severe but still significant variation, especially at the tail.
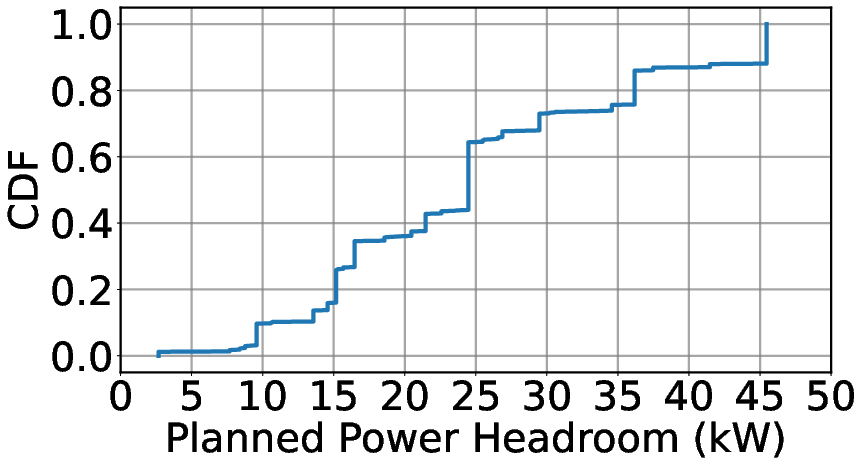
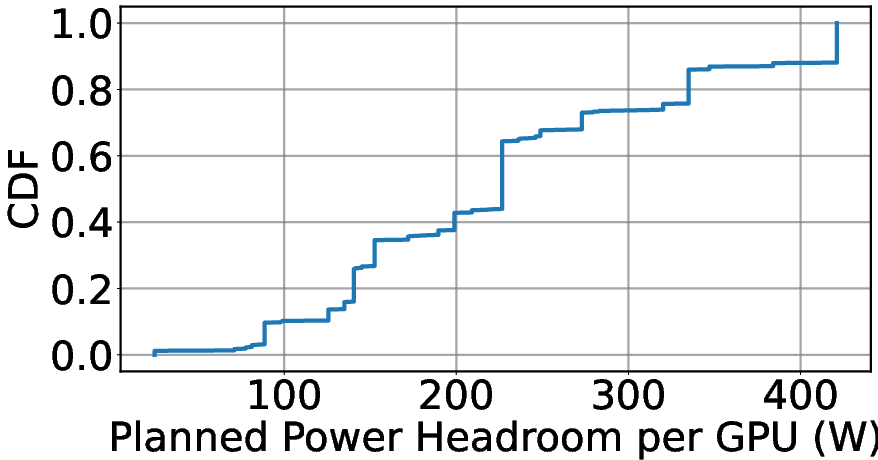
Figure 16: Per-GPU planned headroom illustrating the practical limit on runtime up-capping.
Seasonal cooling load, particularly in summer (Figures 6 and 8), further constrains available IT power, in some cases exceeding engineered estimates for short periods and necessitating dynamic adjustment.
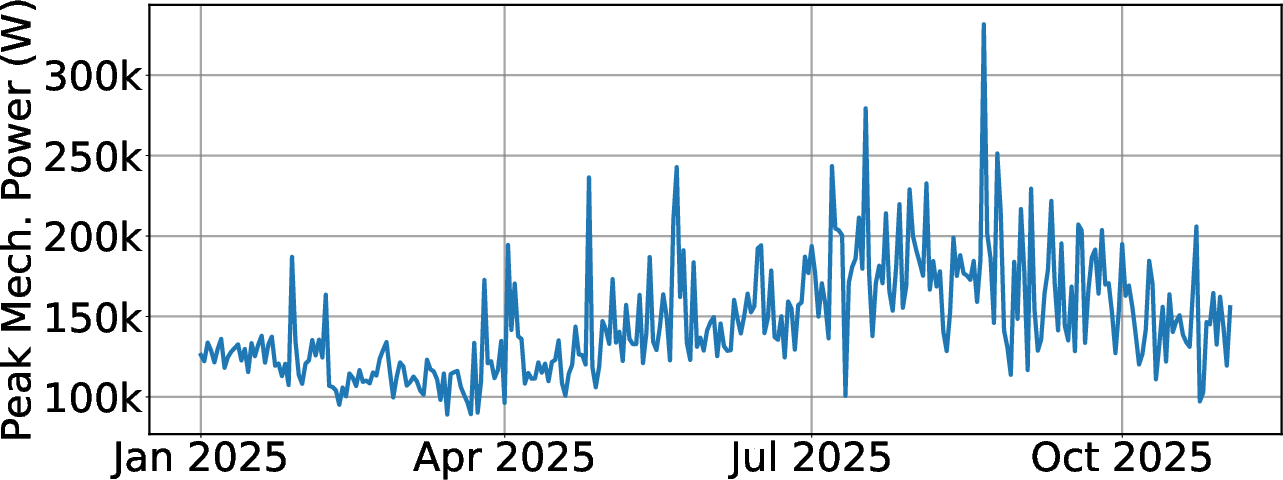
Figure 17: Daily mechanical peak-minute power, revealing clear seasonality and correlated cooling load variability.
Figure 18: During transient summer heat, mechanical load can temporarily breach planned envelopes, requiring buffer design.
Phase 3: Runtime Operation and Dynamic Power Management
Having decoupled provisioning and operational rack power, the system can exploit remaining headroom for runtime up-capping. Microbenchmarking shows that raising the GB200 power cap from 960W to 1020W is feasible for much of the cluster, realizing an extra 2–3% in throughput for applicable workloads (Figure 19).
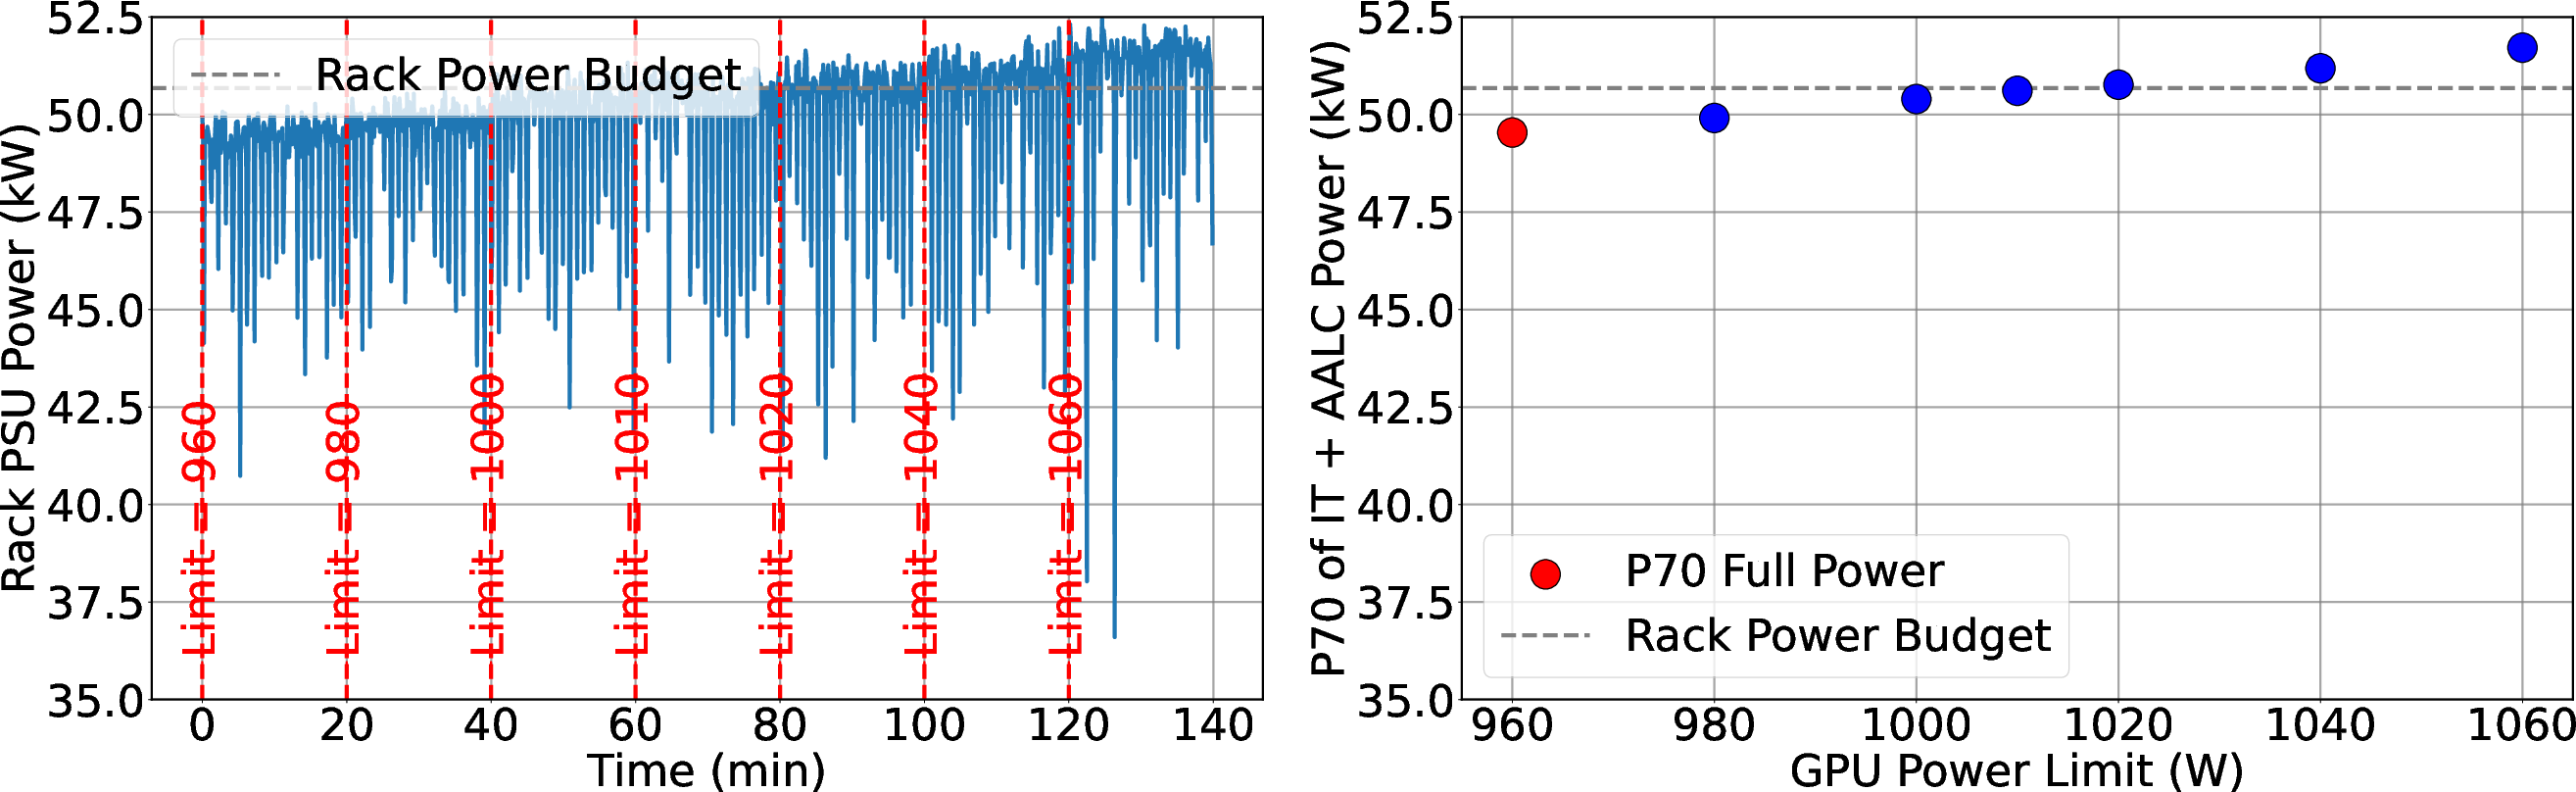
Figure 19: Real-time power consumption under dense Transformer load confirms safe headroom for moderate cap increases.
To capture fleeting transient power, a fleetwide dynamic capping controller (Dimmer) is deployed. Rather than local rack-level action, Dimmer responds to near-limit conditions by collaboratively and smoothly lowering the cap for all affected GPUs in a power domain, minimizing straggler risk in synchronous workloads. It exploits both spatial and temporal smoothing (as permitted by breaker time constants).
Large, synchronous jobs induce oscillatory cluster-scale power swings, so a novel software-based "power smoother" launches synthetic kernels on idle GPUs during communication/computation valleys to stabilize aggregate draw and avoid grid-impacting spikes (Figure 20).
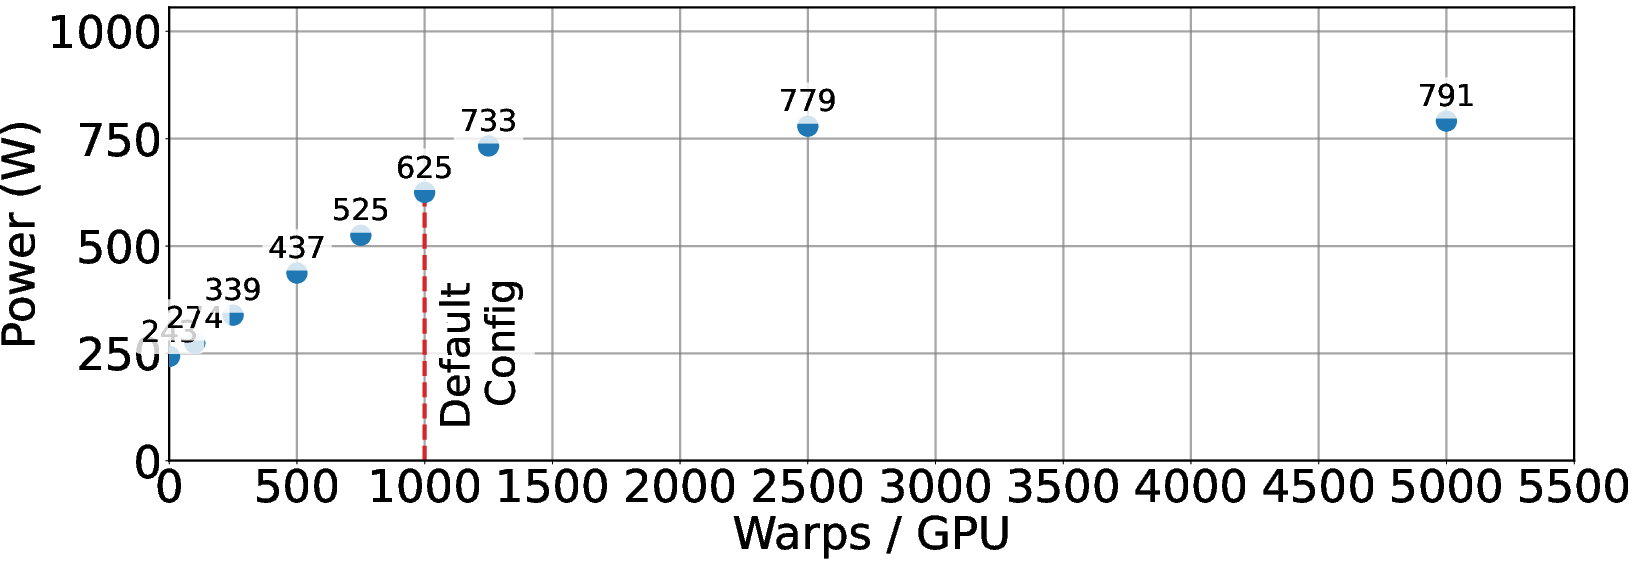
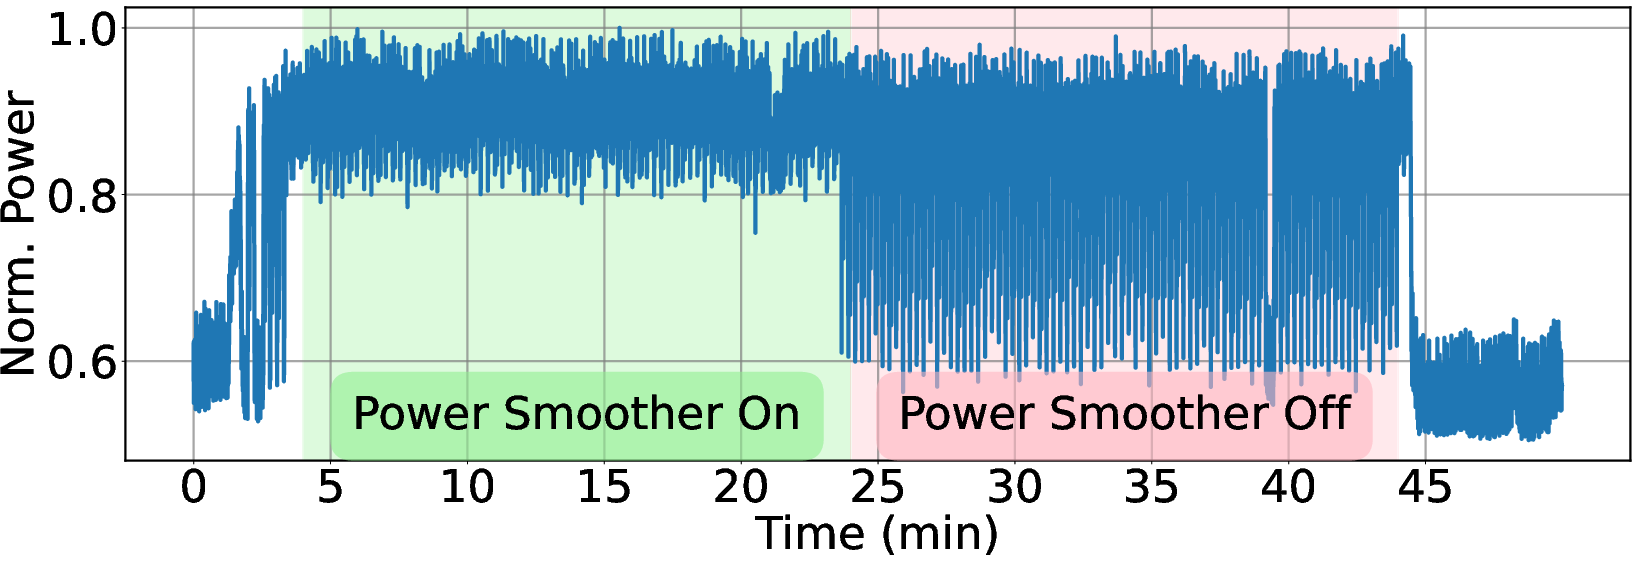
Figure 20: A synthetic software-based power smoother fills communication-valley gaps, keeping average power stable within <3\% performance impact.
Implications for AI Infrastructure
Empirical results demonstrate several key points and actionable insights:
- Cluster Perf/Watt is maximized by running thousands of AI accelerators at less than their peak TDP, not maxing-out per-GPU settings. The cluster-level effect is a non-linear, often super-linear function of power per device and device density.
- Proper derating (typically to 80–85% TDP) at the provisioning stage can improve aggregate throughput by ∼10% over naive deployment.
- Dynamic, hierarchy-aware runtime controllers can safely recover an additional 2–4% by leveraging underutilized power in unconstrained paths.
- Network and cooling subsystems must be provisioned with the same rigor as compute; neglecting these can strand compute power or force premature throttling.
- Existing hardware telemetry is often systematically biased; large-scale operation requires robust cross-layer calibration and temporal/statistical smoothing.
Limitations and Recommendations for Future Research
Existing architectural and scheduling frameworks are suboptimal for the emerging landscape of +100 MW clusters:
- There is no cross-layer, workload-aware power sharing between major SoC resources (GPU, CPU, HBM, interconnect), yet workload resource sensitivity varies (see Figures 9–11).
- Job scheduling currently optimizes for network placement/topology, largely ignoring the power headroom tree, which leads to unnecessary stranding or overconservatism.
The authors call for formal models that integrate network and power trees, pursuing joint optimization via mixed-integer nonlinear programming, acknowledging complexity but anticipating tractable approximations.
Conclusion
"Provisioning to Runtime Optimization of a +100 MW AI Cluster" (2605.24461) systematically advances the state of the art in AI datacenter power management. Rather than narrowly focusing on device-level energy minimization or isolated operational heuristics, the work demonstrates that maximum system throughput and utilization arise from cross-layer, cross-phase co-design: optimizing provisioning, actively validating deployments, and dynamically exploiting real-time headroom. The resulting framework yields empirical throughput uplifts of 10% or more for fixed budgets, and charts a clear roadmap for research in power-aware scheduling, architecture/software co-design, and robust fleetwide instrumentation—critical areas as the field moves toward exascale AI infrastructure.