- The paper introduces a novel focus-driven reasoning architecture that combines supervised finetuning and reinforcement learning with adaptive KL penalties.
- It uses a two-stage training pipeline and automated Focus-CoT generation to guide precise visual-linguistic reasoning on highly dense charts.
- The model demonstrates scalable reasoning depth and interpretability, achieving state-of-the-art performance across multiple dense chart QA benchmarks.
Chart-FR1: Visual Focus-Driven Fine-Grained Reasoning on Dense Charts
Introduction
"Chart-FR1: Visual Focus-Driven Fine-Grained Reasoning on Dense Charts" (2605.01882) presents a novel multimodal reasoning architecture tailored for dense chart QA scenarios. The proposed framework leverages a focus-driven reasoning paradigm, integrating visual focus cues to enable precise, stepwise visual-linguistic reasoning on charts characterized by high information density and multiple interacting elements. Chart-FR1 is built on the Qwen2.5-VL-7B backbone and introduces a two-stage training protocol combining SFT and group-relative policy optimization (GRPO), further enhanced with adaptive KL penalties. Extensive evaluations across established chart benchmarks and the newly introduced HID-Chart dataset demonstrate superior quantitative performance and robust interpretability in visual reasoning.
Model Architecture and Training Paradigm
The base model Qwen2.5-VL-7B, chosen for its competitive VL capabilities, serves as the foundation for Chart-FR1. The training pipeline operates in two distinct phases:
Cold-Start SFT: The initial stage applies supervised finetuning on curated chart QA data, providing the model with basic reasoning skills.
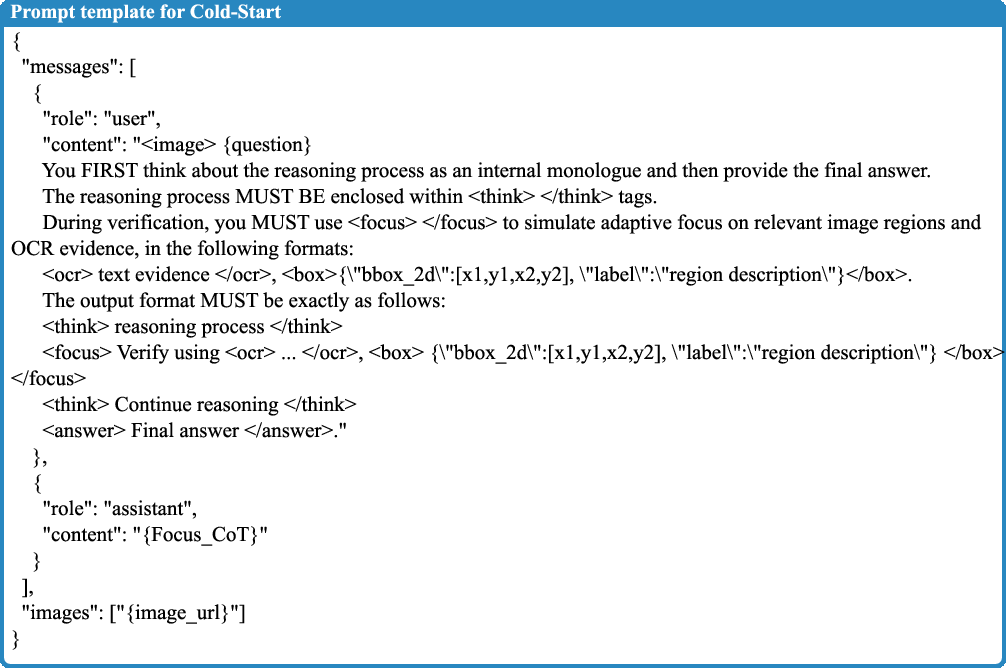
Figure 1: Cold-Start prompt template for training.
Focus-GRPO Stage: The second stage employs an RL-based procedure using Group Relative Policy Optimization, capitalizing on adaptive KL divergence penalties to foster longer reasoning chains as focus cues proliferate. Key hyperparameters, especially α, govern model performance stability and scaling, with empirical analysis revealing that α=2 yields optimal results across multiple benchmarks.
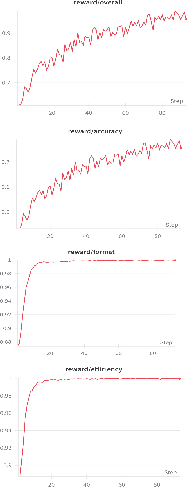
Figure 2: Reward curves during Focus-GRPO training illustrating reinforcement convergence and reward stabilization.
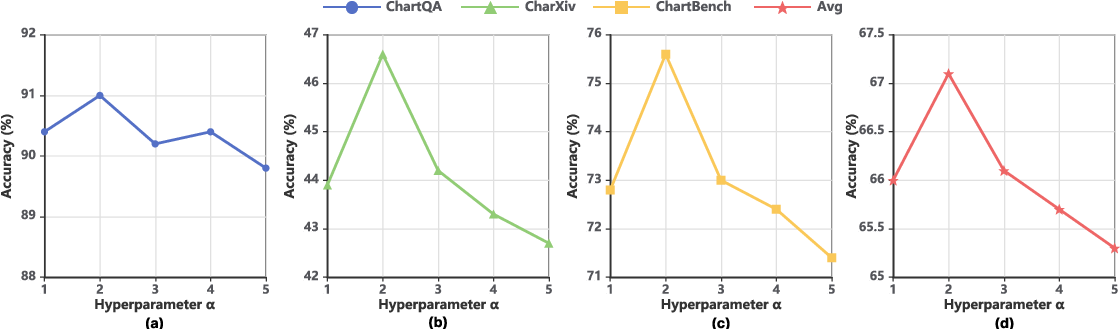
Figure 3: Impact of α on performance; α=2 achieves peak results in five chart QA benchmarks.
Adaptive KL penalties are demonstrated to dynamically modulate reasoning length in accordance with the complexity of the visual input, facilitating robust scaling to dense chart scenarios.
Focus-Driven Chain-of-Thought Generation
A critical innovation is the automated Focus-CoT generation pipeline, which synthesizes chain-of-thought exemplars guiding reasoning towards salient chart elements. The baseline Qwen2.5-VL-7B model generates initial CoT sequences, subsequently reconstructed by a GPT-5 agent to produce Focus-CoT samples further filtered for correctness via LLM judgment templates.
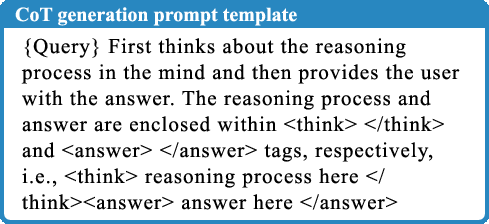
Figure 4: Template for baseline CoT generation prompting.
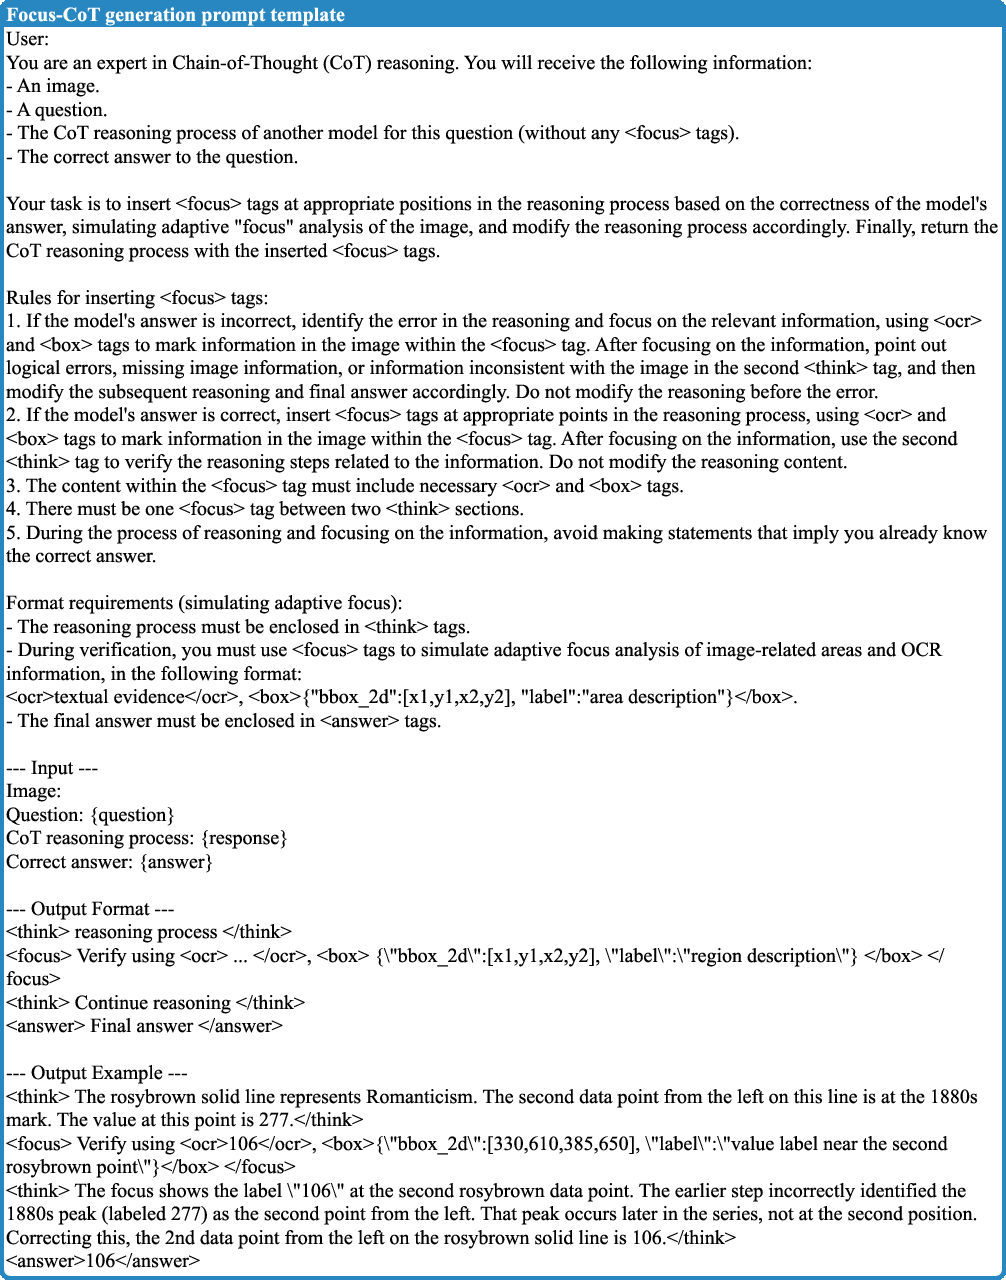
Figure 5: Template for Focus-CoT generation with GPT-5.
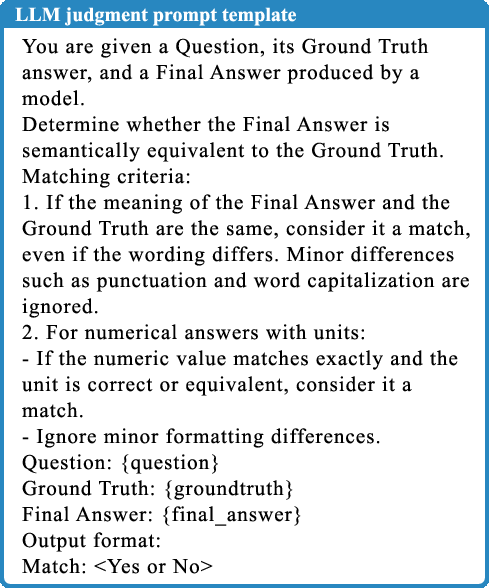
Figure 6: Template for LLM-based correctness filtering in Focus-CoT synthesis.
This pipeline enables precise reasoning supervision, augmenting the training data with linguistically and visually focused exemplars, which are instrumental in improving both accuracy and interpretability.
Evaluation Protocol and Data
Evaluation is conducted on widely accepted chart QA datasets: ChartQA, CharXiv, EvoChart, ChartBench, PlotQA, and the novel HID-Chart, which exhibits extreme information density. VLMEvalKit and vLLM are utilized for inference, and GPT-5 mini acts as the automated scorer, using detailed prompt templates for both answer generation and Chart-ID information density metrics.
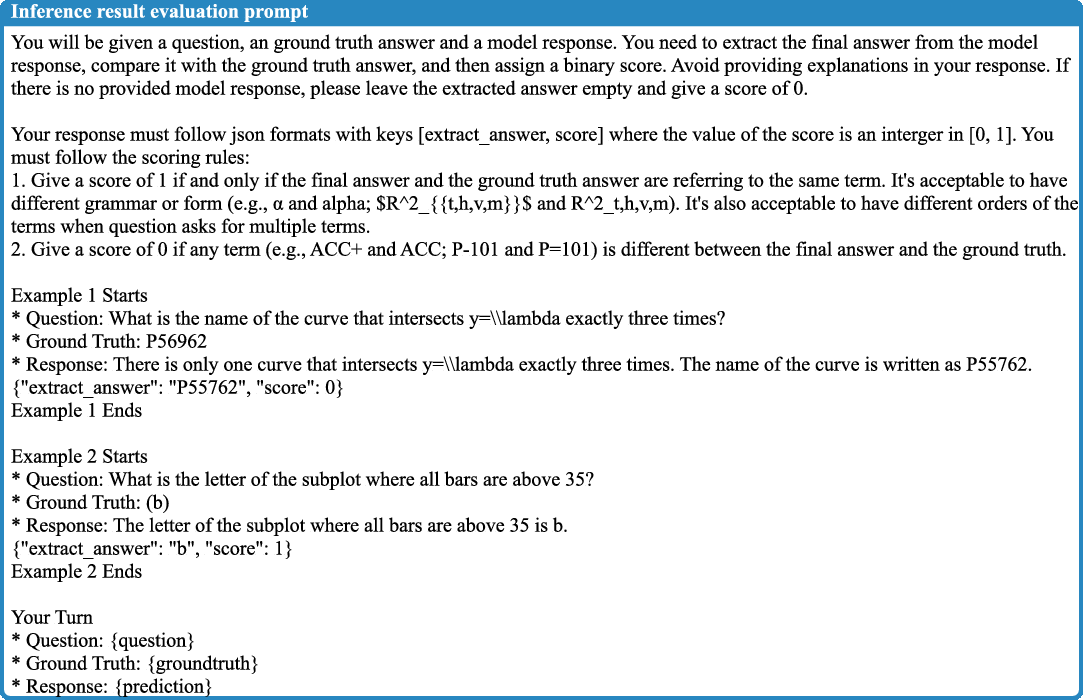
Figure 7: Evaluation prompt template utilized in benchmark scoring.
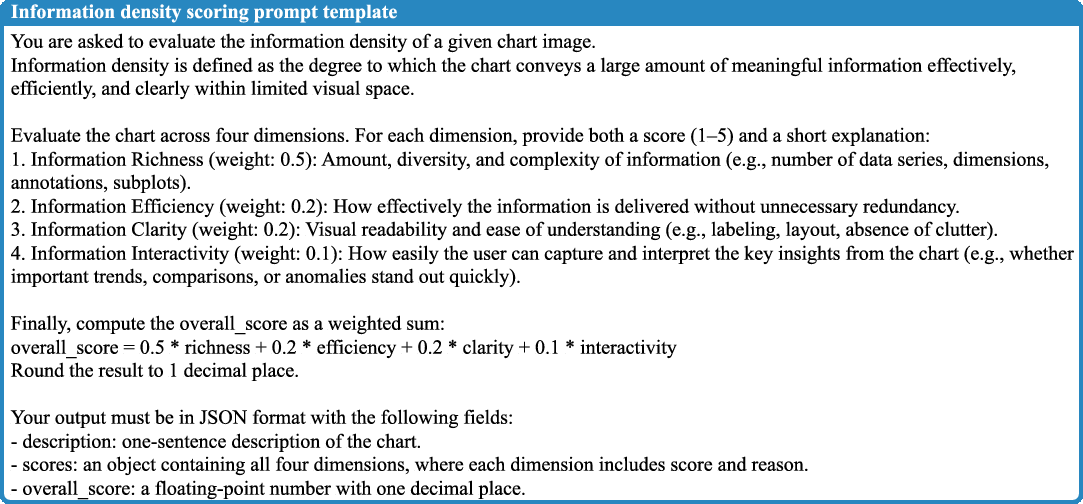
Figure 8: Chart-ID calculation template for measuring information density across charts.
Cold-Start and Inference Examples: The appendix illustrates diverse input-output pairs, demonstrating the model's capacity for fine-grained reasoning in both cold-start and dense inference contexts.
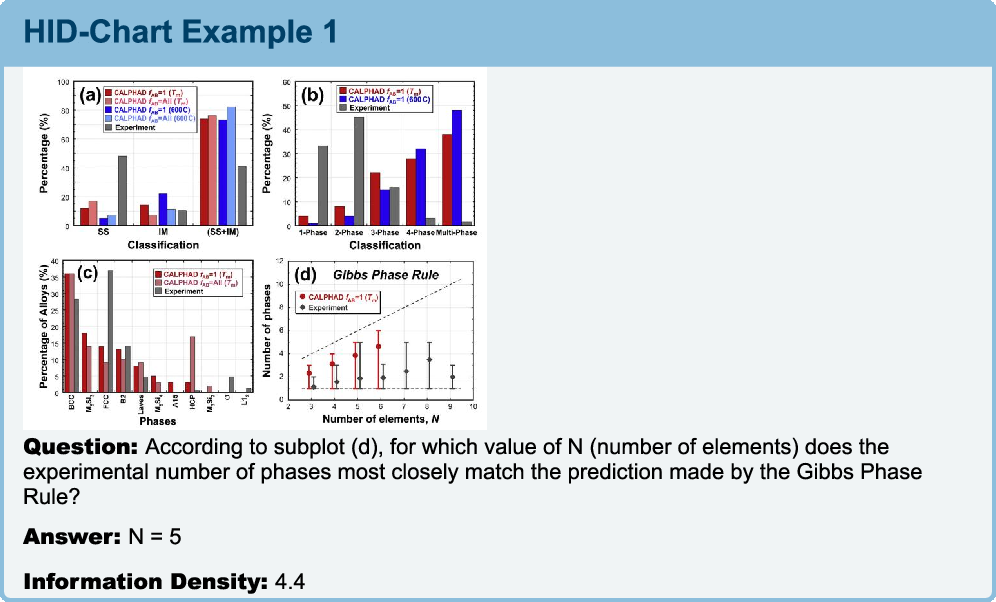
Figure 9: Example of cold-start data input and reasoning output.
Figure 10: Chart-FR1 inference example, showing multi-step visual focus and stepwise answer derivation.
HID-Chart Examples: Representative cases from HID-Chart reveal the model's robustness in handling high-entropy chart data with multiple visual cues.
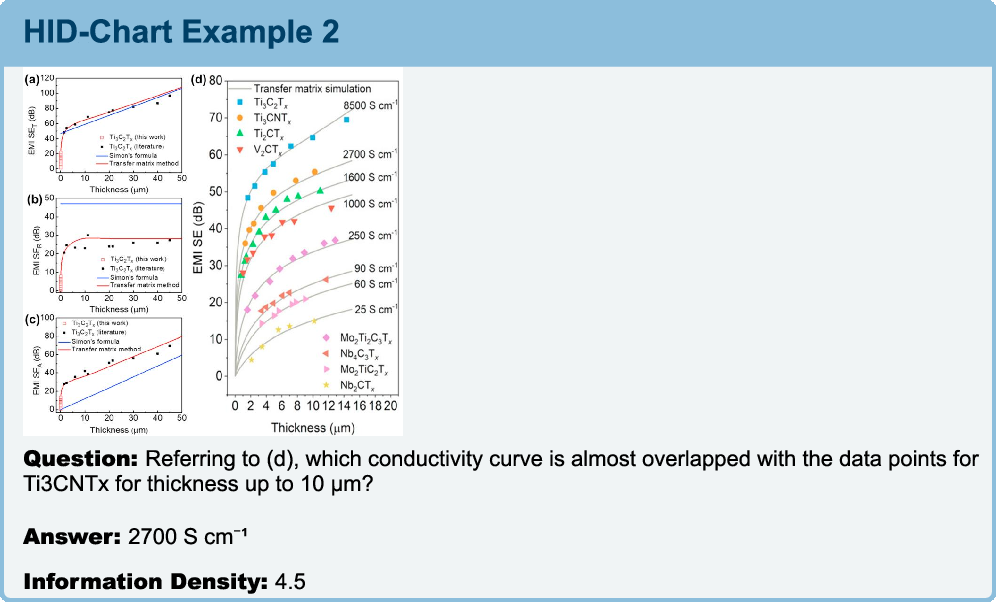
Figure 11: HID-Chart inference showcasing Chart-FR1's performance on extremely dense chart QA tasks.
Results and Numerical Analysis
Chart-FR1 demonstrates strong quantitative results across all benchmarks, with particularly pronounced improvements on charts with high visual cue density. The adaptive KL penalty directly correlates with increased reasoning length and accuracy. The model achieves:
- Best-in-class performance at α=2 on five chart QA benchmarks, outperforming baselines by significant margins (see Figure 3).
- Scalable reasoning depth: Reasoning lengths increase adaptively with cue density, as shown in token statistics.
- Consistent convergence: RL reward curves exhibit rapid stabilization, indicating efficient policy optimization.
Qualitative analysis highlights enhanced interpretability, with Focus-CoT sequences yielding stepwise explanations closely aligned with chart structures. The evaluation protocol using Chart-ID metrics evidences the model’s capability to effectively parse and reason over highly dense visual-linguistic information.
Implications and Future Prospects
The introduction of visual focus-driven reasoning establishes a new direction in multimodal chart QA, moving beyond generic prompt-based approaches towards fine-grained, cue-sensitive reasoning frameworks. Practical implications include scalable deployment in real-world chart analytics and automated scientific plot interpretation. Theoretically, the focus-driven paradigm and adaptive reasoning scaling could be extended to other dense multimodal domains, such as document understanding and medical imaging.
Future research may explore:
- Generalization to unseen chart modalities: Extending Chart-FR1's paradigm to complex, real-world chart formats.
- Integration with advanced process reward models: Leveraging external process reward signals for further reasoning enhancement.
- Iterative focus shifting mechanisms: Dynamically refocusing reasoning steps via RL in multi-cue environments.
- Benchmark expansion with richer chart datasets: Facilitating broader evaluation robustness.
Conclusion
Chart-FR1 introduces a visually focused reasoning framework, offering robust fine-grained QA on dense charts. With a rigorous two-stage training pipeline and an automated Focus-CoT generation protocol, the model achieves strong numerical performance and interpretable reasoning, validated across multiple benchmarks and the HID-Chart dataset. This work sets a precedent for scalable, cue-guided multimodal reasoning and elucidates promising directions for future AI research in chart understanding and dense visual QA.