- The paper demonstrates an experimental pipeline using analog circuits and automated DAQ systems to obtain spectral bifurcation diagrams.
- It validates dynamic transitions such as period-doubling, torus, and three-frequency bifurcations through precise FFT and peak extraction methods.
- The approach achieves strong agreement with numerical simulations, showcasing robustness against noise and potential for diverse nonlinear applications.
Experimental Signatures of Dynamic Bifurcations via Spectral Bifurcation Diagrams
Introduction
Dynamic bifurcations in nonlinear systems—period-doubling, quasiperiodicity, and torus bifurcations—give rise to rich frequency-domain phenomena directly correlated with transitions in the system's qualitative dynamical behavior. Traditional bifurcation analysis through time-domain diagnostics (such as regular bifurcation diagrams or Lyapunov exponents) is effective but may lack sensitivity to spectral changes underlying these transitions. The spectral bifurcation diagram (SBD) framework provides a direct frequency-domain mapping of how spectral components evolve as system parameters vary. The present work establishes and validates an experimental pipeline using analog nonlinear circuits augmented with automated DAQ control for real-time acquisition and analysis of SBDs, demonstrating robust spectral signatures of several canonical dynamic bifurcations in physical hardware (2605.00672).
Methodology: Experimental Realization of SBDs
The architecture involves three tightly integrated layers:
- Nonlinear Analog Circuit Realizations use op-amps, multipliers, and nonlinear elements to instantiate dynamics corresponding to selected ODE systems (e.g., Rössler, Kuznetsov, Anishchenko, coupled Van der Pol).
- Automated Parameter Sweep with DAQ Parameter control (often a DC voltage) is swept systematically via NI myDAQ. Time-series data for state variables are collected in real time at high sampling rates (≥200 kHz), with static and dynamic transients excised programmatically.
- Spectral Processing Pipeline
For each parameter point, the FFT and peak extraction algorithms identify prominent frequencies; thresholding (typically −140 dB) distinguishes spectral content from noise. Frequency–parameter–power tuples constitute the SBD; additional hardware circuitry enables experimental regular bifurcation diagrams via automated Poincaré sections.
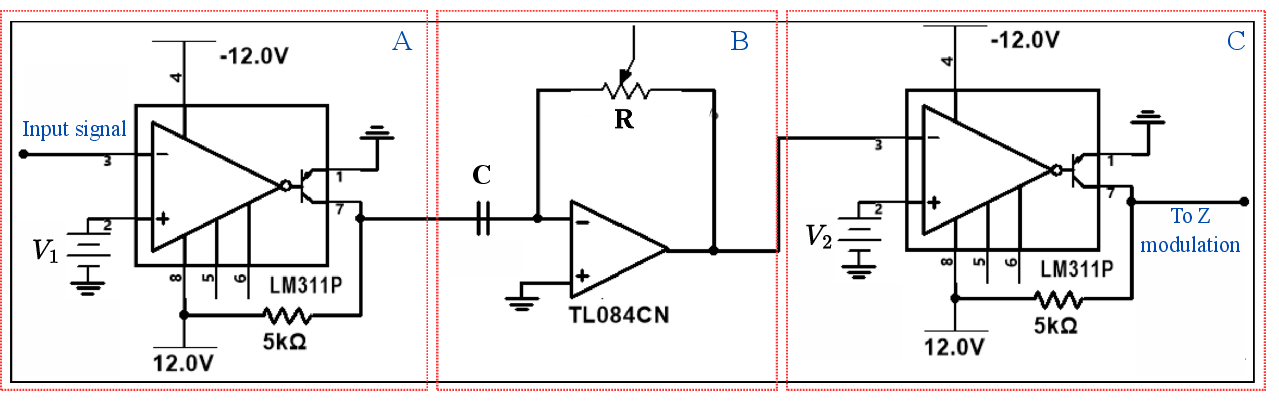
Figure 2: Circuit for obtaining the Poincaré section, using comparators and a differentiator for automated sectioning of the oscillatory signal.
Verification: Period-Doubling and Spectral Halving in the Rössler System
The experimental setup for the rescaled Rössler oscillator connects parameter b to a swept DC voltage. The regular bifurcation diagram, visualized by oscilloscope in persistent display mode and compared with numerical integration, demonstrates qualitative agreement in period-doubling cascades despite circuit parameter tolerances.
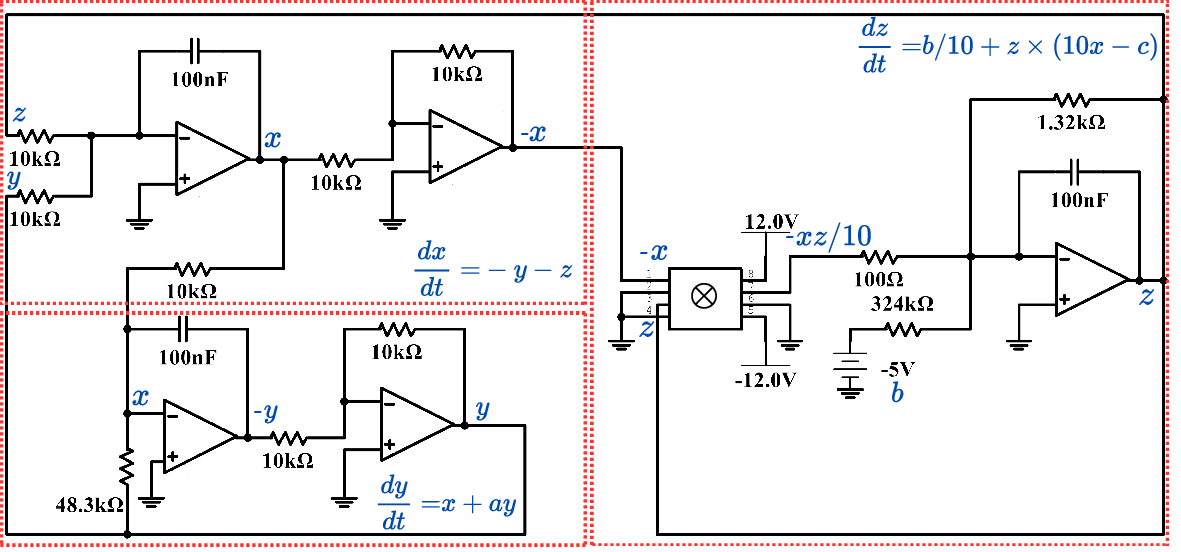
Figure 1: Electronic circuit implementation of the rescaled Rössler system, with DAQ-driven parameter variation.
SBD analysis reveals the hallmark of period-doubling: the emergence of frequency components at half, quarter, and smaller fractions of the base frequency as b is decreased. This halving is clearly visible in both numerical and experimental SBDs; chaos is identified by the emergence of a band-limited spectrum at low b (Fig. \ref{rsbd_exp}).
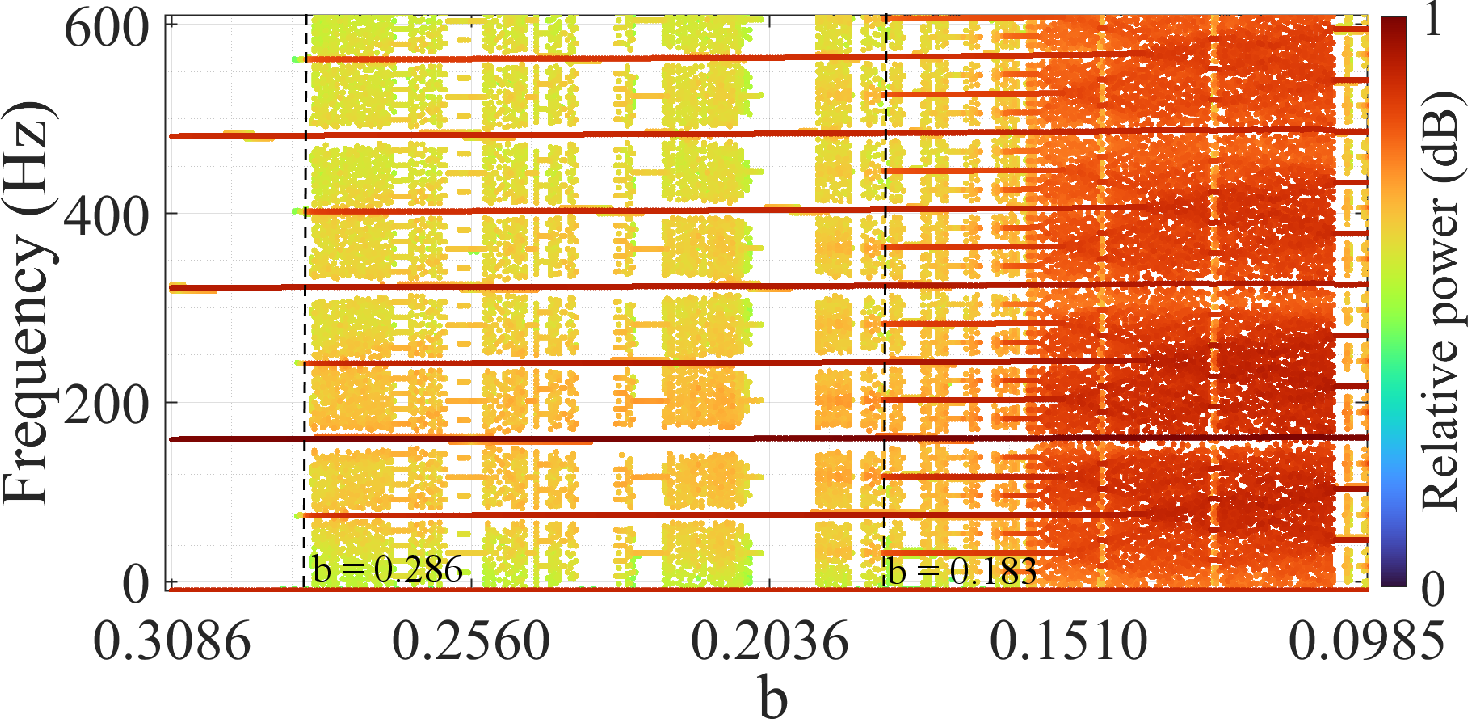
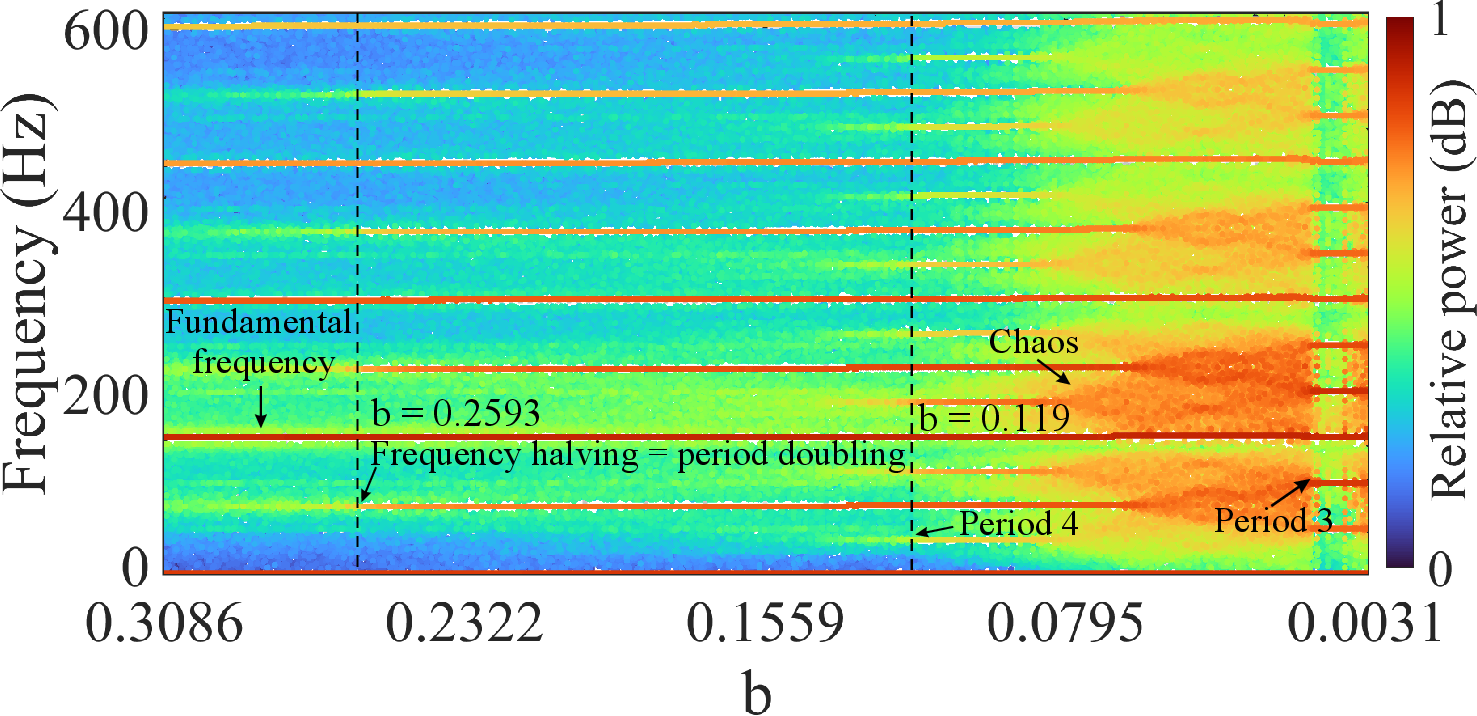
Figure 3: Numerically obtained SBD for the Rössler system, showing frequency halving at successive bifurcations.
Secondary Hopf (Torus) Bifurcation: Two-Frequency Quasiperiodicity
A 3D oscillator (scaled Kuznetsov system) is used to probe the transition from periodic to quasiperiodic response via secondary Hopf bifurcation. The experimental setup, via Fig. \ref{QP_circuit}, allows sweeping of control parameter e. The regular bifurcation diagram observes torus birth and annihilation, confirming known theory.
The SBDs (numerical and experimental) display the cross-hatching pattern characteristic of two incommensurate frequencies (f1, f2). Dominant branches separate at fixed parameter values; vertical slices and fine structure enable precise extraction of incommensurate frequency values. Experimental SBDs enable empirical identification of frequency combinations and parameter windows for mode locking.
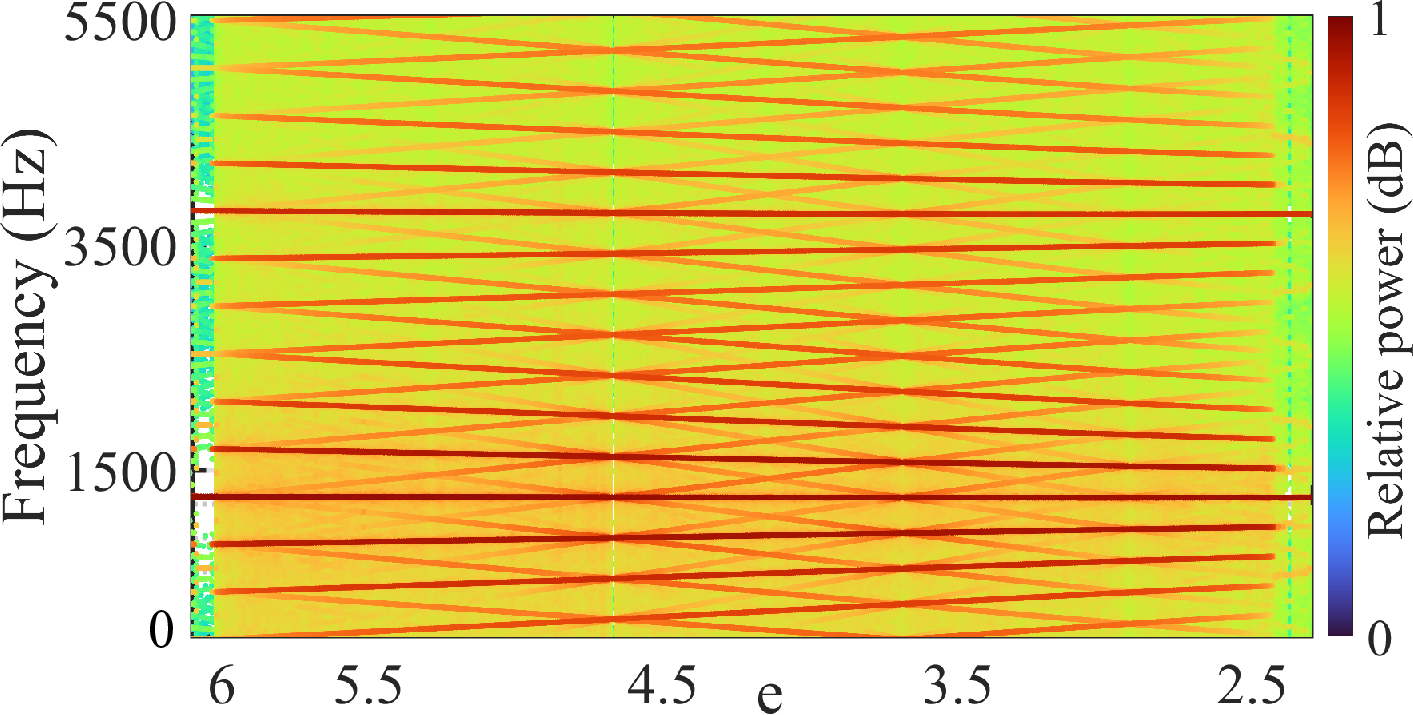
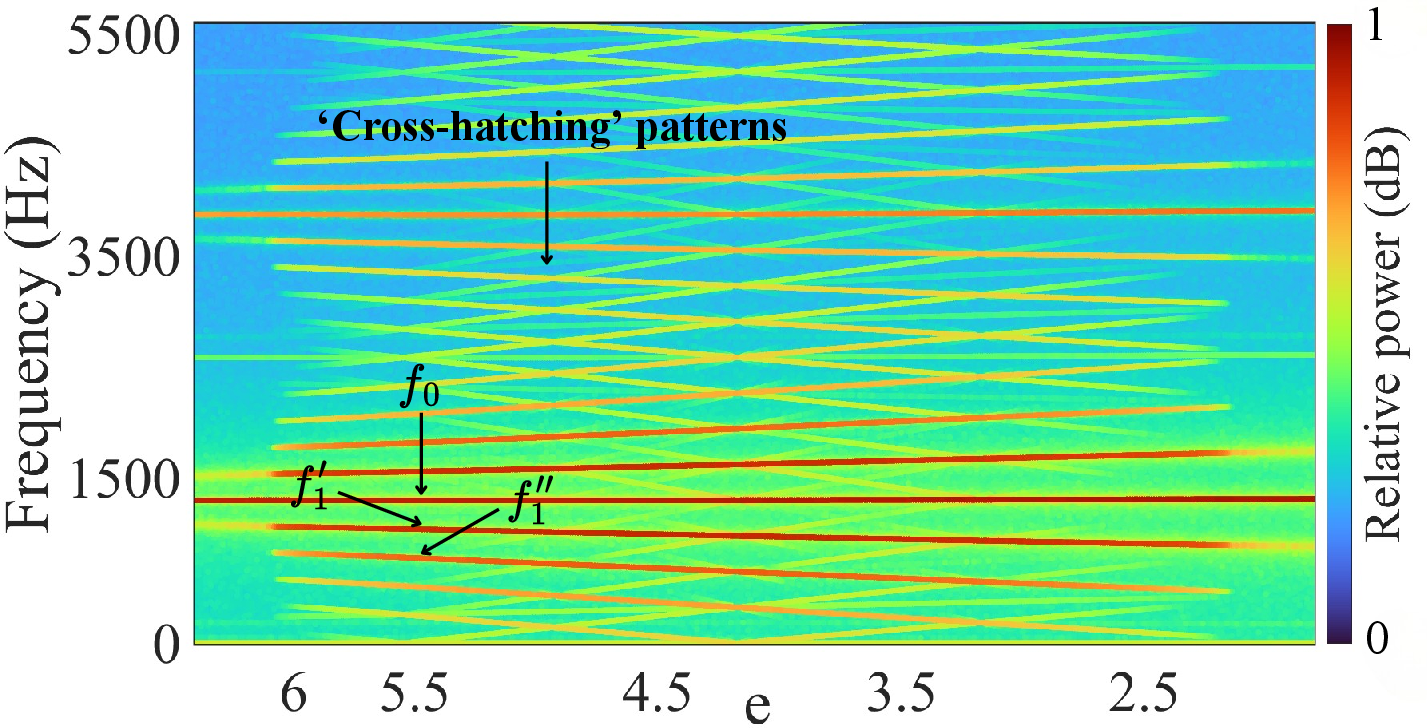
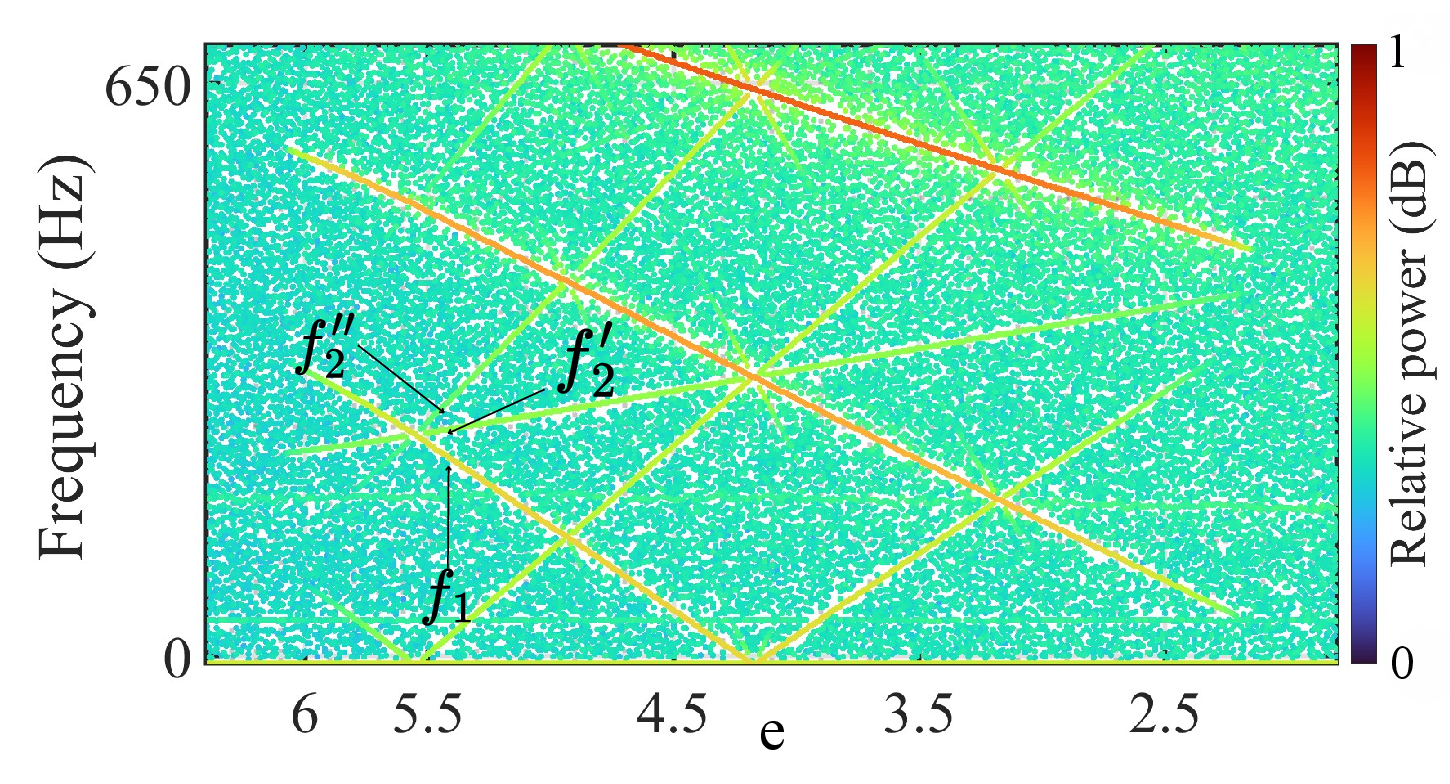
Figure 6: Experimental SBD in the two-frequency quasiperiodic regime, illustrating cross-hatching resulting from spectral combinations.
Torus Doubling: Double Covering and Frequency Halving
The Anishchenko generator is implemented to observe torus length-doubling. Parallel analysis of phase portraits and Poincaré sections confirm the torus doubling via direct trajectory observation.
Spectrally, the SBDs show a critical point where one fundamental quasiperiodic frequency undergoes halving (f1→f1/2) while another (f2) remains constant. This matches numerical predictions and theoretical analyses for double-covering bifurcations. Fine structure examination, as in Fig. \ref{ldsbd_expzoom}, is necessary for accurate extraction of secondary frequencies post-bifurcation.
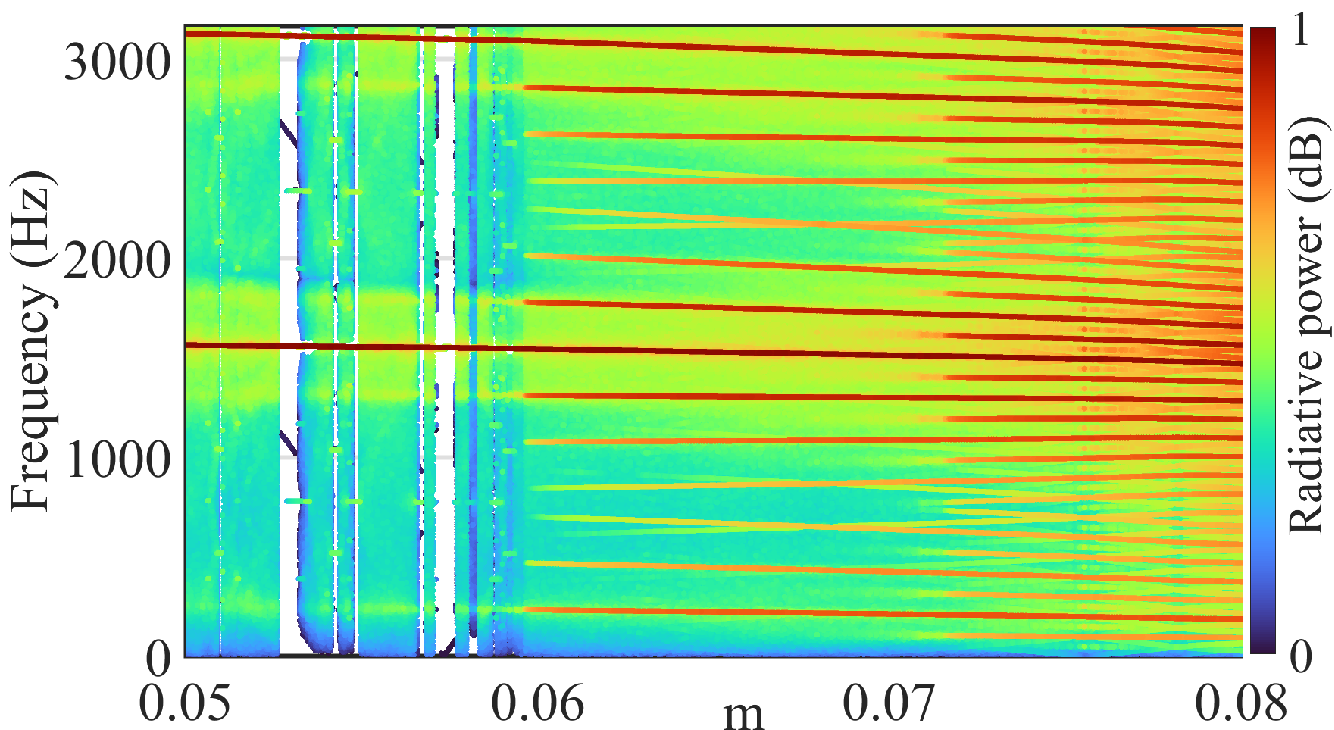
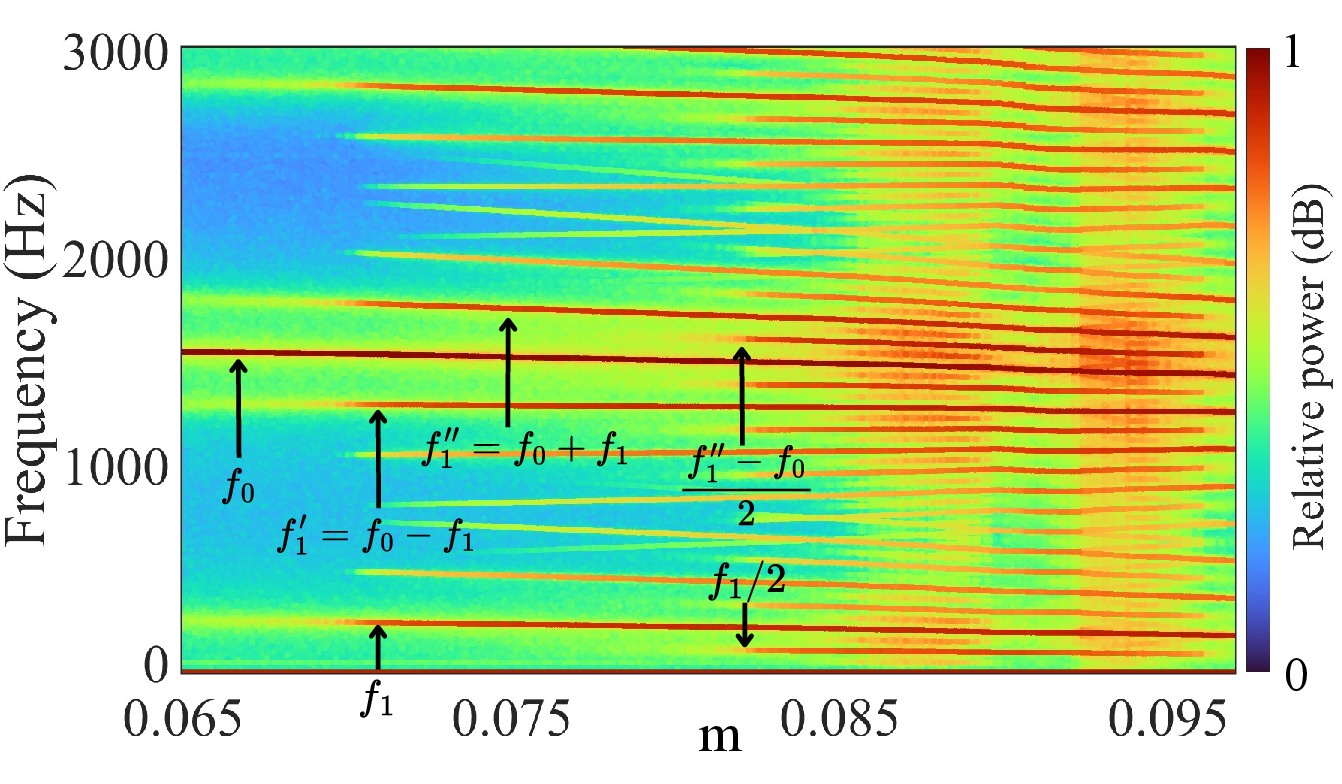
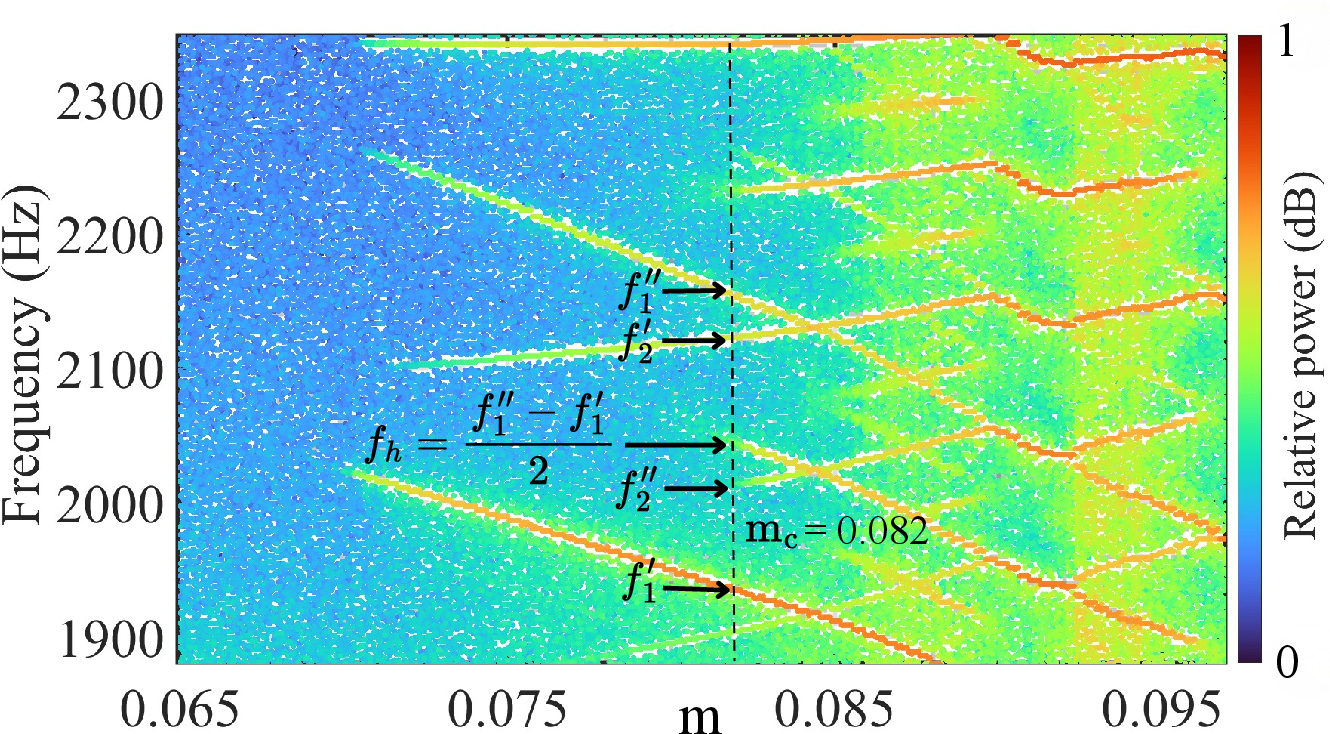
Figure 8: Experimental SBD for torus length-doubling, illustrating the emergence of −1400 while −1401 remains constant.
Three-Frequency Quasiperiodicity: Third Hopf in Coupled Van der Pol System
A driven coupled Van der Pol configuration facilitates transitions to three-frequency quasiperiodicity (3-Torus), with the parameter −1402 controlled via DAQ. The stroboscopic technique confirms genuine three-frequency attractors in both phase space and Poincaré sections.
The experimental SBD reveals nested fine structures at three distinct incommensurate frequencies (−1403, −1404, −1405), consistent between simulations and experiment. Even with increased observational noise, vertical zooming as in Fig. \ref{tfqsbd_expzoom} provides sufficient resolution to identify all frequency components.
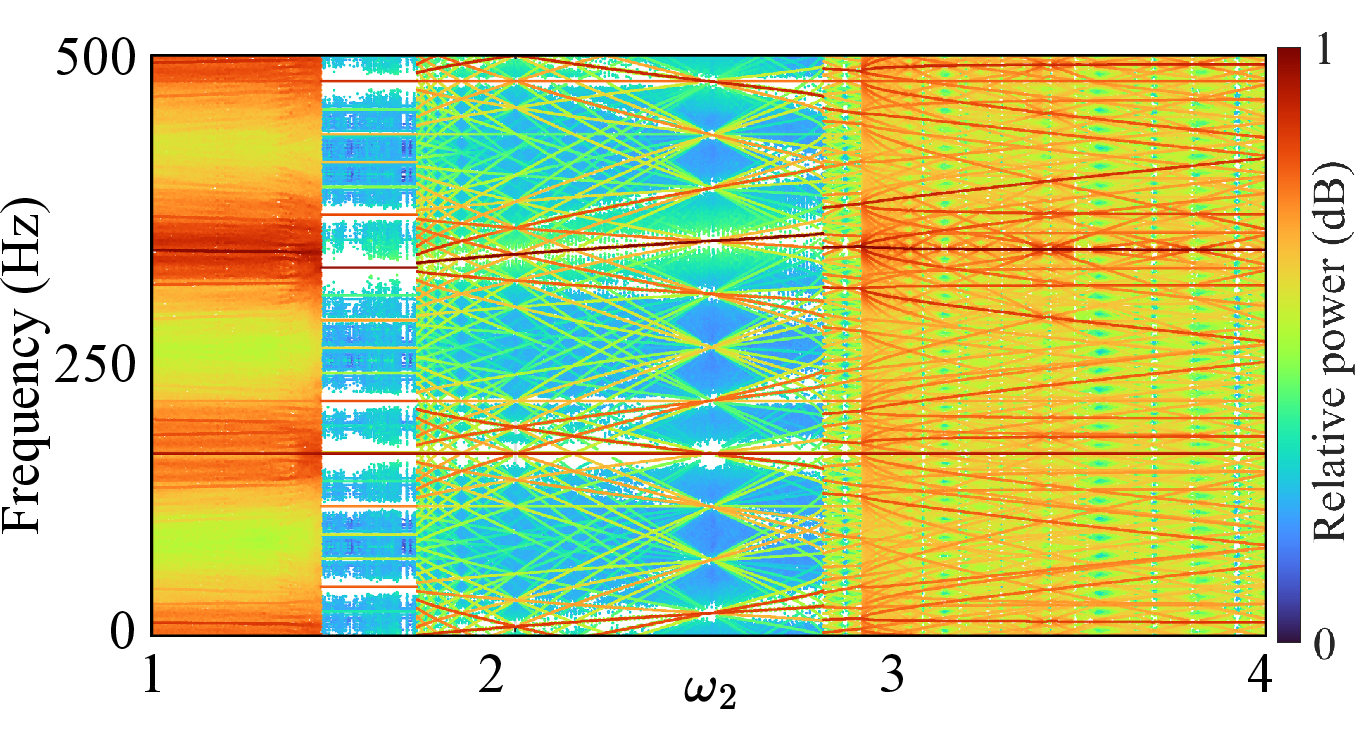
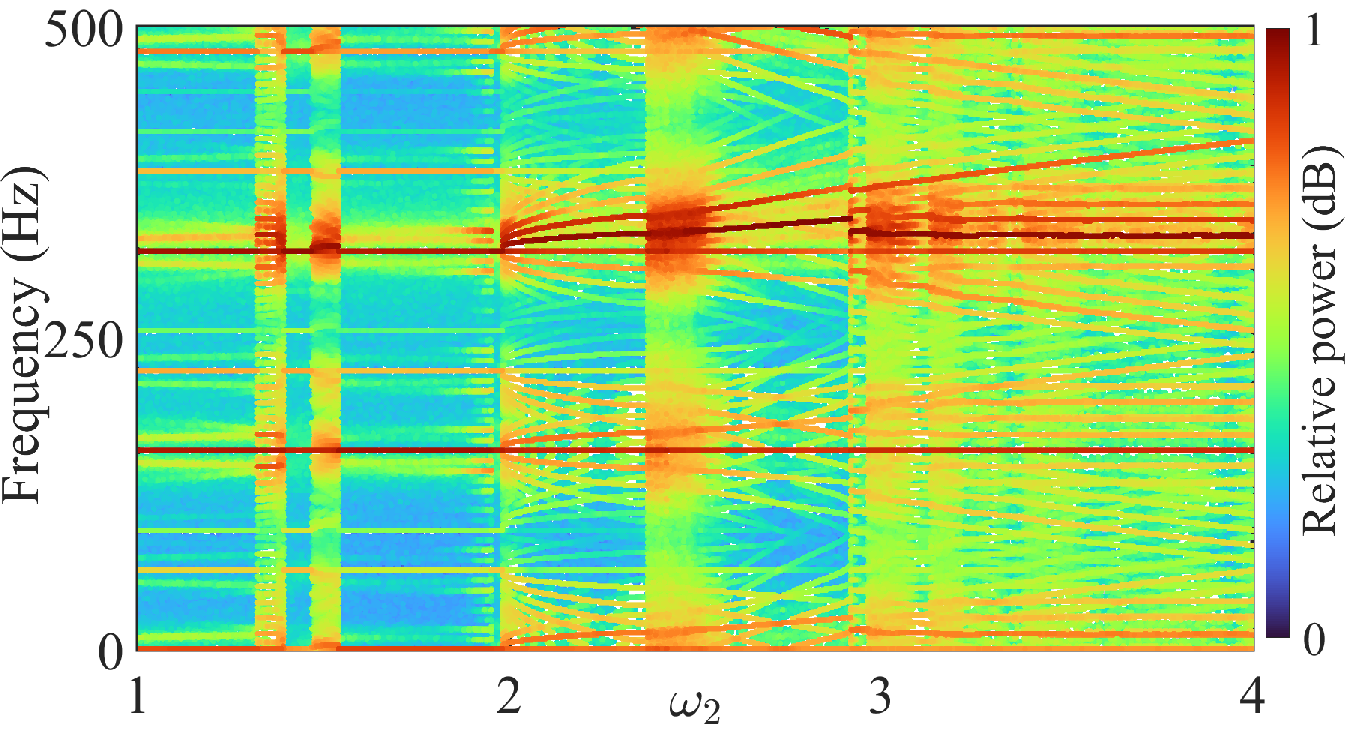
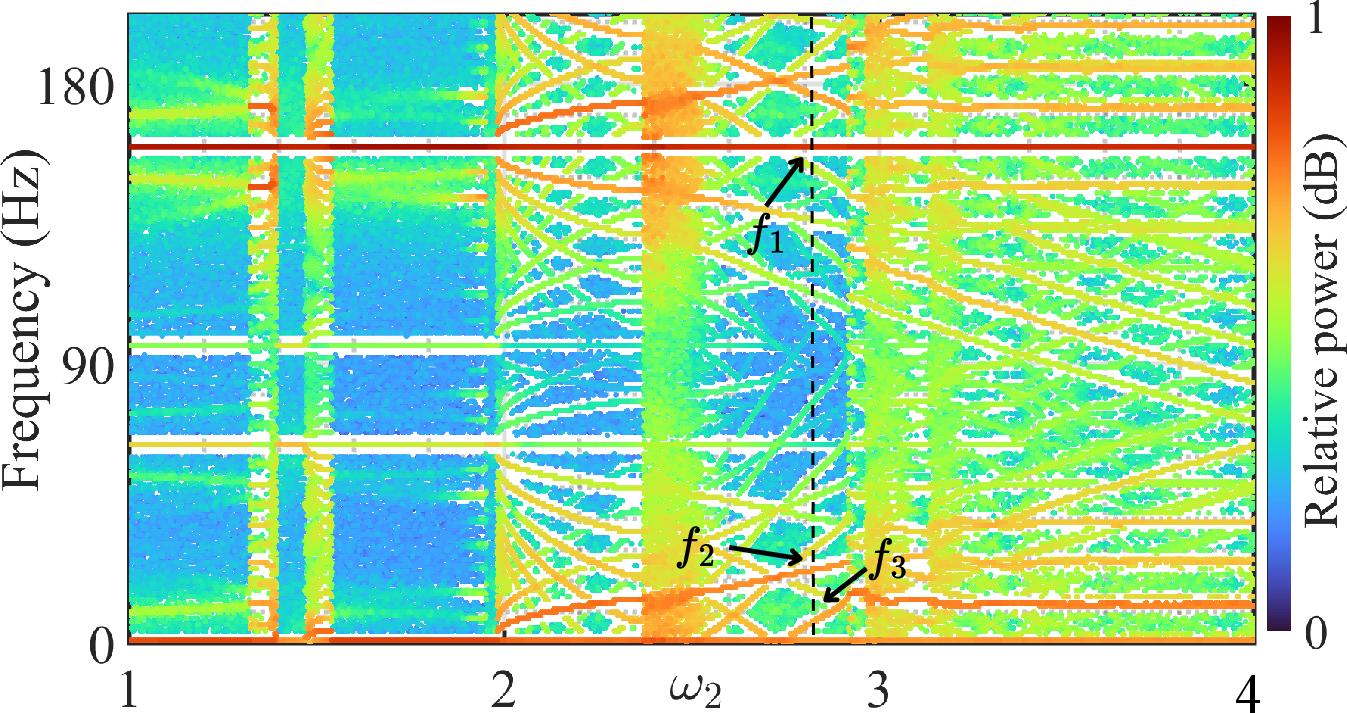
Figure 4: Experimental SBD for the coupled Van der Pol oscillator in the three-frequency quasiperiodic regime, with vertical zoom revealing all major frequencies.
Discussion and Implications
Strong numerical agreement: Across all dynamical regimes, experimental SBDs reproduce the theoretically anticipated bifurcation topologies found in simulation (period-doubling cascades, cross-hatched torus bifurcations, and frequency halving/doubling).
Robustness to experimental imperfections: Despite the presence of component noise, parameter drift, and analog nonidealities, frequency-domain analysis (SBD) remains a faithful indicator of underlying nonlinear dynamics. Experimental SBDs display characteristic spectral features even amidst unavoidable background spectra.
Experimental SBD as diagnostic tool: The method allows direct, parameter-resolved extraction of dynamical transition points in hardware. Real-time identification of complex bifurcations, including higher-dimensional tori and frequency locking, is feasible on a broad class of nonlinear platforms (electronic, electromechanical).
Extension potential: The framework generalizes to any system where the key parameter admits continuous control and frequency-resolved output; mechanical, optical, and biological experimental systems could benefit from similar spectral bifurcation diagnostics.
Conclusion
This work demonstrates a comprehensive and automated experimental method for acquiring spectral bifurcation diagrams in nonlinear hardware systems (2605.00672). The results constitute the first systematic experimental verification of frequency-domain bifurcation signatures previously established only by simulation. The SBD approach is robust to common experimental artifacts and is capable of resolving fine bifurcation structures—including multi-frequency tori and bifurcation-induced frequency transformations. As a diagnostic methodology, SBDs promise to become a practical standard for the dynamical analysis of nonlinear systems in both academic and applied experimental research.