- The paper introduces ORCA, which integrates spectral, eigenvector, and graph-topological features with traditional price indicators for detecting market rallies and crashes.
- It employs multi-scale rolling correlation matrices and a 206-dimensional feature vector to capture both short-term anomalies and medium-term structural shifts.
- Empirical results demonstrate improved tail-event detection with superior risk-adjusted returns and robust out-of-sample performance over conventional models.
ORCA: Online Regime Correlation Analyzer for Balanced Tail-Event Detection
Overview and Motivation
The ORCA (Online Regime Correlation Analyzer) framework targets the structural underpinnings of financial crises by integrating advanced spectral graph methods, random matrix theory, and supervised machine learning for real-time, balanced detection of market rallies and crashes over a ten-day forward horizon (2604.17251). Traditional volatility and risk metrics reduce the complex, dynamic web of financial interdependencies to single scalar time series (e.g., VIX, GARCH volatility), discarding pre-crisis topological changes in the cross-asset correlation network. ORCA is explicitly designed to retain and exploit these topological signals, constructing rolling multi-scale correlation matrices, extracting a high-dimensional vector of spectral, eigenvector, and graph-topological features, and fusing them with classical price-based technical indicators in an interpretable ensemble model.
Methodology
Multi-Asset Universe and Correlation Estimation
The asset universe consists of 24 diversified exchange-traded instruments across six classes, and ORCA computes rolling Pearson correlation matrices with three estimators: (1) 60-day trailing window, (2) 120-day trailing window, and (3) exponentially-weighted covariance with a 30-day half-life. These estimators are symmetrized, clipped, and provide complementary sensitivity to short-term anomalies and medium-term structural shifts. Feature extraction operates on these matrices at each time step to capture both static and dynamic correlation regimes.
Feature Families
A 206-dimensional feature vector is constructed by concatenating 127 spectral and topological descriptors with 79 price-derived features.
Spectral, Eigenvector, and Topological Features
The spectral extraction includes absorption ratios up to the fifth eigenvalue, eigenvalue entropy (from which effective rank is derived), spectral gap (γ=λ1/λ2), condition number, Marchenko-Pastur excess, and statistical moments of the eigenvalue spectrum. First-eigenvector concentration, Herfindahl index, and entropy provide loadings context.
Topological descriptors are computed at multiple correlation thresholds and encompass edge density, global clustering coefficient, degree centralisation, and dispersion metrics. Critically, the time dynamics (rate-of-change, rolling z-score, and acceleration) of key spectral features are aggregated across three estimation horizons, intensifying signal localisation around regime transitions.
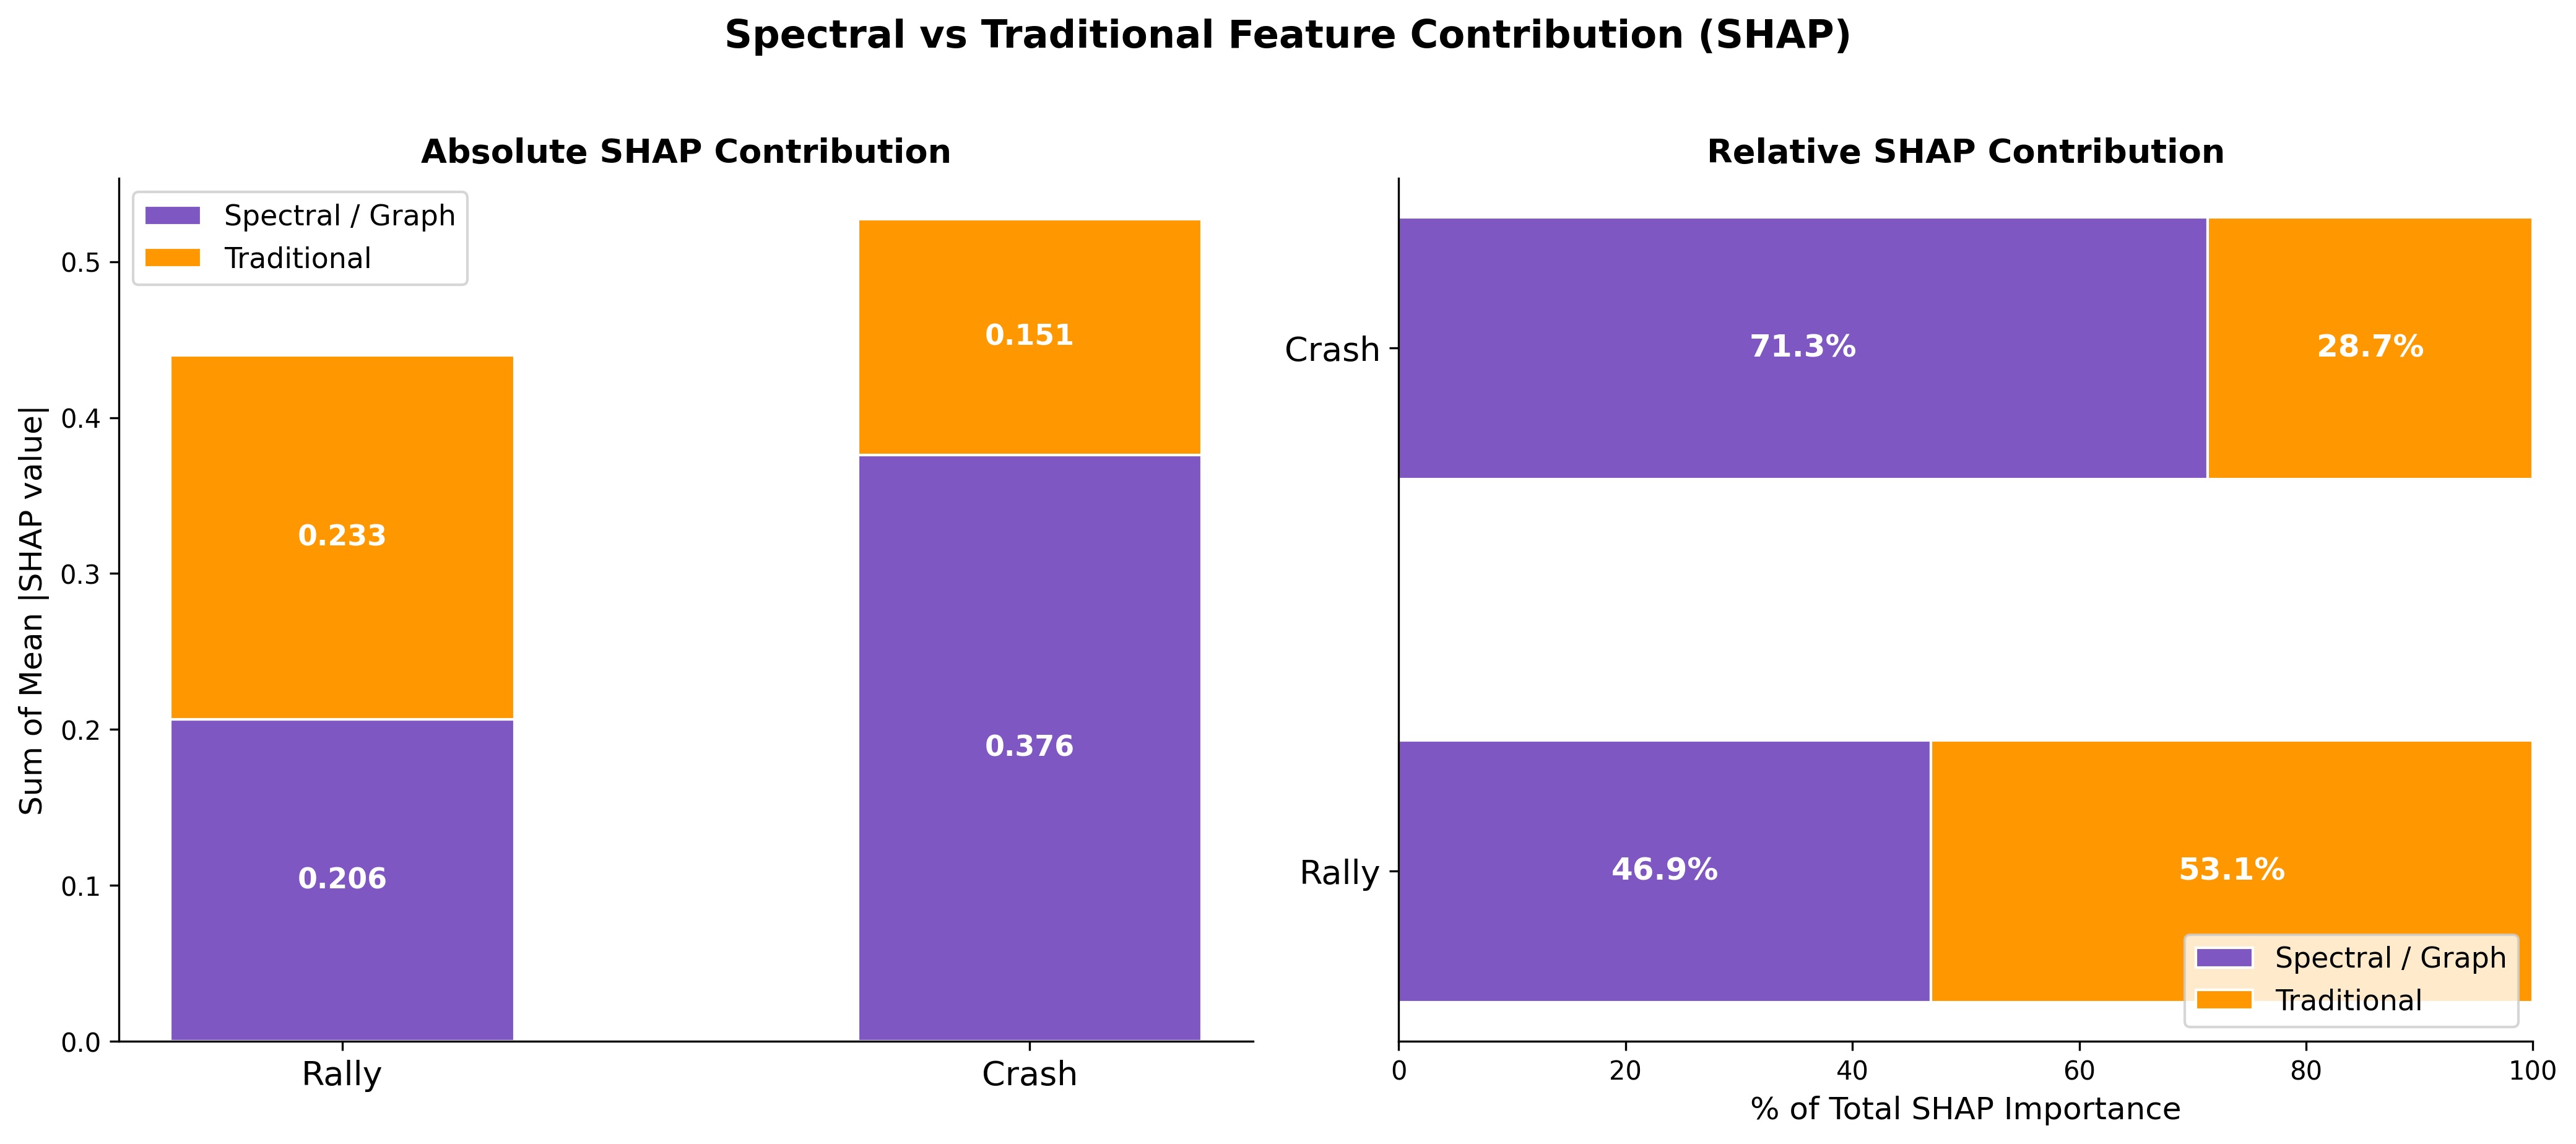
Figure 1: Aggregated SHAP importance by feature family shows graph-topological and spectral feature dominance for crash detection, while traditional indicators retain weight for rallies.
Traditional Price-Based Features
These indicators capture multi-horizon returns, volatility (realized and GARCH), skewness, kurtosis, price-to-SMA ratios, rolling drawdowns, and cross-sectional dispersion. While such features encode local price momentum and mean-reversion, their univariate nature limits regime sensitivity.
Supervised Learning and Evaluation Protocol
The feature vector is processed by a depth-limited Random Forest (200 trees, max depth 6), using balanced sub-sample weighting for rare-event classification. The model predicts the probability of a 10-day 3%+ rally or 7%+ crash (by max drawdown) in the S&P 500. All validation is strictly out-of-sample, with eight expanding walk-forward folds, three-year training, six-month testing, and crucially, ten-day anti-leakage gaps.
Evaluation uses AUC-ROC for each task and the geometric mean BCD-AUC (Balanced Crisis Detection AUC), penalizing models that sacrifice performance in either direction.
Empirical Results
Out-of-Sample Classification
The walk-forward protocol demonstrates ORCA’s superiority, with BCD-AUC of 0.741 (Rally AUC: 0.772, Crash AUC: 0.711), outperforming advanced volatility models (HAR-RV, BCD-AUC: 0.729) and both price-feature-only and spectral-feature-only forests. Ablation confirms that spectral features improve crash detection AUC by +10.3pp and rally detection by +5.2pp over traditional features. This signals that topological structure encodes essential crisis information absent from price-based indicators.
Feature Importance and SHAP Analysis
SHAP aggregation reveals an asymmetry: price-based features dominate for rally detection, while spectral/topological descriptors are essential for crash prediction. Specifically, clustering coefficient, edge density, and eigenvalue ratio features are the top predictors for crash detection.
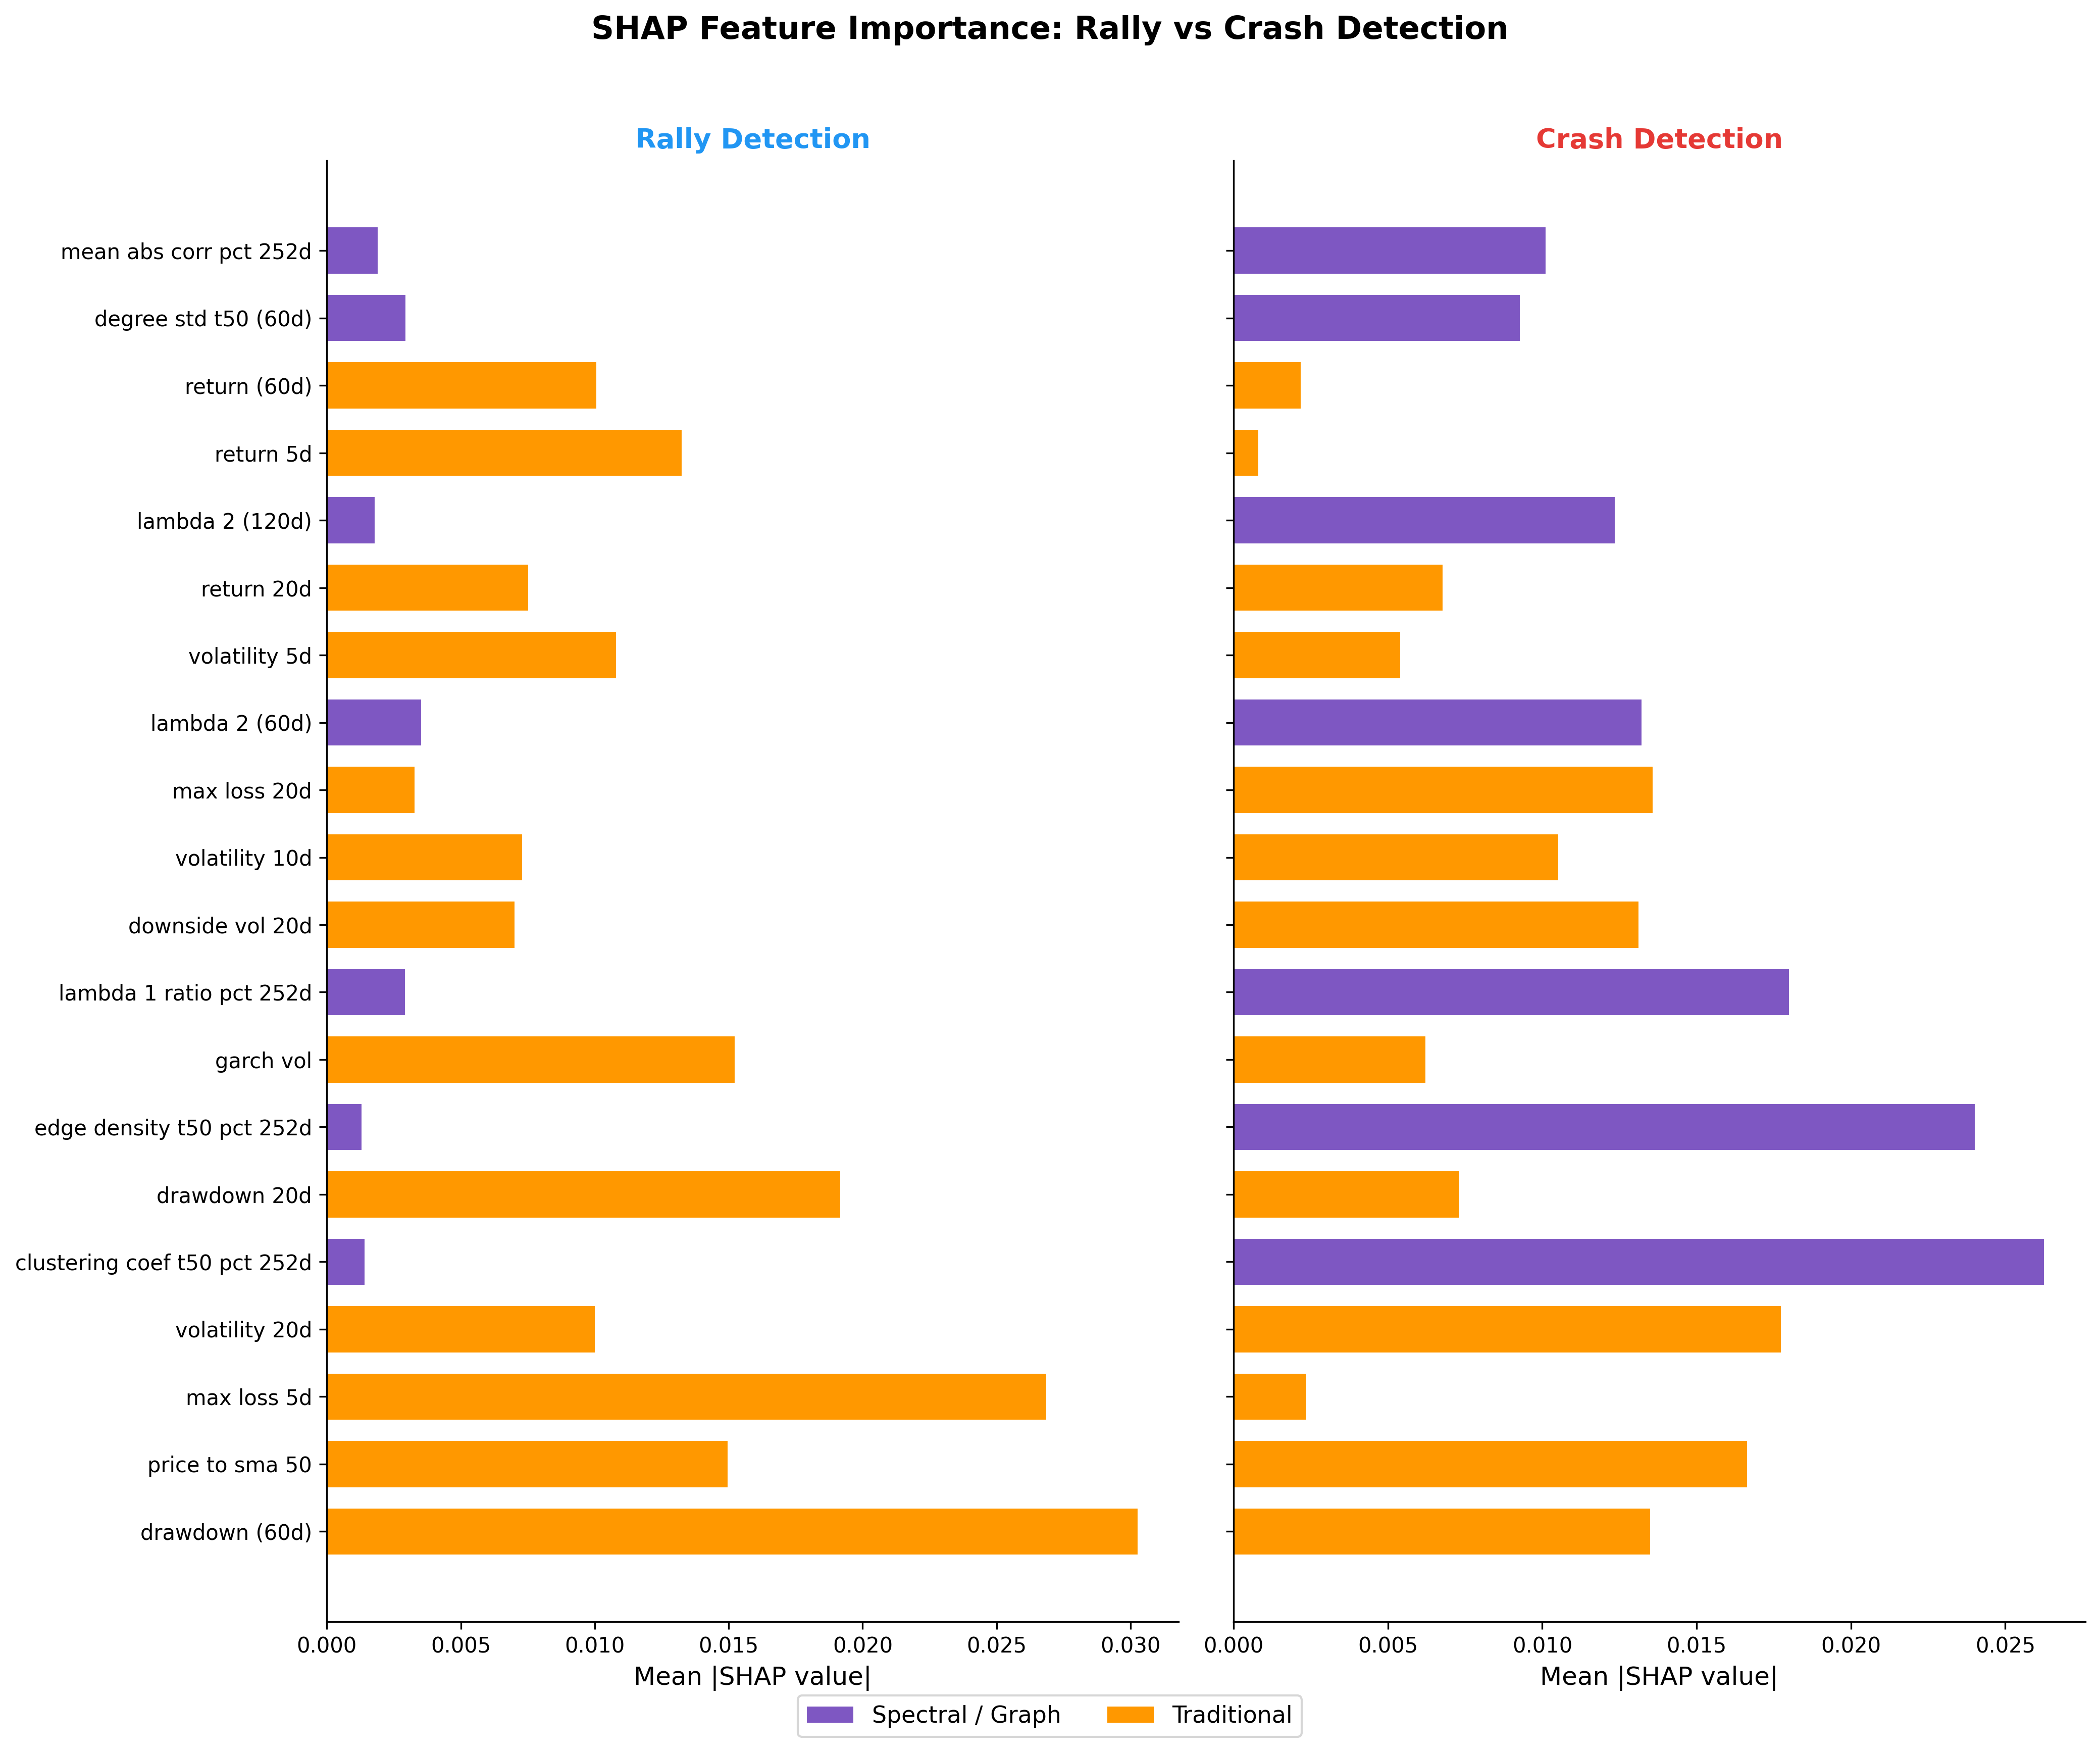
Figure 2: SHAP feature importance analysis: topological features are primary drivers for crash detection; rally detection is led by traditional indicators.
SHAP dependence plots reinforce this dichotomy—drawdown and price/SMA divergences are leading for rallies, while abrupt drops in clustering coefficient and elevated eigenvector concentration are highly predictive for crashes.
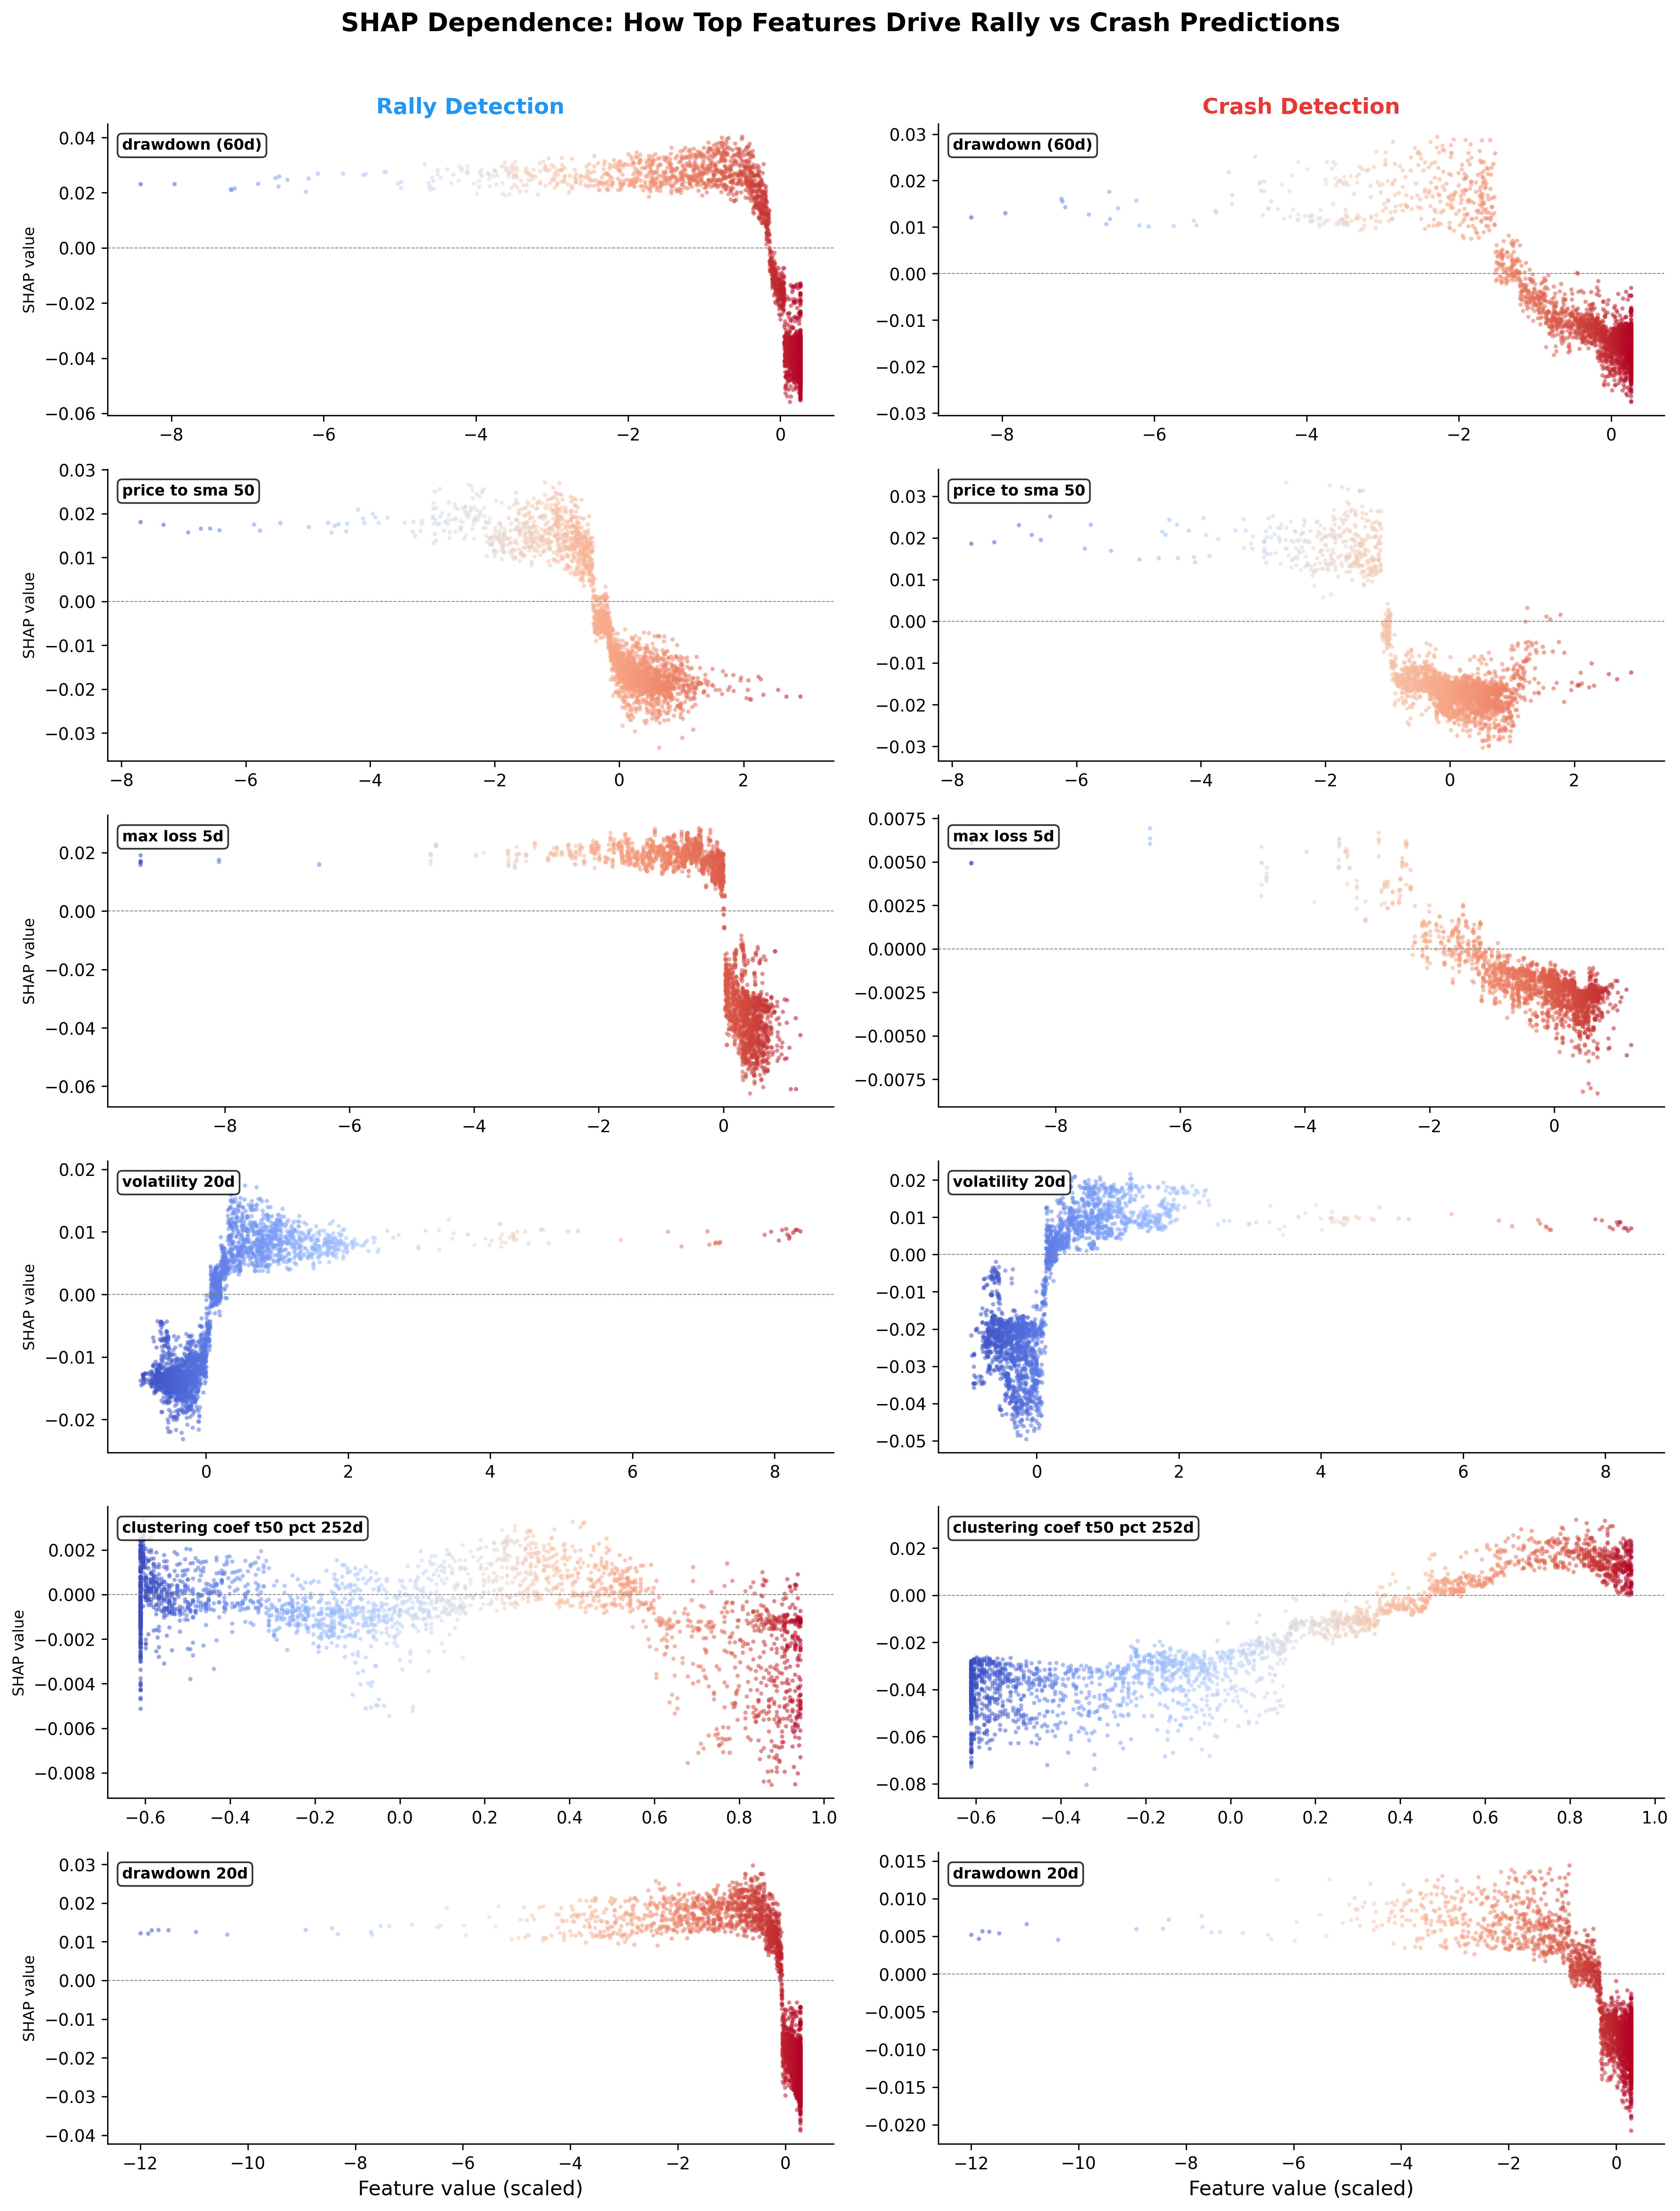
Figure 3: SHAP dependence plots for top features illustrate the monotonic impact of drawdown and correlation topology on model predictions, with separation by detection task.
Regime Mapping and Portfolio Strategy
ORCA’s output is mapped to a five-regime framework (Normal, Rally, Caution, Euphoria, Crisis) using rolling percentile ranks of predicted probabilities, ensuring statistical stationarity. The backtested “Ensemble Walk-Forward Optimisation” converts these signals to a dynamic equity allocation, enforcing minimum holding periods, aggressive de-risking in high-danger zones, and risk-on/risk-off capital rotation into defensive assets (Gold, Treasuries, USD) when equity exposure is minimized.
Out-of-sample performance is robust: Sharpe ratio 1.13, CAGR 15.6%, maximum drawdown −7.5%—substantially superior to buy-and-hold (Sharpe 0.09, CAGR 3.7%, max DD −33.7%). The Calmar ratio exceeds 2.0, indicating high return/drawdown efficiency directly attributable to preemptive regime shifts in ORCA’s crash detection.
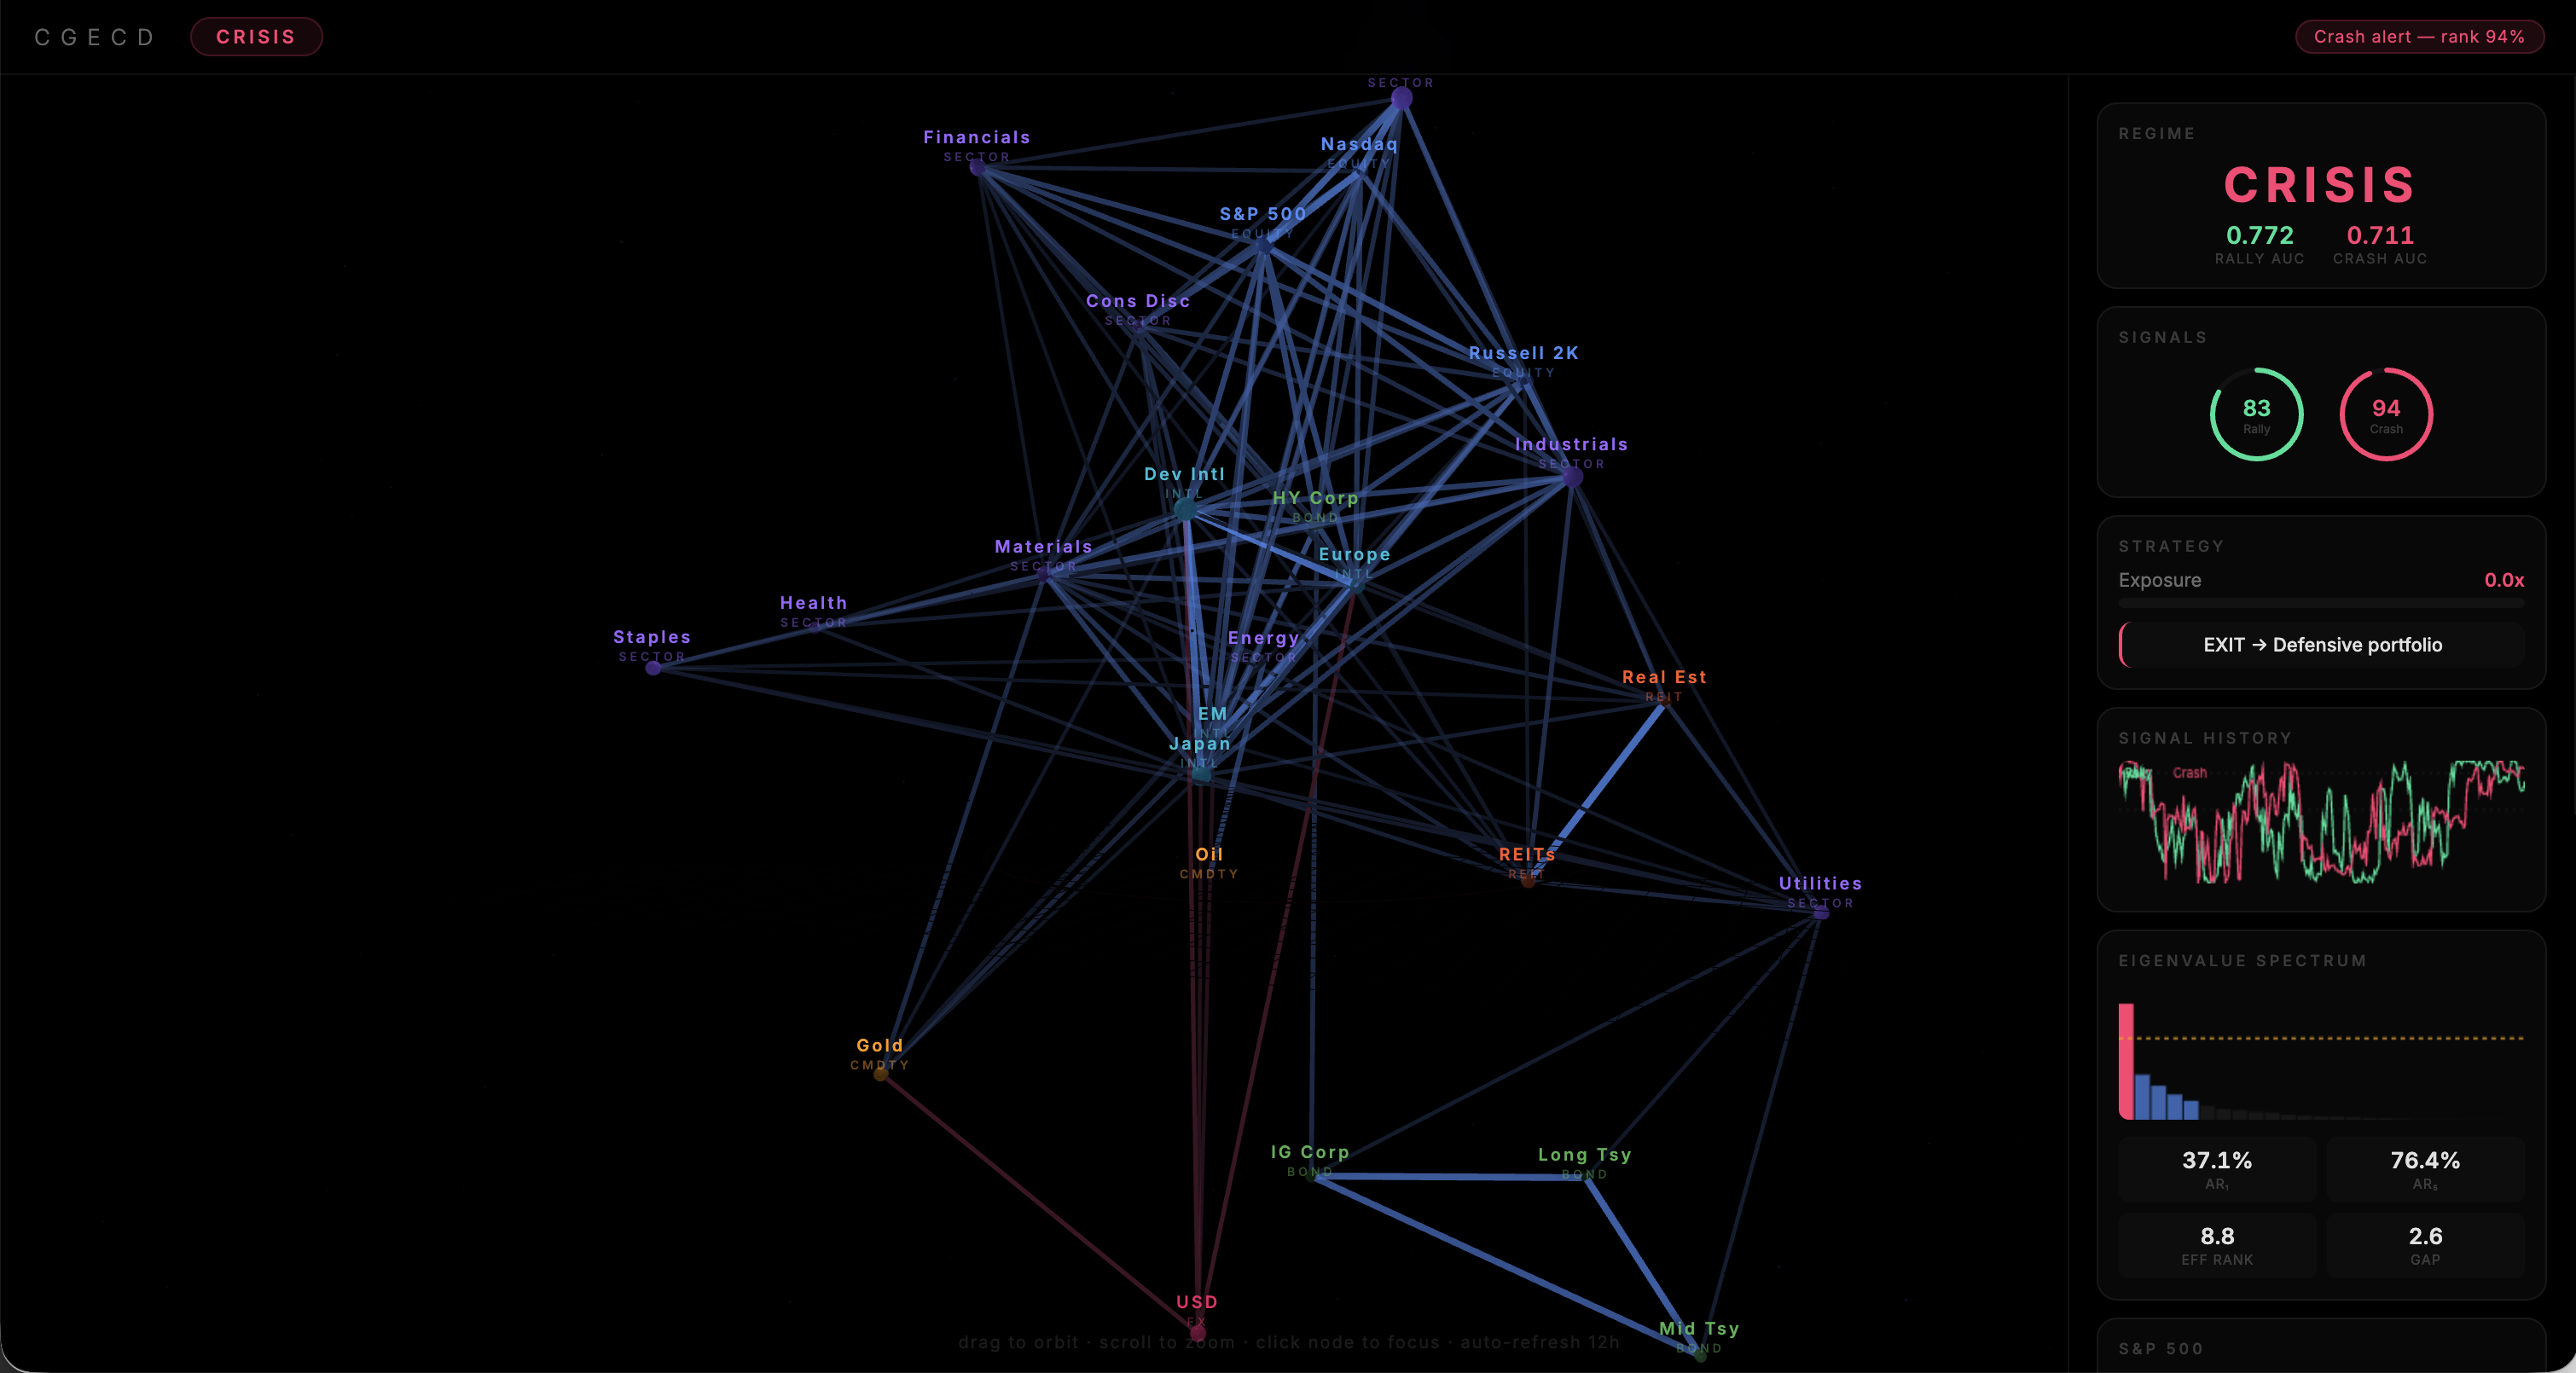
Figure 4: Live demonstration of regime-dependent portfolio allocation. Defensive rotation cushions drawdowns during crises, while high equity exposure captures rallies.
Implications and Future Directions
Theoretical significance lies in the evidence that financial crises—unlike rallies—are preceded by measurable topological phase transitions: eigenvalue compression, clustering breakdown, and network centralization that are invisible to standard volatility and univariate momentum models. Practically, integrating these signals in a walk-forward ensemble produces a deployable system capable of materially improving risk-adjusted returns and reducing extreme drawdowns. The architecture is robust to overfitting given the strict out-of-sample protocol, automated feature pipeline, and parameter ensemble averaging.
Potential future developments include extension to global multi-asset portfolios, online adaptation (to manage feature and regime drift), and combination with higher-frequency features for real-time risk dashboards. More advanced modeling architectures (e.g., online boosting, deep sets, or GNNs) could further synthesize the higher-order dependence structure absent in fixed tree ensembles.
Conclusion
ORCA offers a comprehensive framework that fuses spectral, eigenvector, and graph-topological signals from rolling cross-asset correlation networks with traditional price-based features for robust, balanced tail-event detection. Empirical evidence underscores the critical role of network topology in anticipating systemic risk, especially on moderate time horizons where price-based methods remain reactive. The practical efficacy of this approach is clear in both statistical metrics and backtested portfolio outcomes, with substantial improvements in drawdown and risk-adjusted performance. This supports the broader hypothesis that time-localized, multi-scale spectral analysis of asset networks is an essential—yet underutilized—pillar for next-generation crisis monitoring and adaptive portfolio allocation.