- The paper presents a comparative evaluation of TDA, PCA, and GNN approaches for detecting financial anomalies in the Canadian market.
- It constructs dynamic correlation networks from TSX-60 equities using sliding windows and unsupervised scoring methods like Mahalanobis distance and LOF.
- Empirical results highlight that NN and TDA methods offer higher precision and early detection of both systemic and minor market stress events.
Financial Anomaly Detection in the Canadian Market: Empirical Insights from Topological, Graph, and Feature-based Methods
Overview of Methodological Framework
This study offers a rigorous comparative evaluation of three paradigms for financial anomaly detection—Topological Data Analysis (TDA), Principal Component Analysis (PCA), and Graph Neural Network (GNN)-based approaches—in the context of the Canadian TSX-60 index. The overarching pipeline is depicted in the next figure and consists of transformation of daily stock price log-returns into correlation matrices, construction of weighted graphs, extraction of features using PCA and TDA, and application of unsupervised anomaly detection algorithms (Mahalanobis Distance, Local Outlier Factor). Neural network-based methods (GlocalKD and One-Shot GIN(E)) compute reconstruction-based anomaly scores on graph-structured representations.
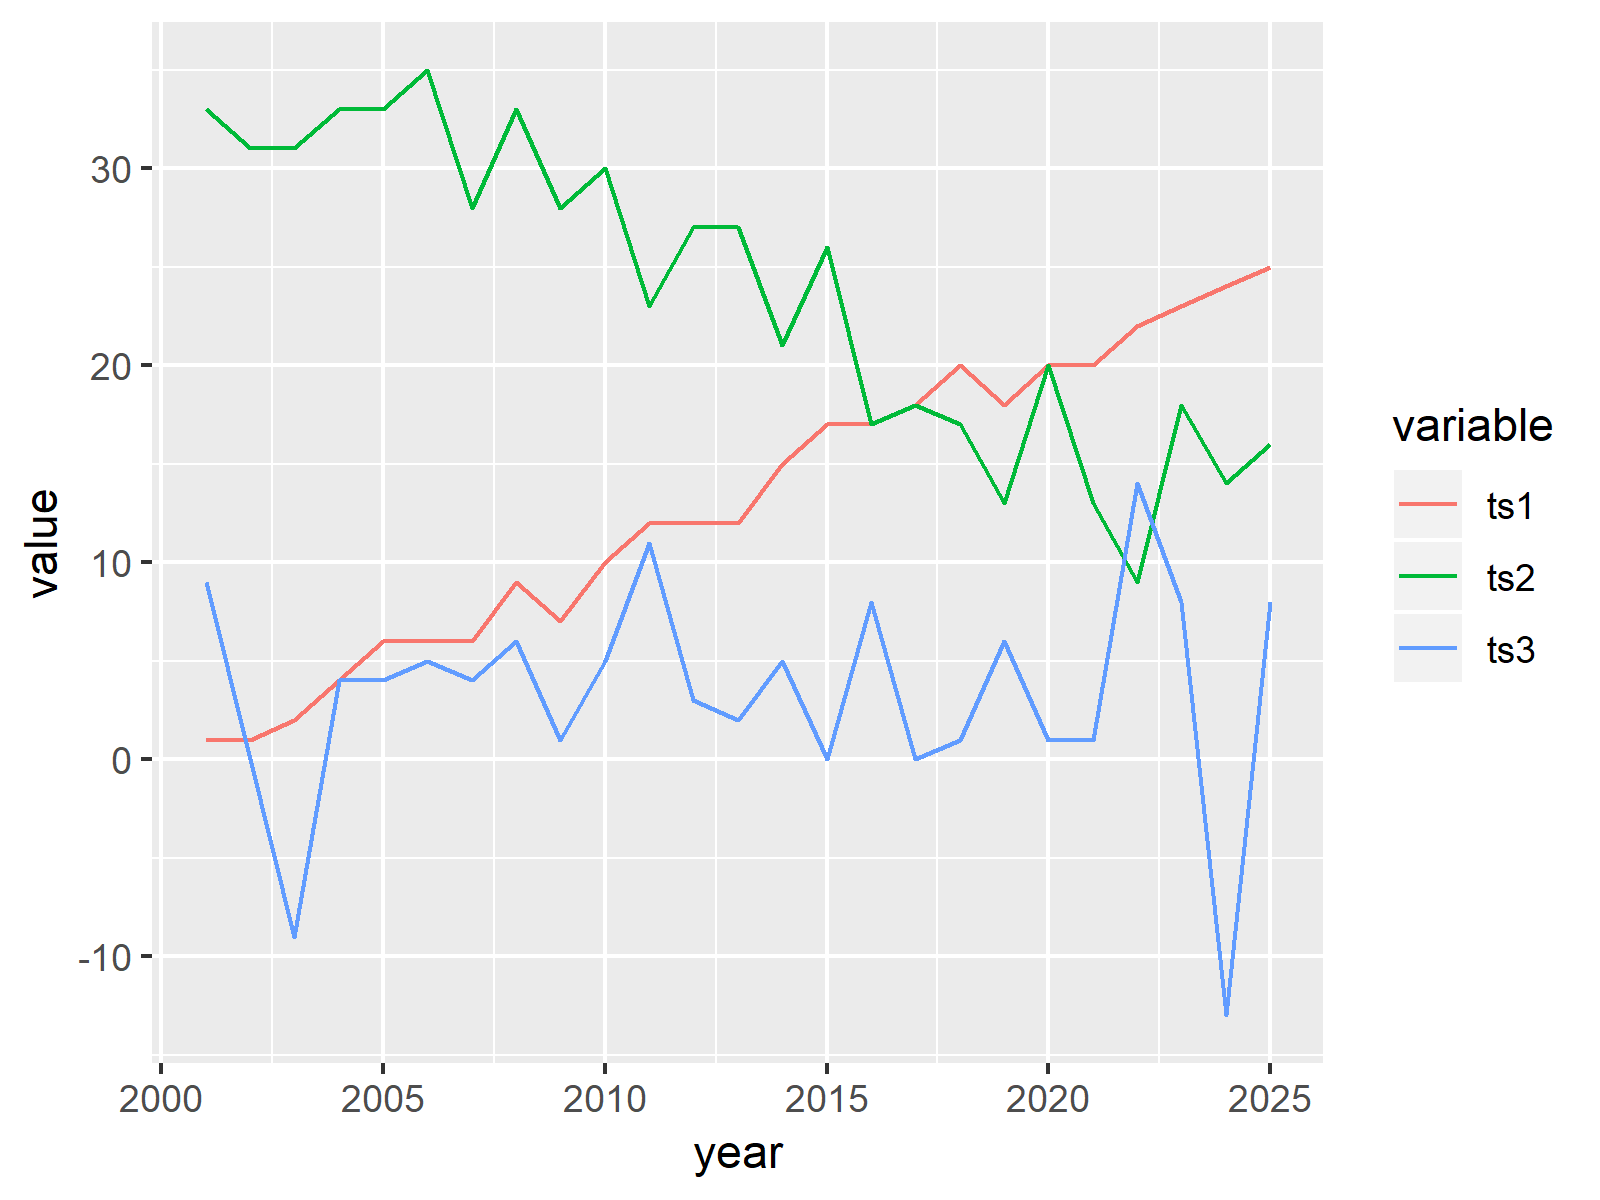
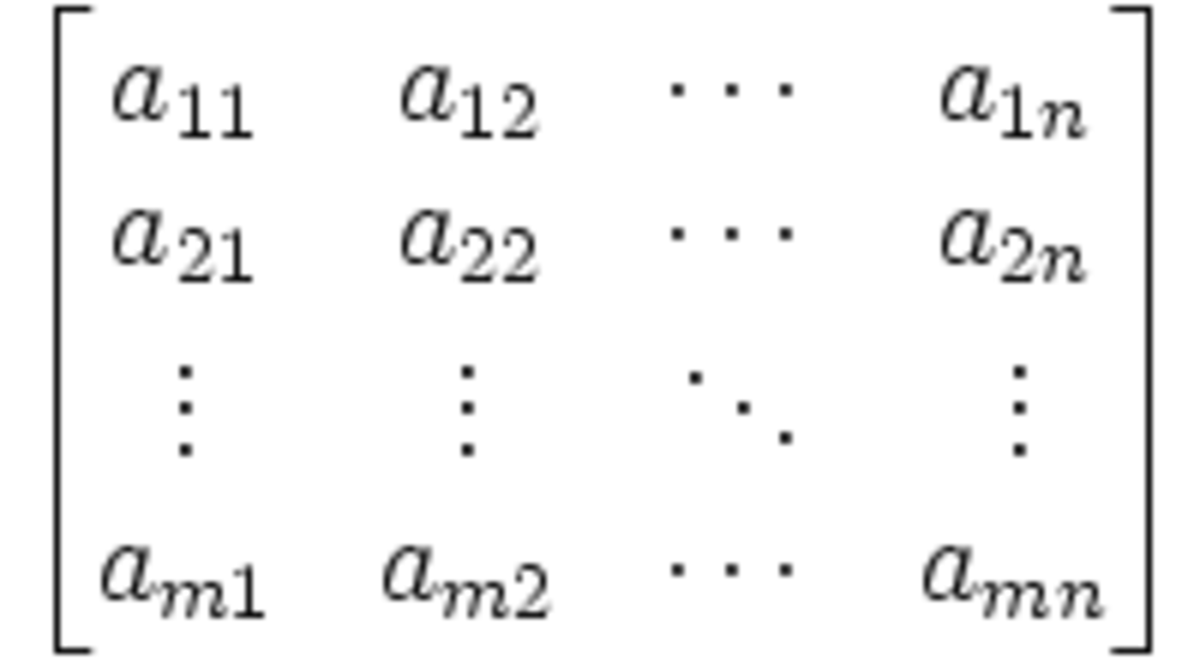
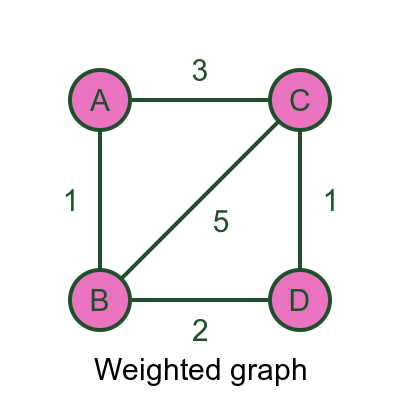
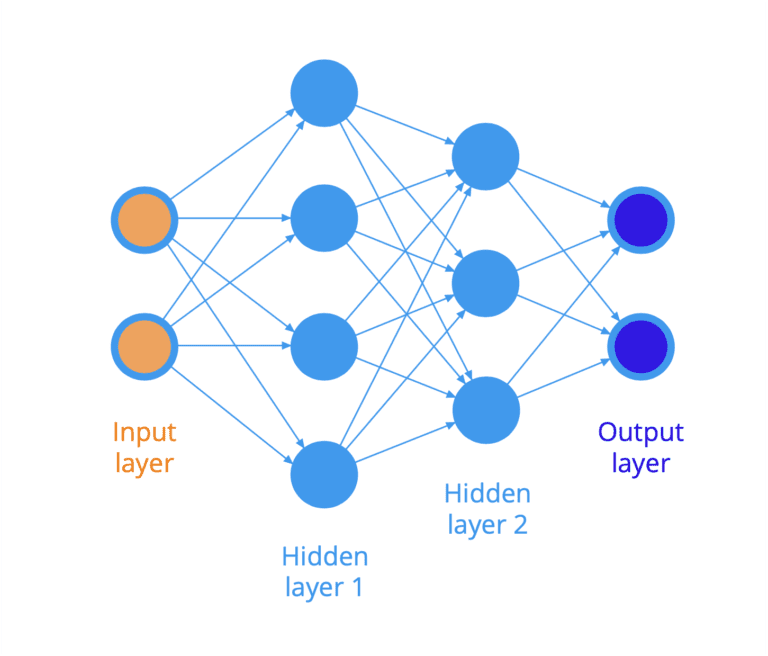
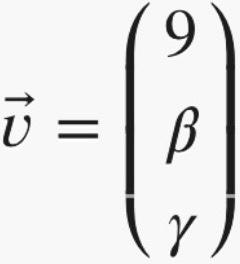
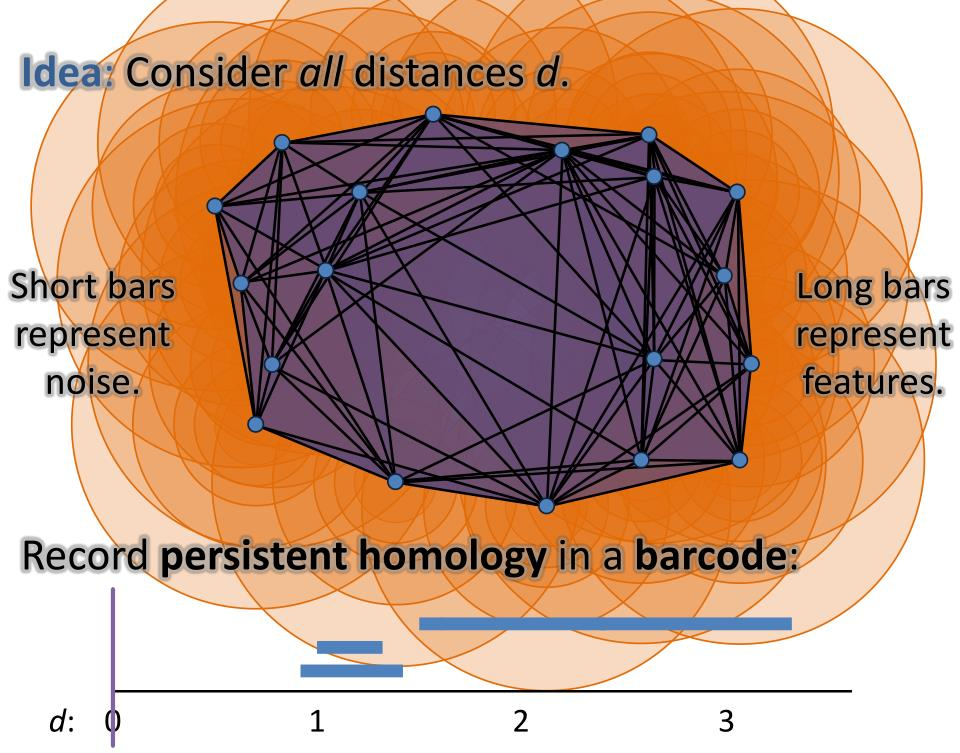
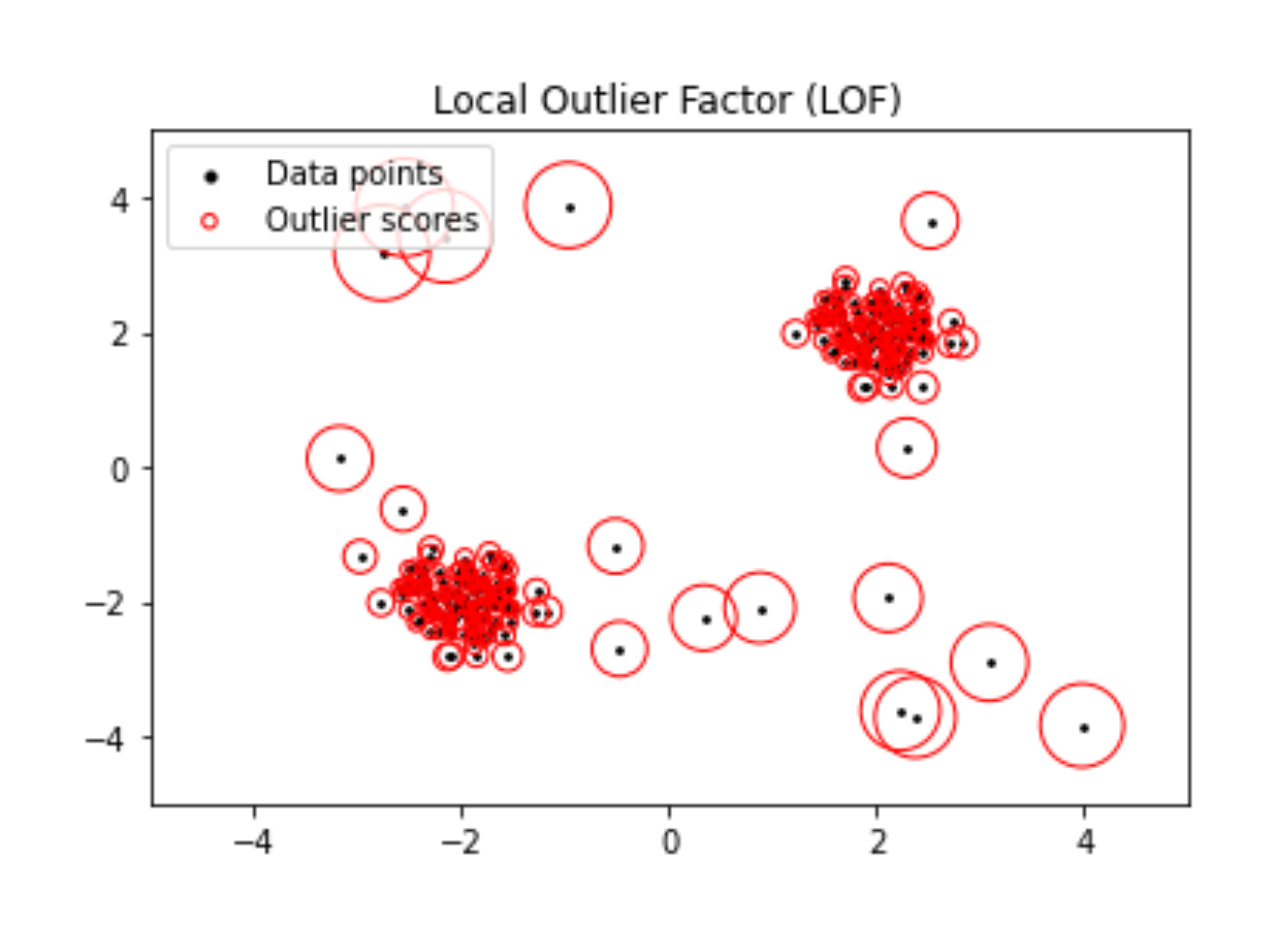
Figure 1: The end-to-end pipeline for transforming TSX-60 time series into graph-based and vectorial representations, subsequently analyzed for financial anomaly detection using PCA, TDA, and GNN methodologies.
The dataset spans 4254 trading days from 2005–2021 and covers 39 continuously listed TSX-60 equities. Major financial stress events are referenced against the Canadian Financial Stress Index (CFSI), aligning the anomaly detection task with periods of documented systemic stress in Canadian markets.
Construction of Graph Representations and Feature Extraction
Correlations among equity log-returns—computed via Convergent Cross Mapping (CCM) within sliding windows—yield a dynamic sequence of weighted adjacency matrices. These are thresholded to retain only positive edge weights, forming time-indexed networks.
Graph Neural Networks (GNNs)
Two unsupervised GNN variants are evaluated:
- One-Shot GIN(E): Implements deep one-class learning, centering graph-level representations and using the distance from a learned center as the anomaly score. GINE convolution layers are employed to encode edge attributes.
- GlocalKD (GINE): Employs a knowledge distillation paradigm, training a student GNN to match the output of a fixed, random teacher network. Anomaly scores are dominated by reconstruction losses on graph-level features (with a smaller contribution from node-level discrepancies).
Both GNNs rely on unsupervised training objectives and exploit global structural patterns within financial correlation graphs.
Topological Data Analysis (TDA)
Persistent homology is computed from the directed flag complex filtration associated with each temporal network. Barcodes in dimensions 0 and 1 capture the evolving topological structure across the filtration. The L1 and L2 norms of the persistence diagrams serve as compact indicators of topological anomaly.
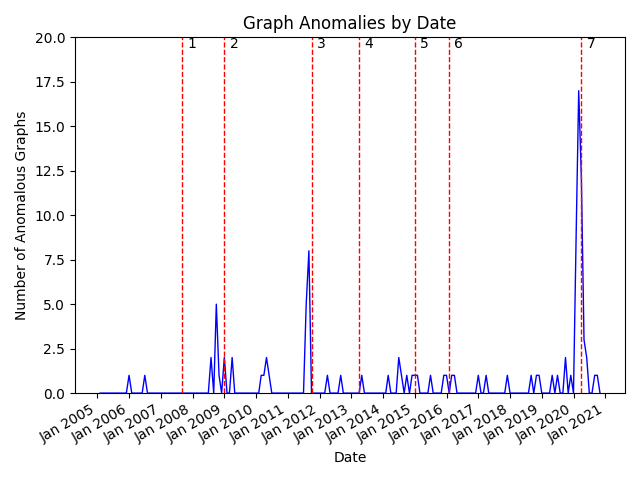
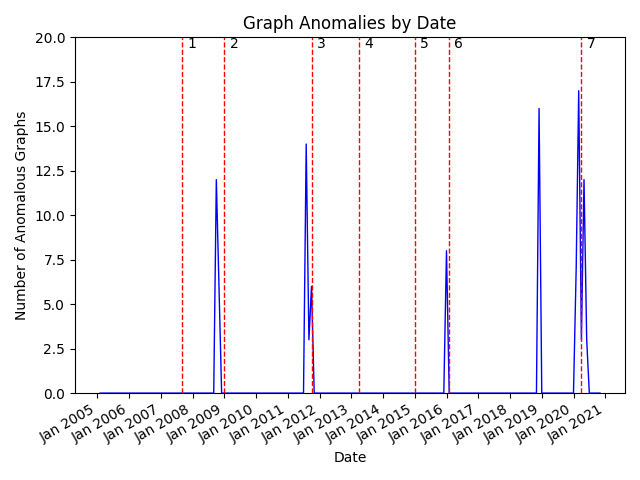
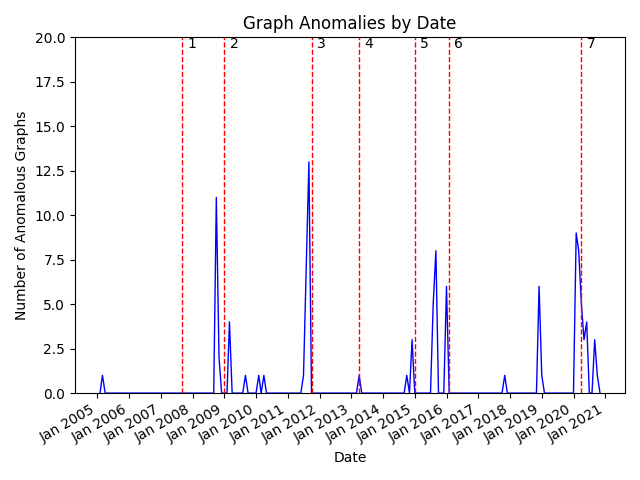
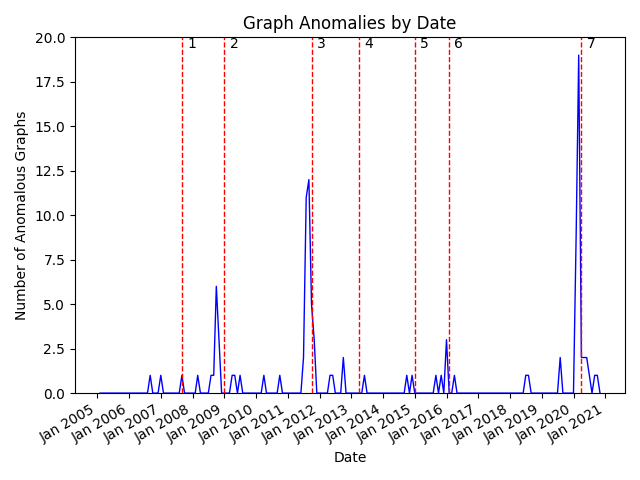
Figure 2: Persistent barcodes encoding the temporal evolution of topological features in the correlation networks constructed from TSX-60 equities.
Principal Component Analysis (PCA)
Vectorized correlation matrices (raw, or projected to lower-dimensional subspaces, e.g., 10 or 100 principal components) are used as features for standard outlier detection.
Anomaly Scoring and Detection
For TDA and PCA, Mahalanobis distance and LOF are the primary anomaly scoring techniques. In GNNs, model-based reconstruction errors yield anomaly scores. A detection threshold at the 97.5th percentile of the empirical score distribution is used; a window-based aggregation detects stress events when at least one anomalous score appears within 50 business days prior to a CFSI event.
Empirical Evaluation and Numerical Results
Extensive experiments demonstrate substantial performance differentials between the evaluated paradigms:
- Neural network-based methods (GlocalKD (GINE), One-Shot GIN(E)): Attain the highest f-scores (0.68 and 0.60, respectively).
- TDA-based methods: Achieve intermediate f-scores (0.55–0.59).
- PCA and raw features: Lag with substantially lower f-scores (0.28–0.45).
Notably, NN and TDA strategies exhibit greater precision—successfully discriminating not only major systemic events (e.g., 2009 financial crisis, Greek debt crisis, COVID-19) but also smaller-scale market stress phenomena (e.g., the 2015–2016 oil price collapse).
Persistent homology analyses reveal that topological signals often precede or coincide with these episodes, underscoring the predictive signal embedded in global graph structure. The next figure visualizes these barcodes for TSX-60 around stress periods.
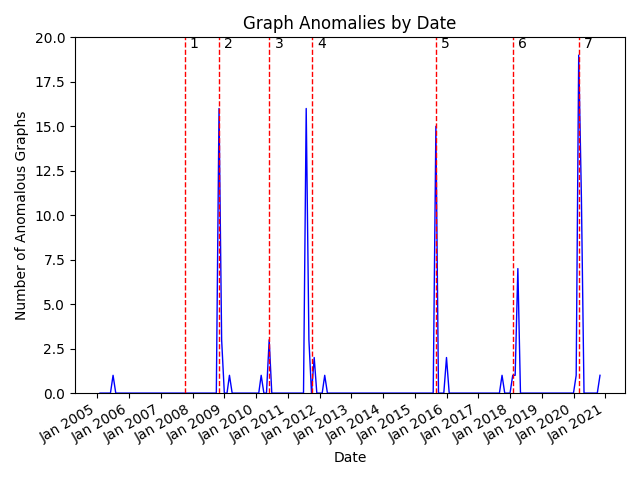
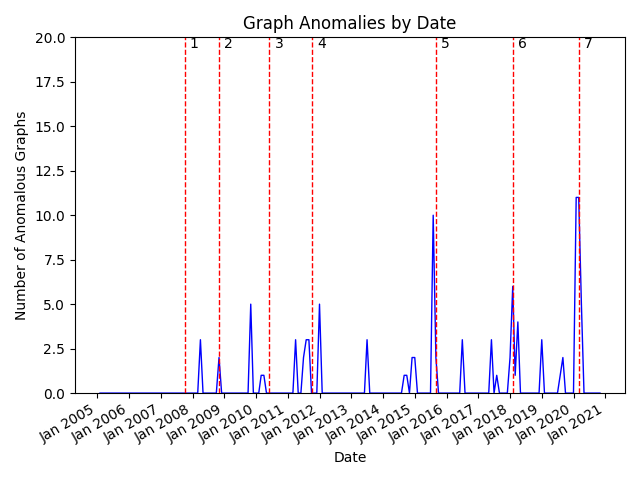
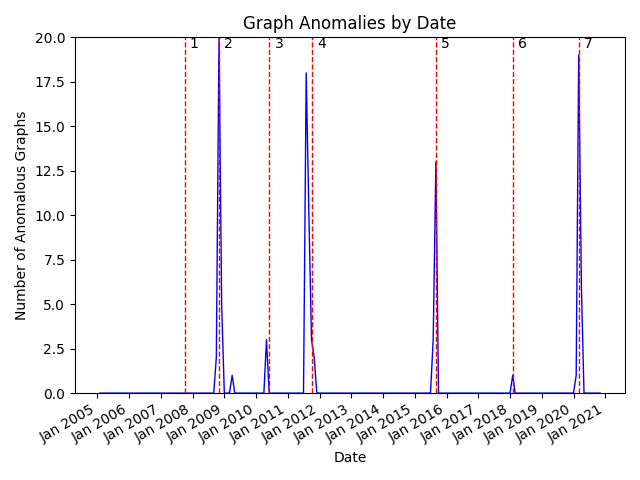
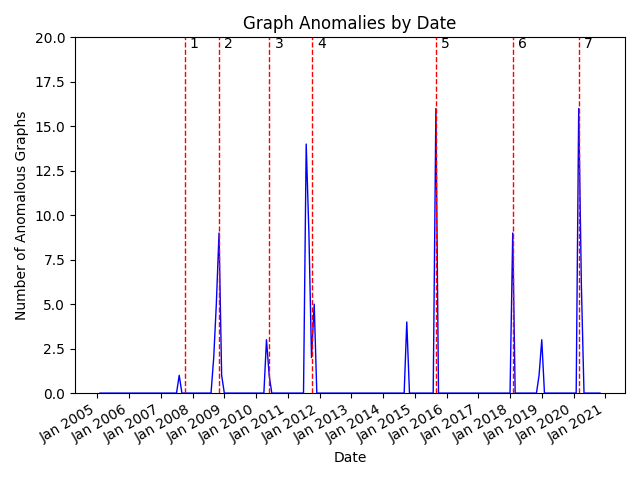
Figure 3: Persistent barcodes exhibit topological anomalies aligned temporally with known episodes of financial stress in the Canadian market.
Further comparisons show that both the top-ranked NN and TDA models exhibit superior recall relative to PCA, enhancing early warning capabilities.
Theoretical and Practical Implications
The outcomes corroborate the hypothesis that global structural properties of financial networks—captured via persistent homology and deep graph networks—are key discriminants of market stress. The superior recall and precision of these models signal the advantage of multilayered (topological and graph-based) representations over approaches based solely on feature aggregation or linear dimension reduction.
Additionally, TDA's capacity to isolate minor events and regime shifts suggests that topological noise and high-order network motifs are sensitive detectors of emergent systemic risks. In contrast to mixed results in neuroimaging graph analysis, these findings support persistent homology as a robust descriptor in financial correlation networks, likely owing to the hierarchical and non-local propagation of market shocks.
The practical implication is a pathway to data-driven early warning systems for financial risk management, with potential applications in regulatory monitoring, portfolio stress testing, and real-time market surveillance. The combination of interpretable topological features and highly expressive neural network representations yields both signal diversity and explanatory potential.
Future Directions
Opportunities for future work include:
- Integration of market microstructure data or macroeconomic covariates within this framework.
- Development of hybrid models fusing persistence-based embeddings and deep GNNs in a unified anomaly detection pipeline.
- Adaptation to high-frequency and cross-market contagion analysis.
- Extension to explainable anomaly attribution leveraging the structural decomposability of TDA and the attention mechanisms within GNNs.
Conclusion
By systematically benchmarking TDA, PCA, and advanced GNN-based techniques for anomaly detection on TSX-60 and DJIA financial networks, this study establishes the predominance of models capturing global graph structure. The demonstrated value of persistent homology and GNN embeddings for early detection of both systemic and localized stress events has significant implications for risk modeling and market state monitoring. The empirical evidence supports a paradigm shift toward graph-centric and topological analytics as essential tools in financial anomaly detection.