- The paper introduces TraversalBench, a controlled benchmark that isolates exact visual path traversal to evaluate VLMs under varying geometric complexities.
- The paper details rigorous experiments across six VLMs, showing that self-intersections trigger sharp accuracy drops despite high token-level performance.
- The paper underscores that enhancing spatial attention and image-grounded reasoning, rather than merely increasing reasoning tokens, is key to improving VLM robustness.
TraversalBench: A Diagnostic Benchmark for Path-Faithful Visual Reasoning in VLMs
Motivation and Benchmark Design
TraversalBench is introduced as a controlled diagnostic for evaluating vision-LLMs (VLMs) on the specific challenge of exact visual path traversal. Unlike prior benchmarks that conflate OCR, plan generation, semantic parsing, and domain expertise, TraversalBench isolates visual tracing in a knowledge-light setting. Each benchmark instance consists of a single polyline with uniquely marked vertices and a designated start marker; the task is to enumerate the ordered sequence of markers encountered from start to finish.
The benchmark is systematically designed to balance four key structural difficulty factors: self-intersection count, tortuosity (measured over a scale extending well beyond typical naturalistic values), vertex count, and the presence of confounding lines that introduce distractor structure without affecting the target path. The generation protocol enforces strong geometric constraints to ensure that local rendering artifacts do not mediate task difficulty. The result is a testbed finely stratified across interpretable axes of visual complexity, enabling rigorous error analysis.
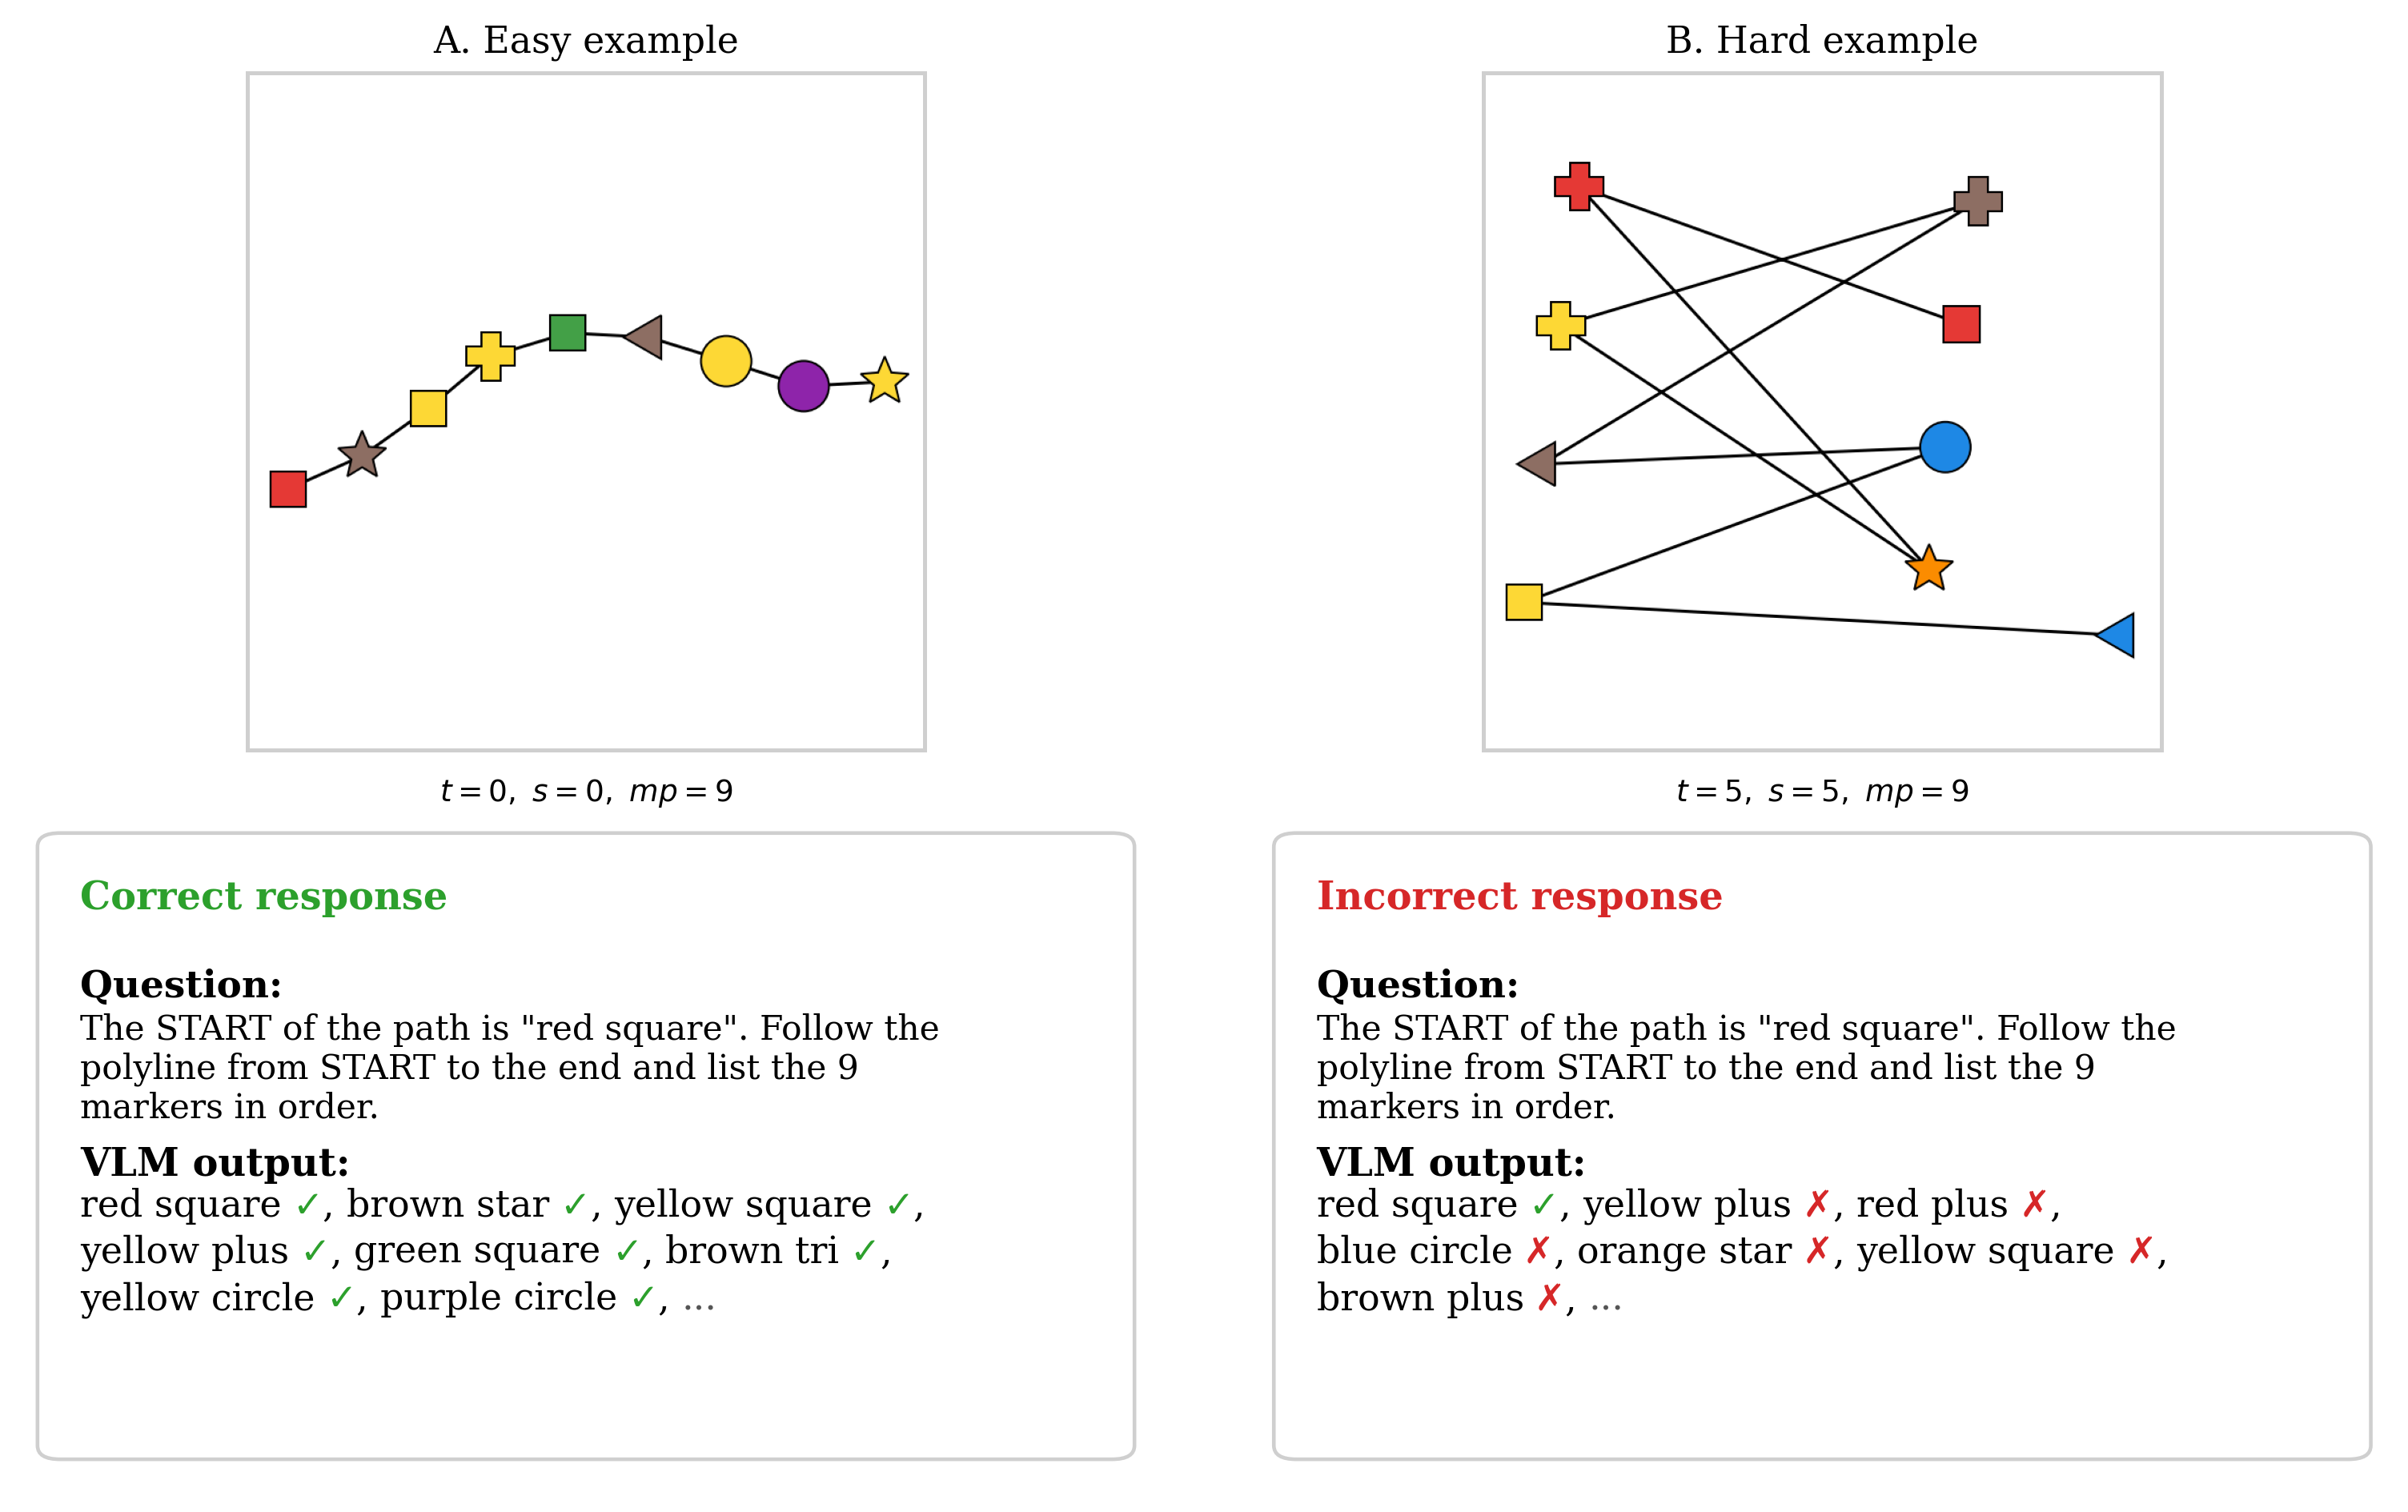
Figure 1: Examples contrasting correct tracing on a low-complexity path versus erroneous output on a high-tortuosity, high-self-intersecting path.
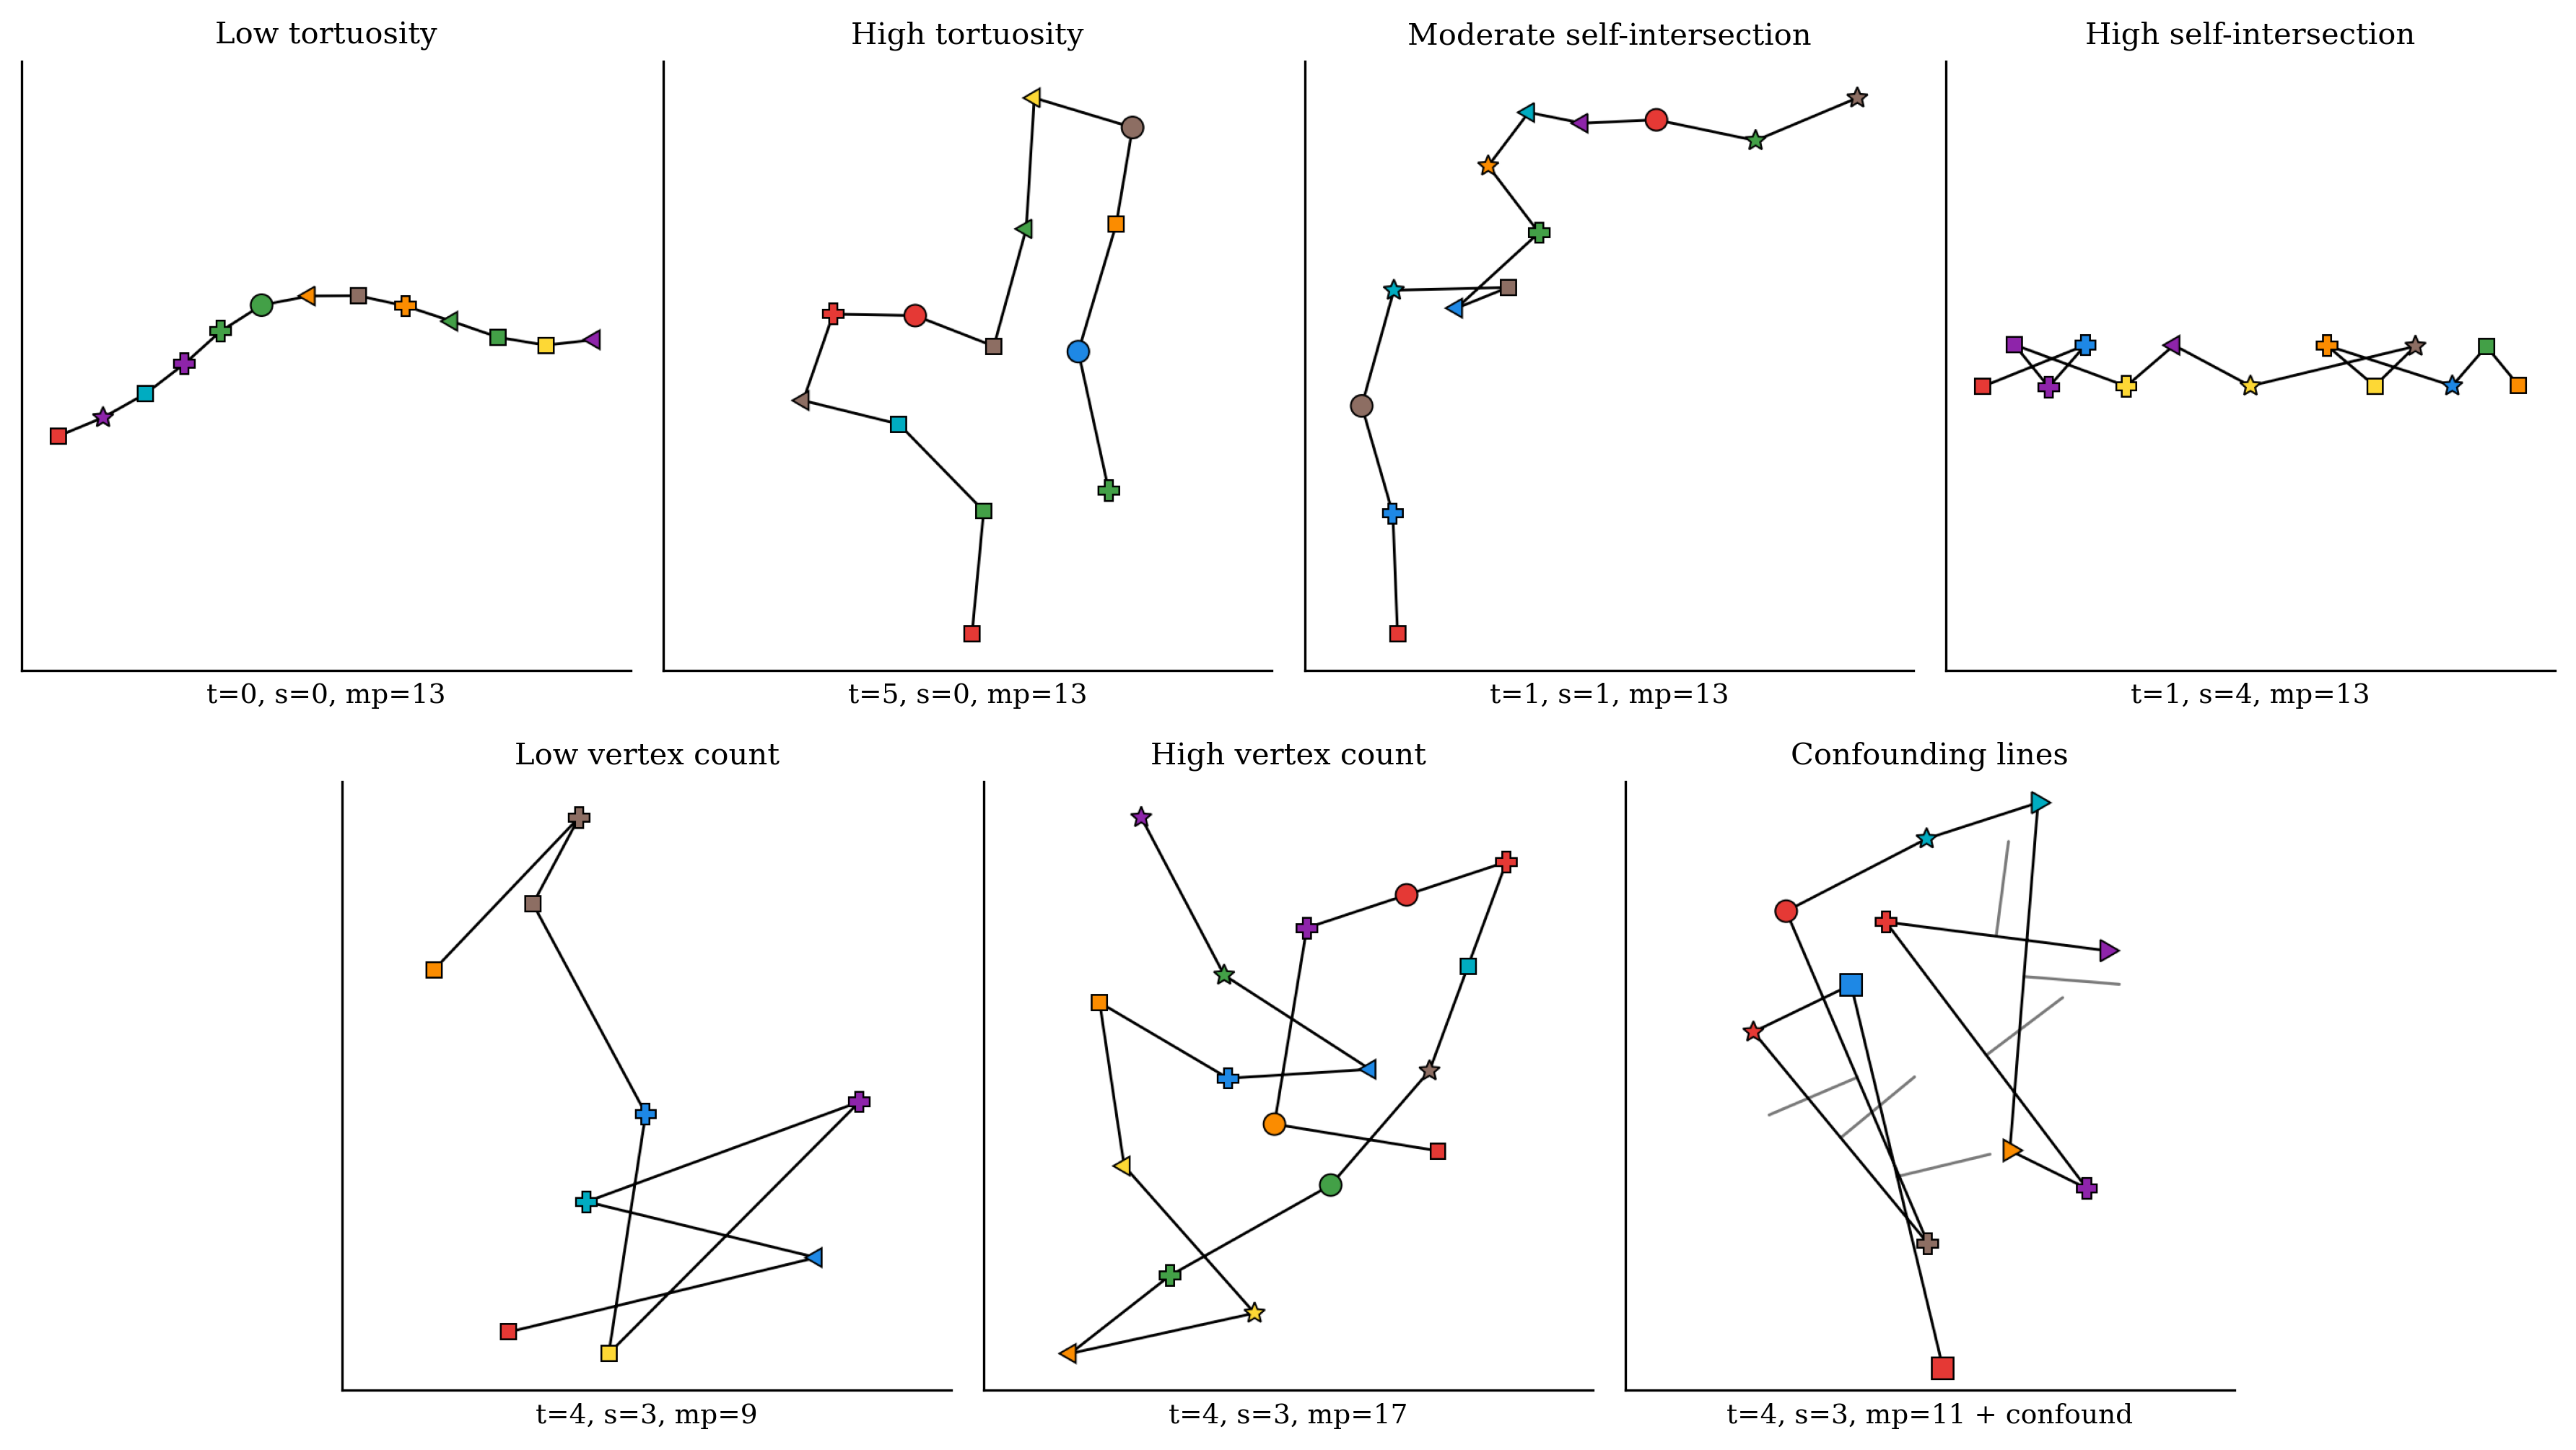
Figure 2: Illustration of the axes of path complexity: tortuosity, self-intersection, vertex count, and confounding lines.
Experimental Setup and Main Findings
The evaluation spans six leading open and proprietary VLMs: Gemini 3.1 Pro (low/auto), GPT-5.4, Gemini 3.1 Flash Lite, Claude Opus 4.6, and Qwen3-VL 32B. A shared prompting template is used, with output format optimized for model parsing compliance. Exact-match accuracy (EM) and token-level accuracy (TokAcc) are the core metrics.
The headline result is that self-intersections are the principal source of model failure. On the base benchmark, Gemini 3.1 Pro (low) achieves the highest scores (0.823 EM, 0.949 TokAcc), with a large gap to the next strongest model (Gemini 3.1 Pro auto: 0.814/0.922, GPT-5.4: 0.782/0.891). Weaker models—Gemini Flash Lite, Claude Opus, Qwen3— trail markedly. The consistently large disparity between EM and TokAcc shows that errors mostly correspond to localized mistakes rather than global collapse: models can often correctly trace large path prefixes before making a critical misstep.
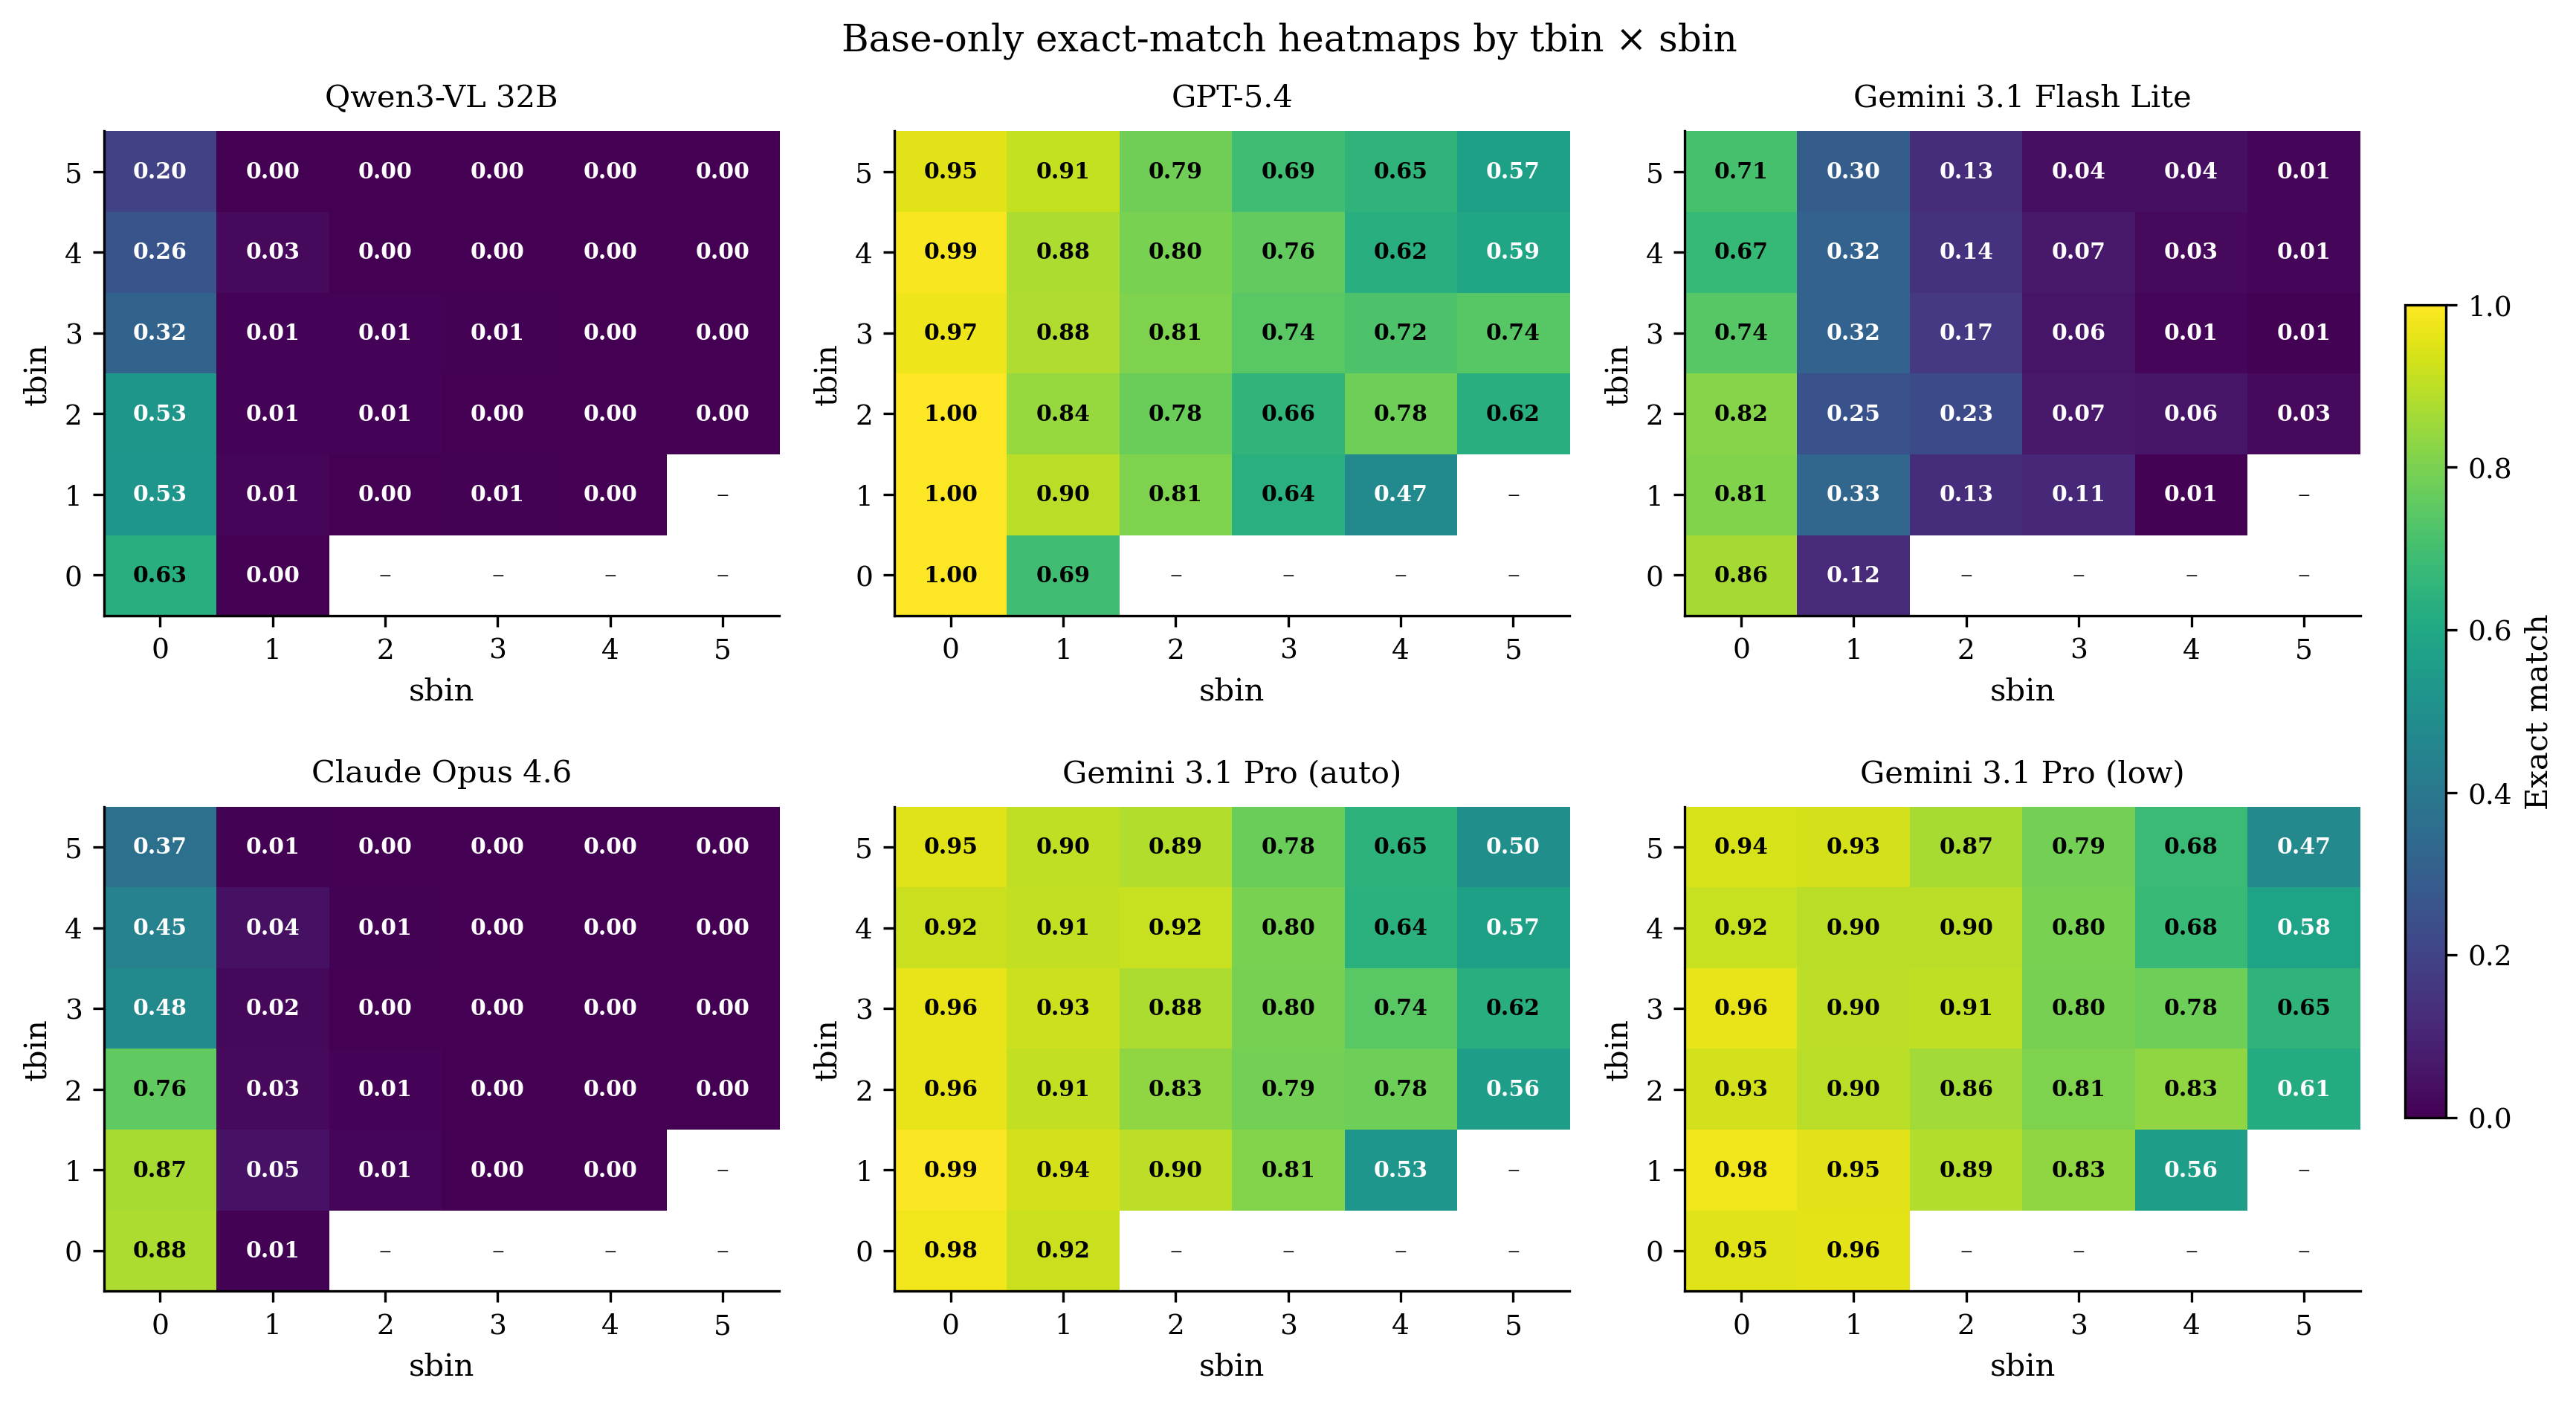
Figure 3: Model accuracy as a function of tortuosity and self-intersection, showing steep degradation when both factors are large.
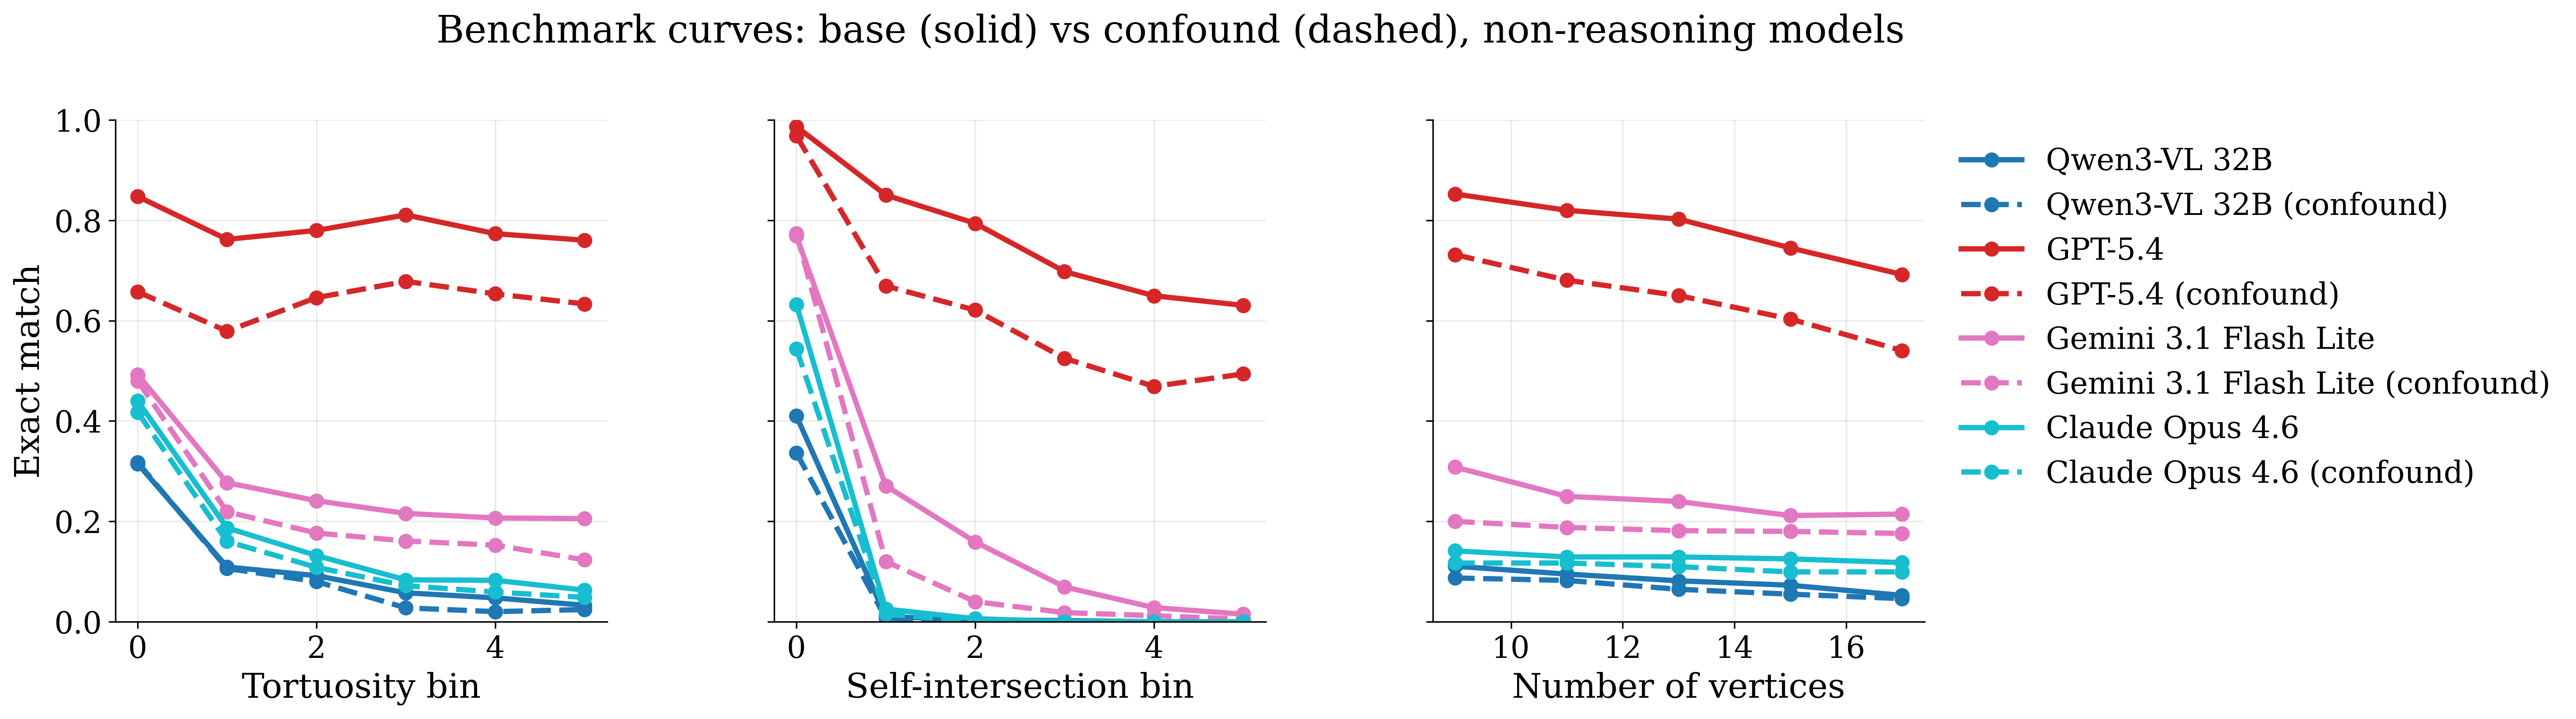
Figure 4: Marginal accuracy plotted against complexity axes; self-intersection count has the steepest impact, with tortuosity and vertex count inducing additional but weaker declines.
Factorial Analysis: Self-Intersections and Confounding Lines
A critical analytic innovation is the decoupling of difficulty factors. The dominant effect emerges along the self-intersection axis: even before a crossing, models demonstrate slightly reduced accuracy; at the crossing itself, there is a sharp and localized performance cliff. This is diagnostic of a failure to maintain robust image-grounded state under local ambiguity. In contrast, confounding lines result in a weaker but cumulative degradation. The cumulative distractor effect of multiple confounds differs qualitatively from the abrupt impact of a self-intersection.
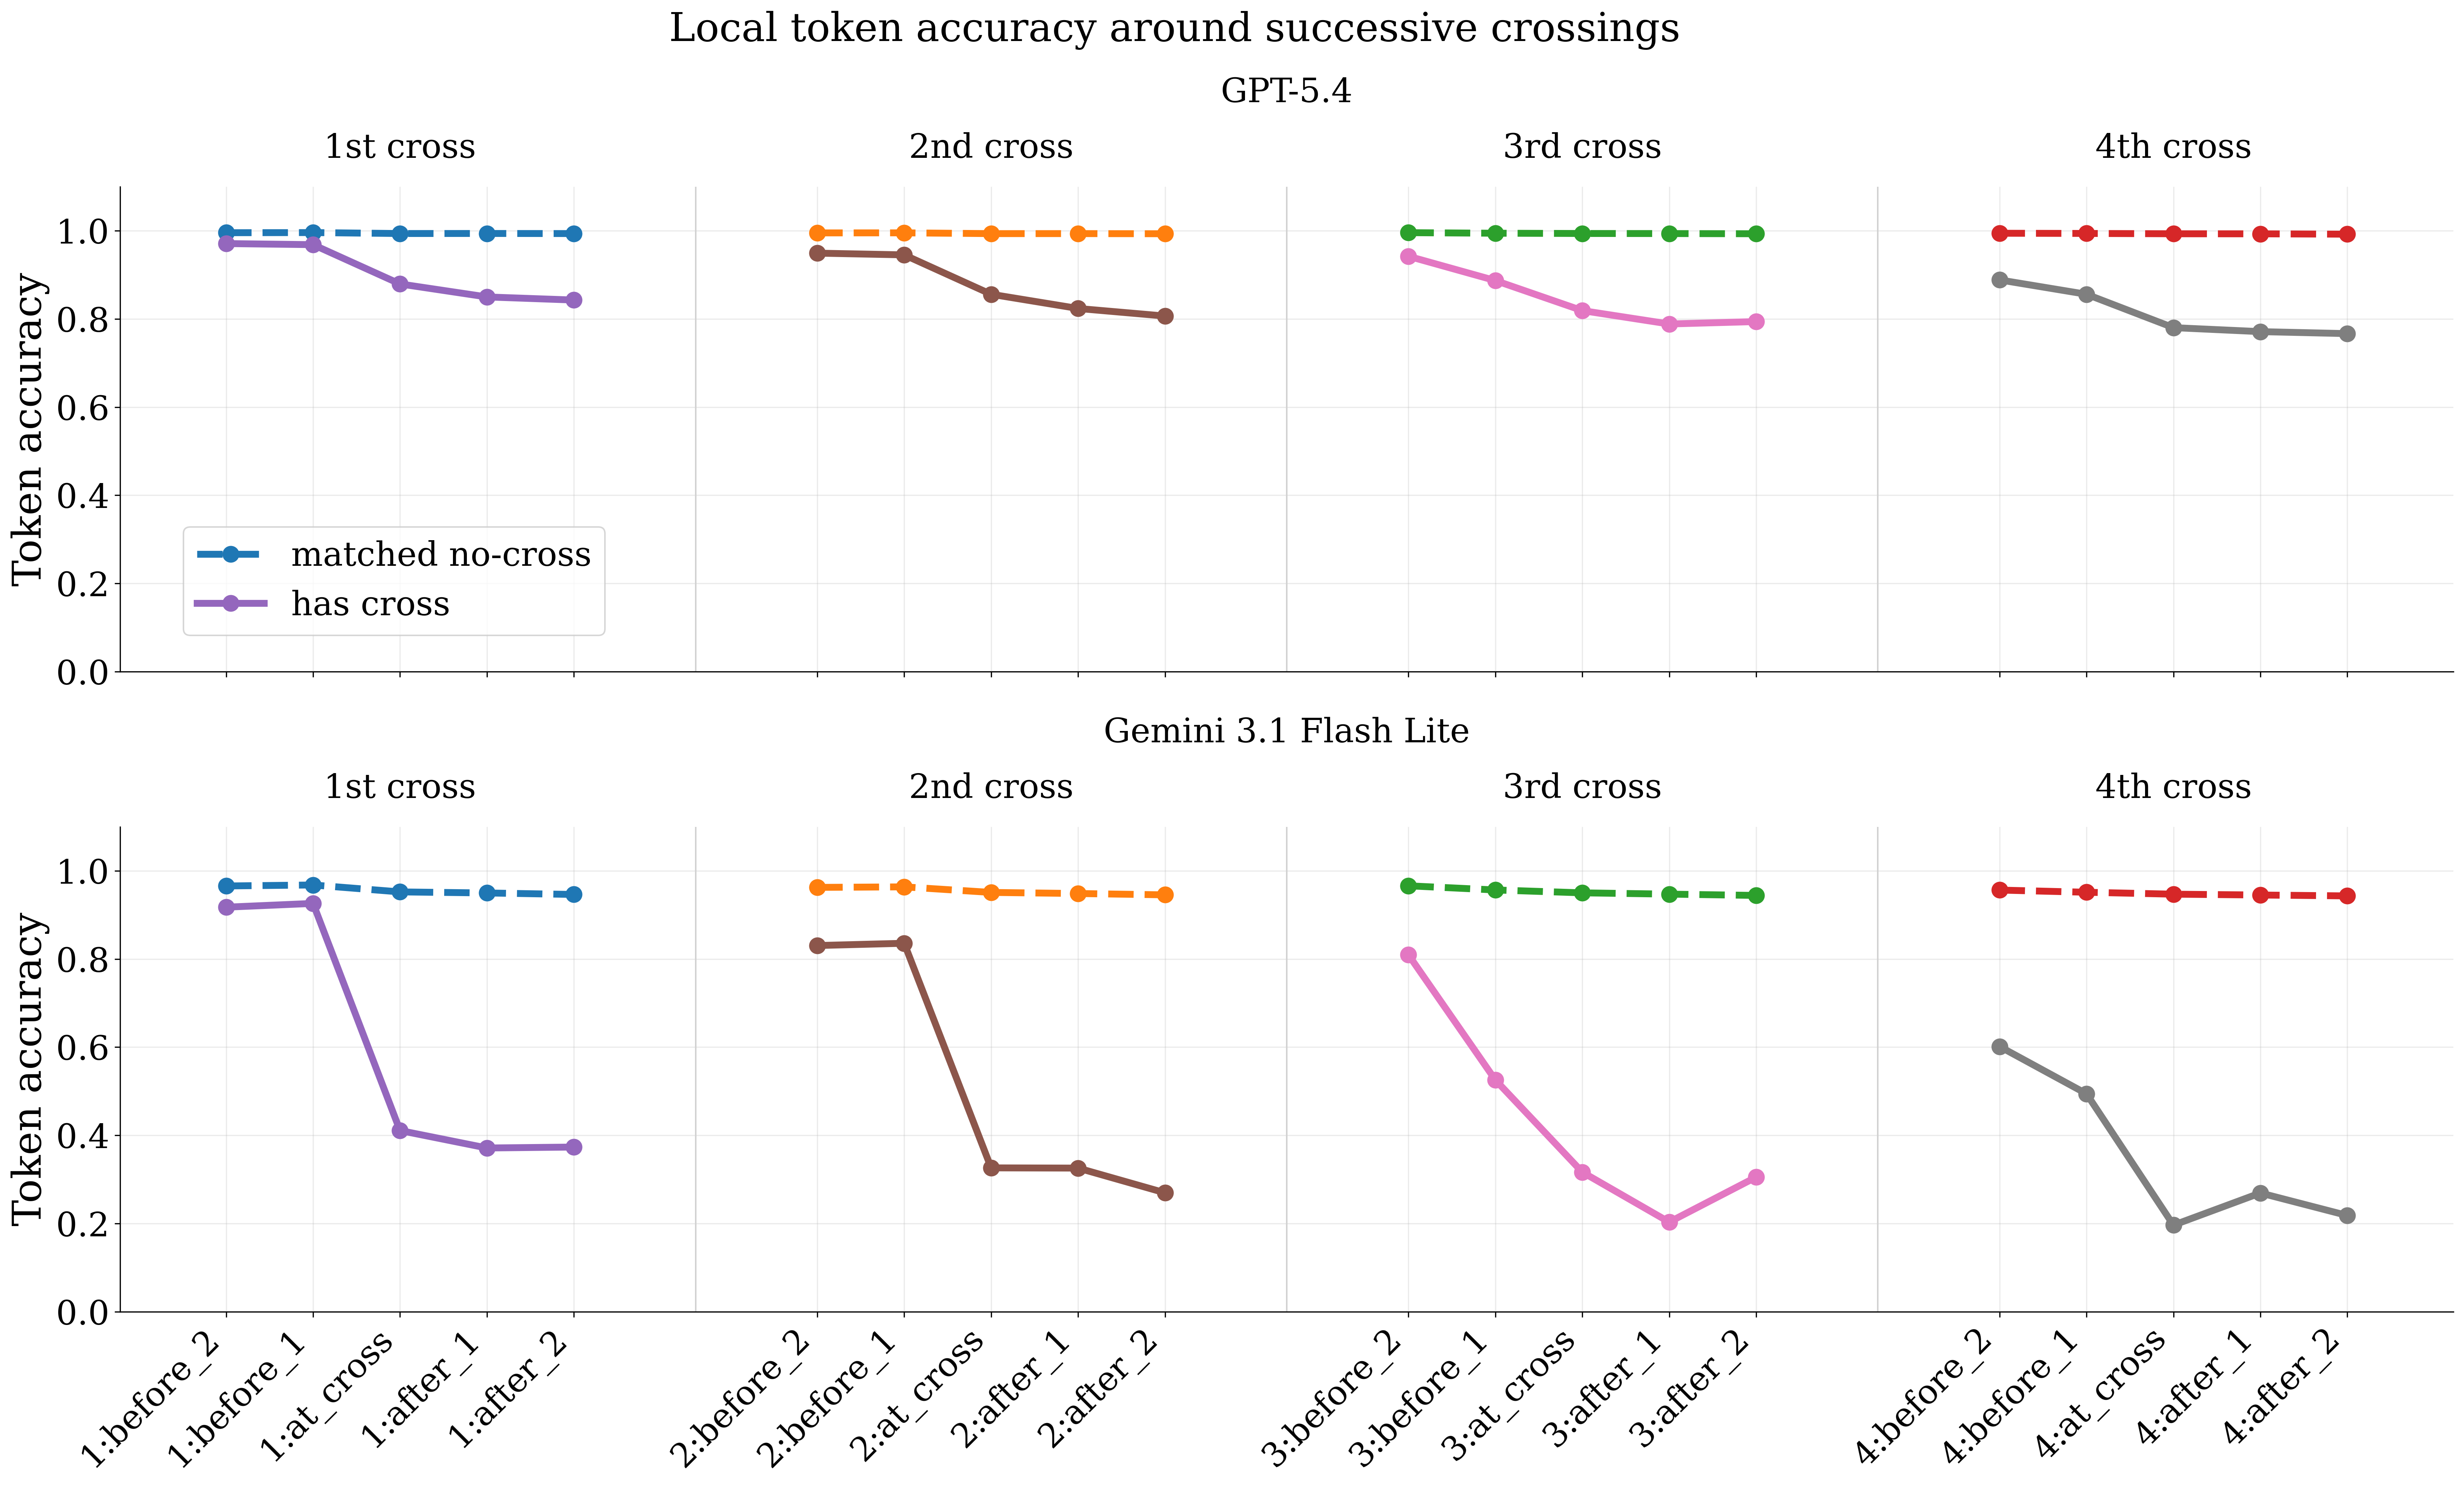
Figure 5: Per-token accuracy around path crossings: high stability pre-crossing followed by a sharp drop at the point of intersection.
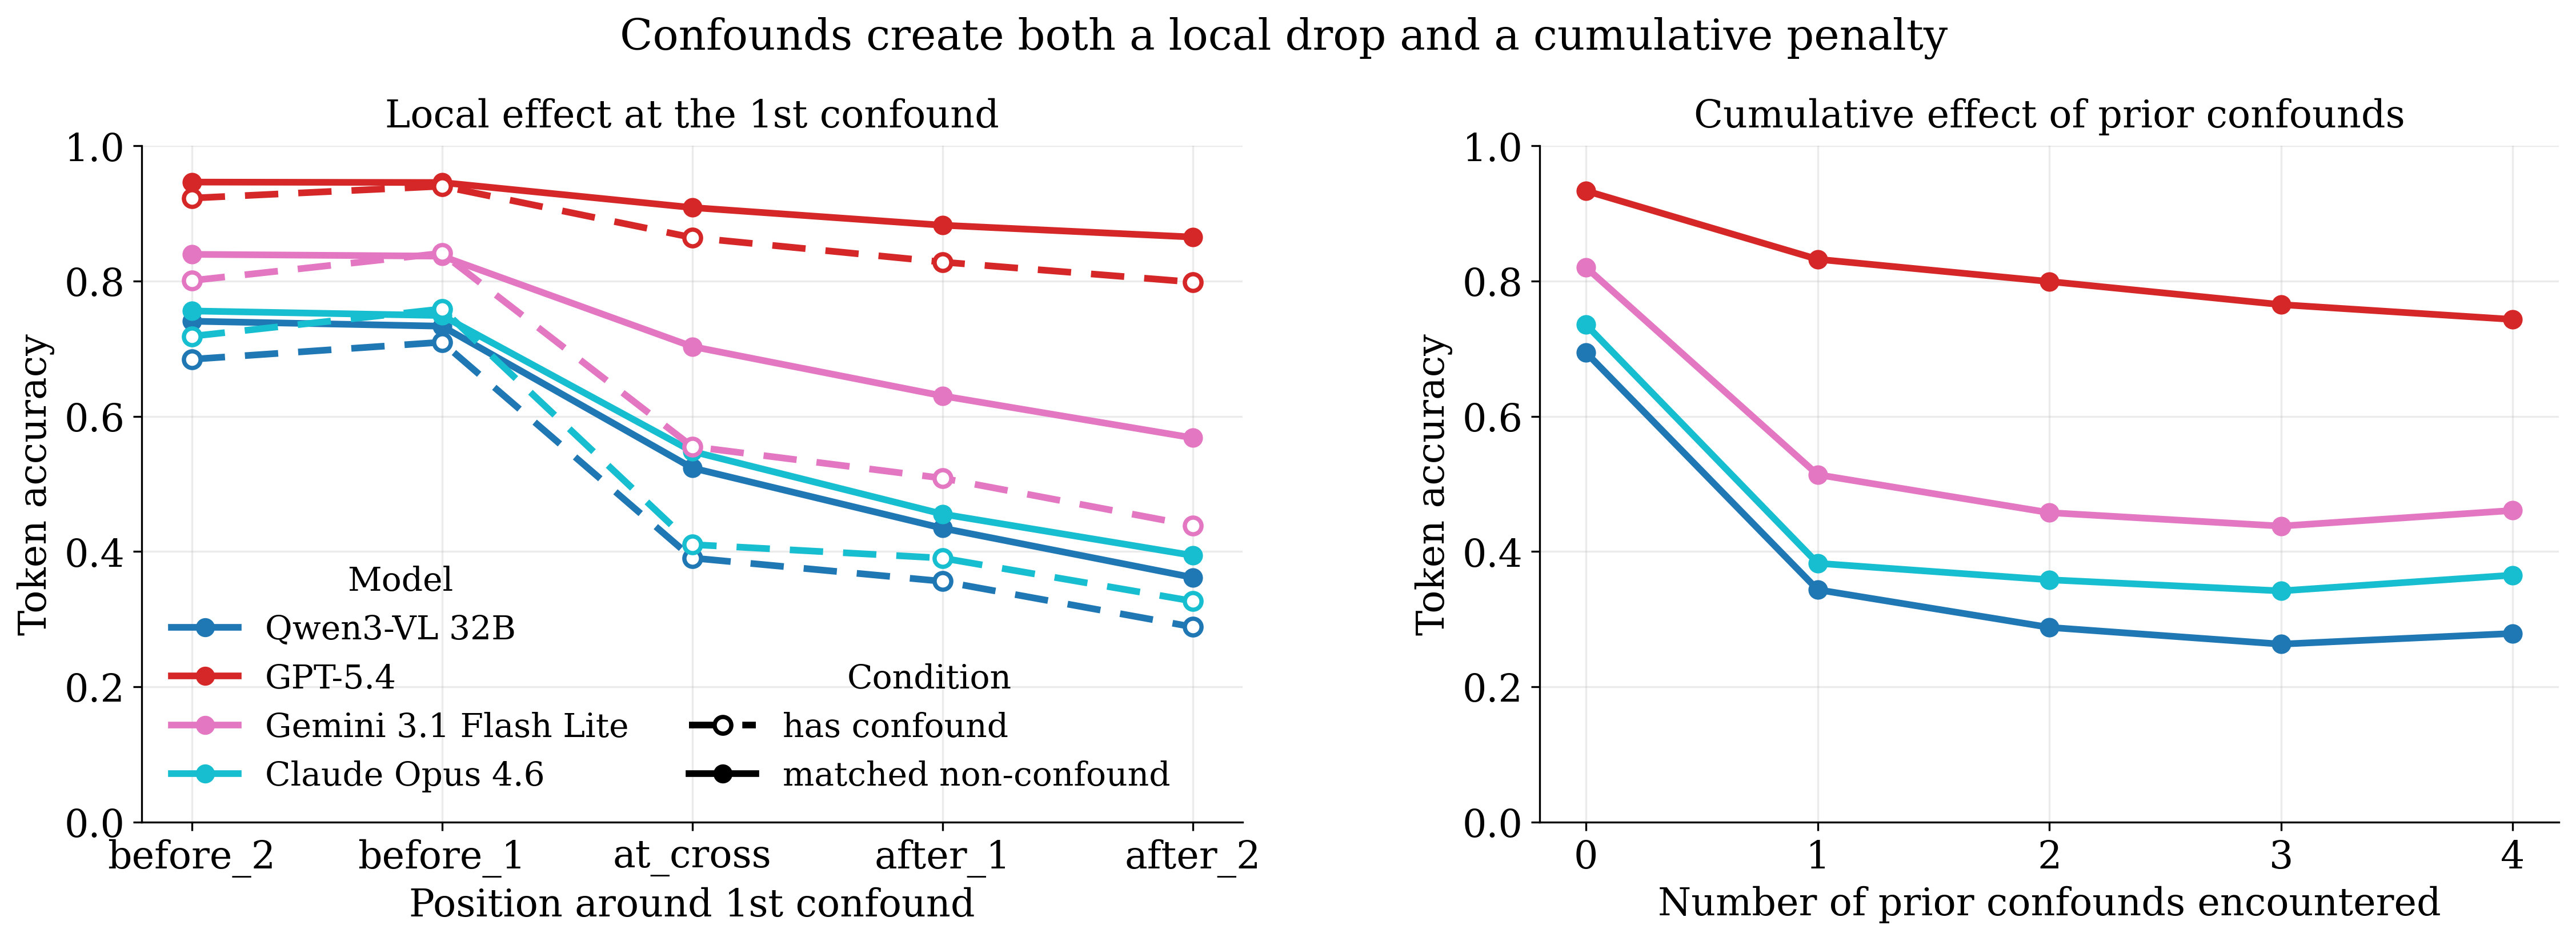
Figure 6: Token accuracy degrades locally at encounter with a confound (left) and further as more confounds are traversed (right).
Auxiliary Analysis: Layout Priors and Reading Order
To disambiguate the extent to which errors might be due to learned layout or serialization biases, TraversalBench includes an auxiliary reading-order test suite. Here, path layouts are explicitly structured along four scan regimes (e.g., left-to-right, top-to-bottom, etc.). There is a consistent preference across models for left-to-right/top-to-bottom-compatible layouts; however, regime preferences do not explain away the main complexity effects attributable to path structure (tortuosity, self-intersection).
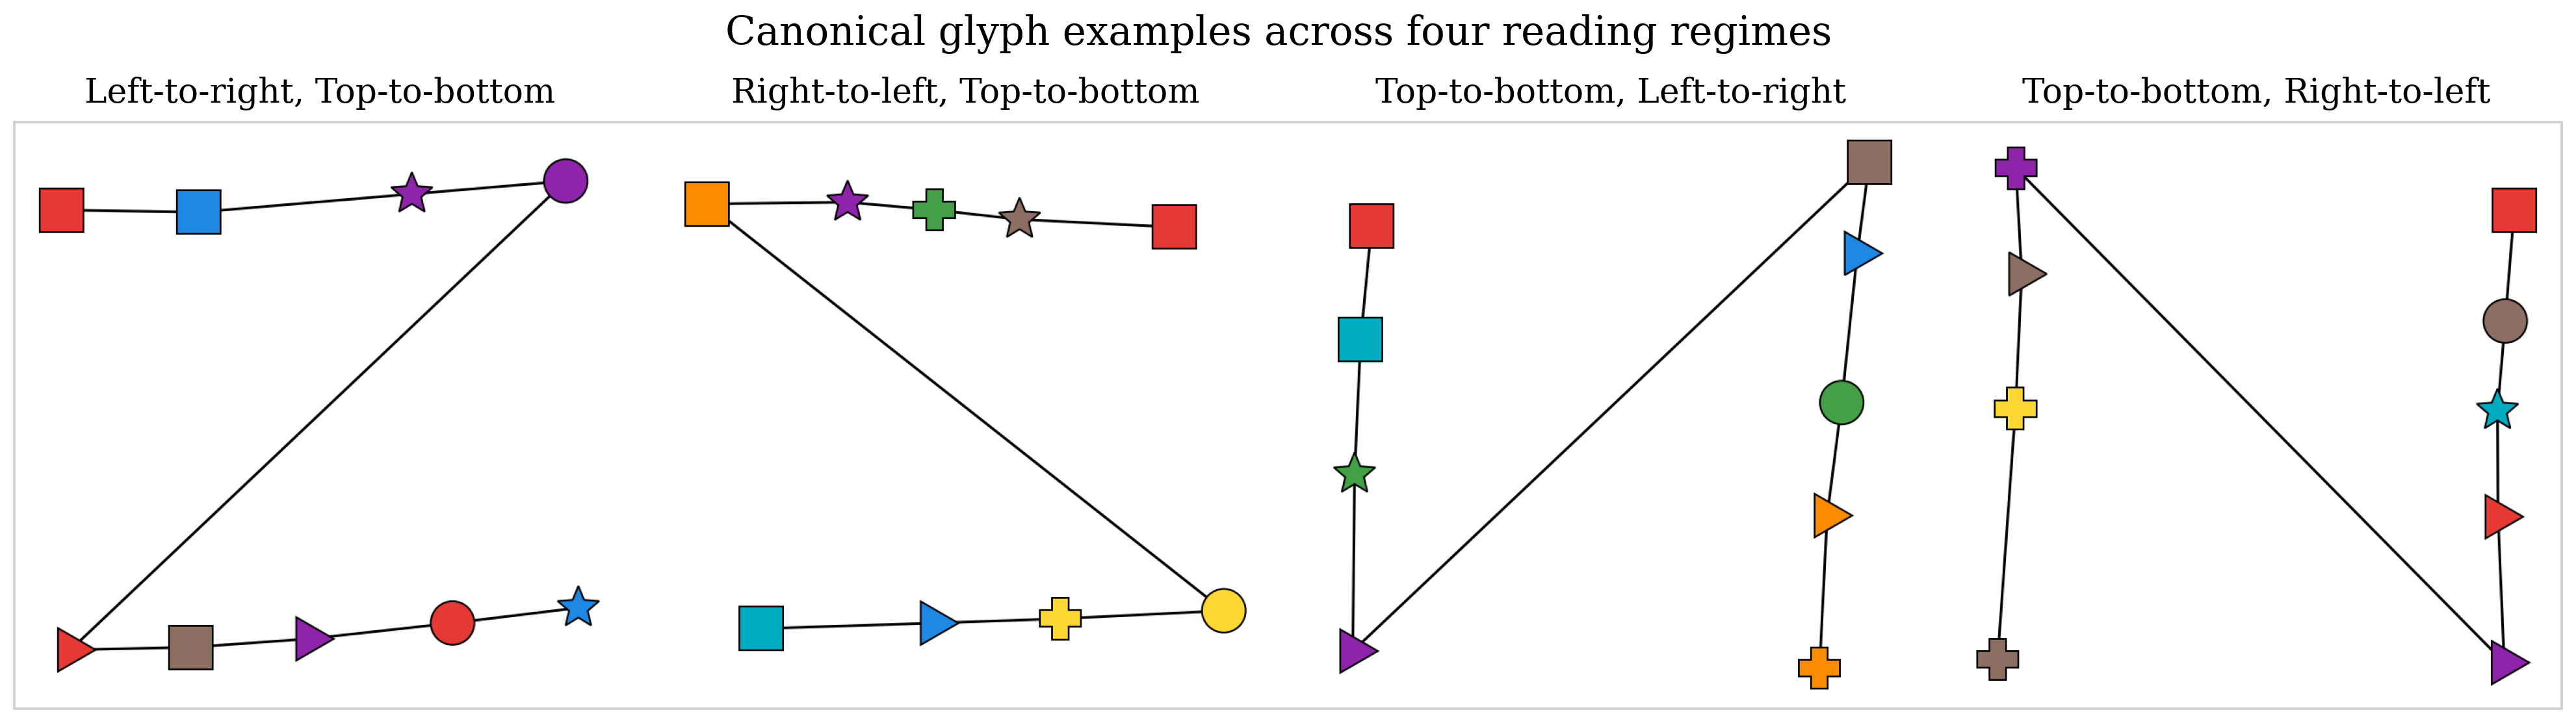
Figure 7: Example layouts for each reading-order regime.
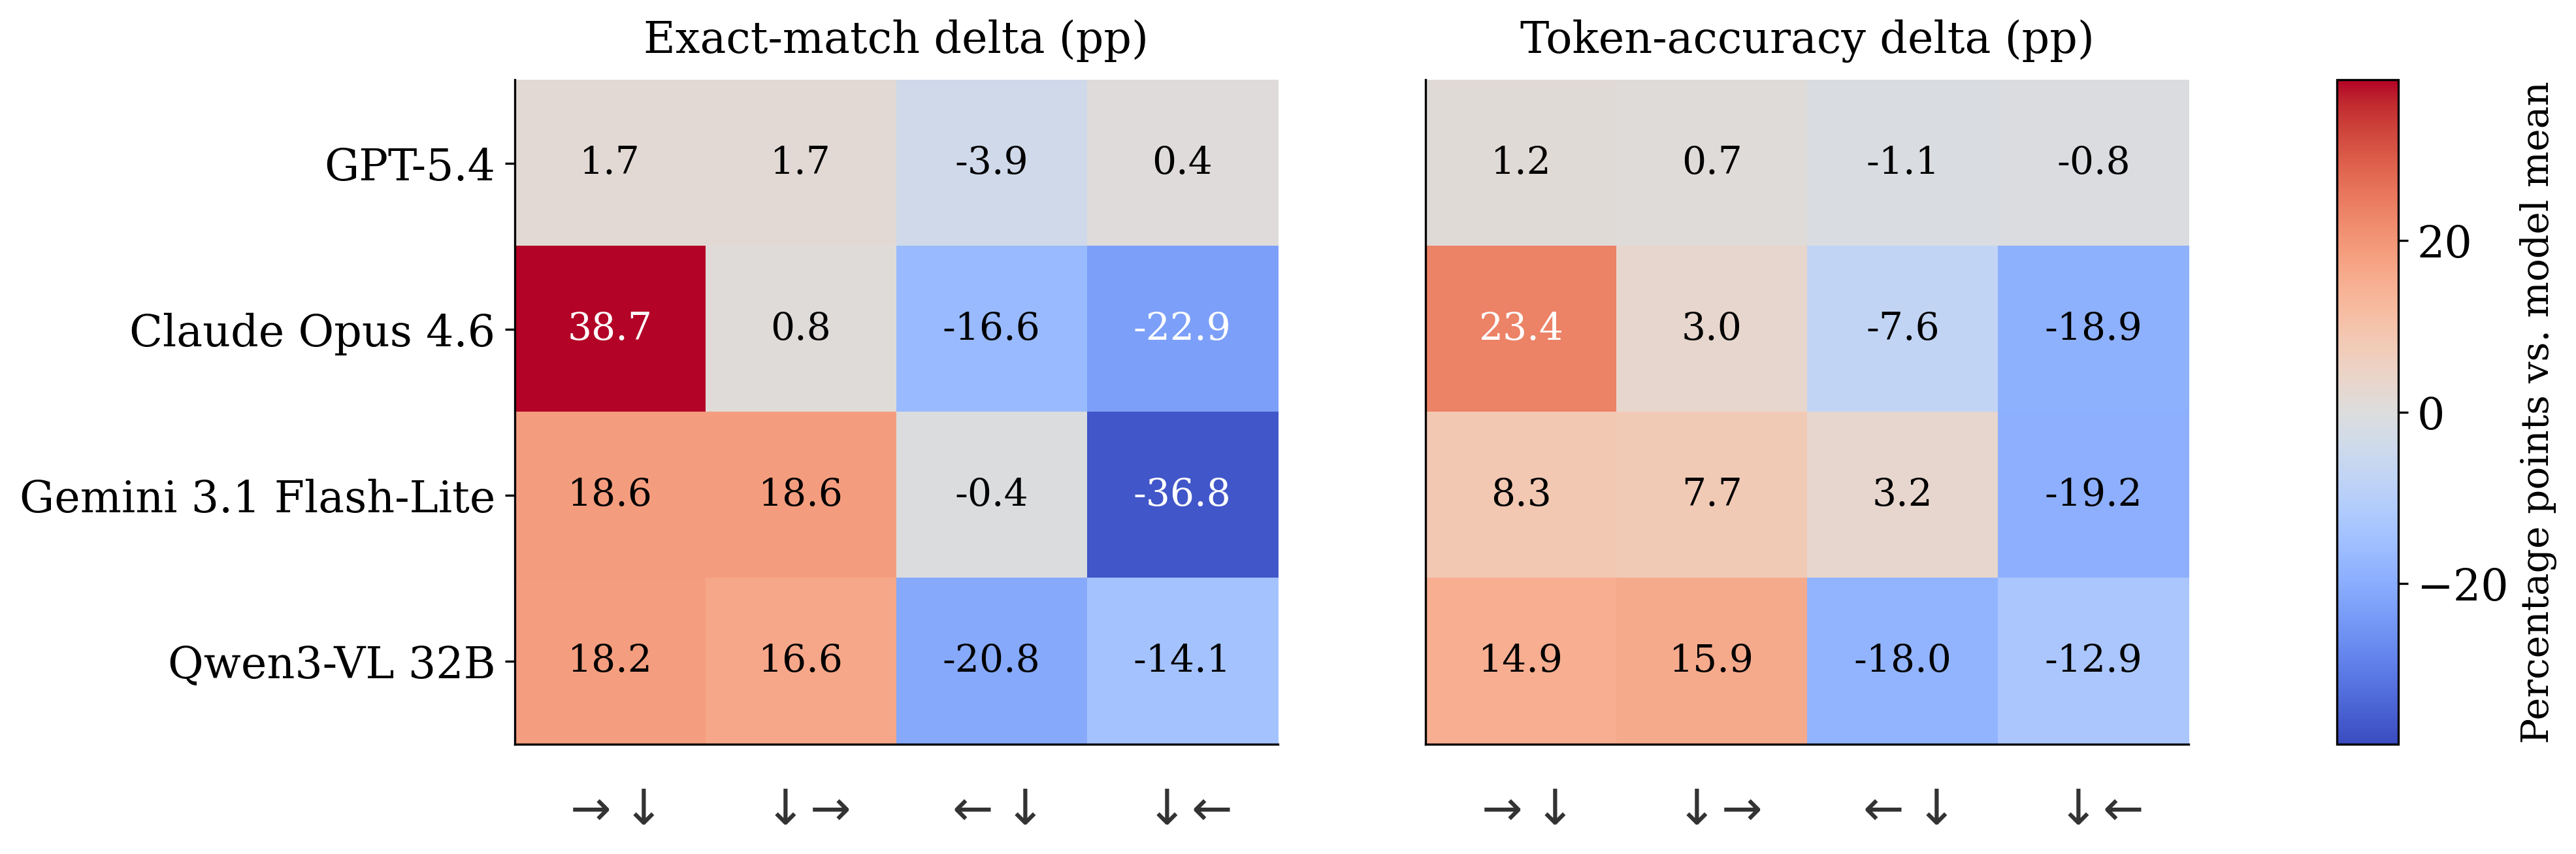
Figure 8: Models' performance differentials across reading regimes, illustrating that some layouts are systematically easier across models.
Reasoning Budget and Model Failure Analysis
An important, and potentially counterintuitive, finding is that increasing the model's reasoning budget (by enabling more “reasoning tokens”) does not universally improve exact path-following performance. For Gemini 3.1 Pro, the low reasoning setting slightly outperforms auto despite using fewer tokens. For GPT-5.4 Pro, on more challenging subsets, increased reasoning correlates with higher accuracy conditional on answering, but this comes at the cost of a much lower answer rate. The remaining gap is therefore not solely an inference-time reasoning bottleneck, but reflects deeper instability in visual tracing that additional tokens do not reliably ameliorate.
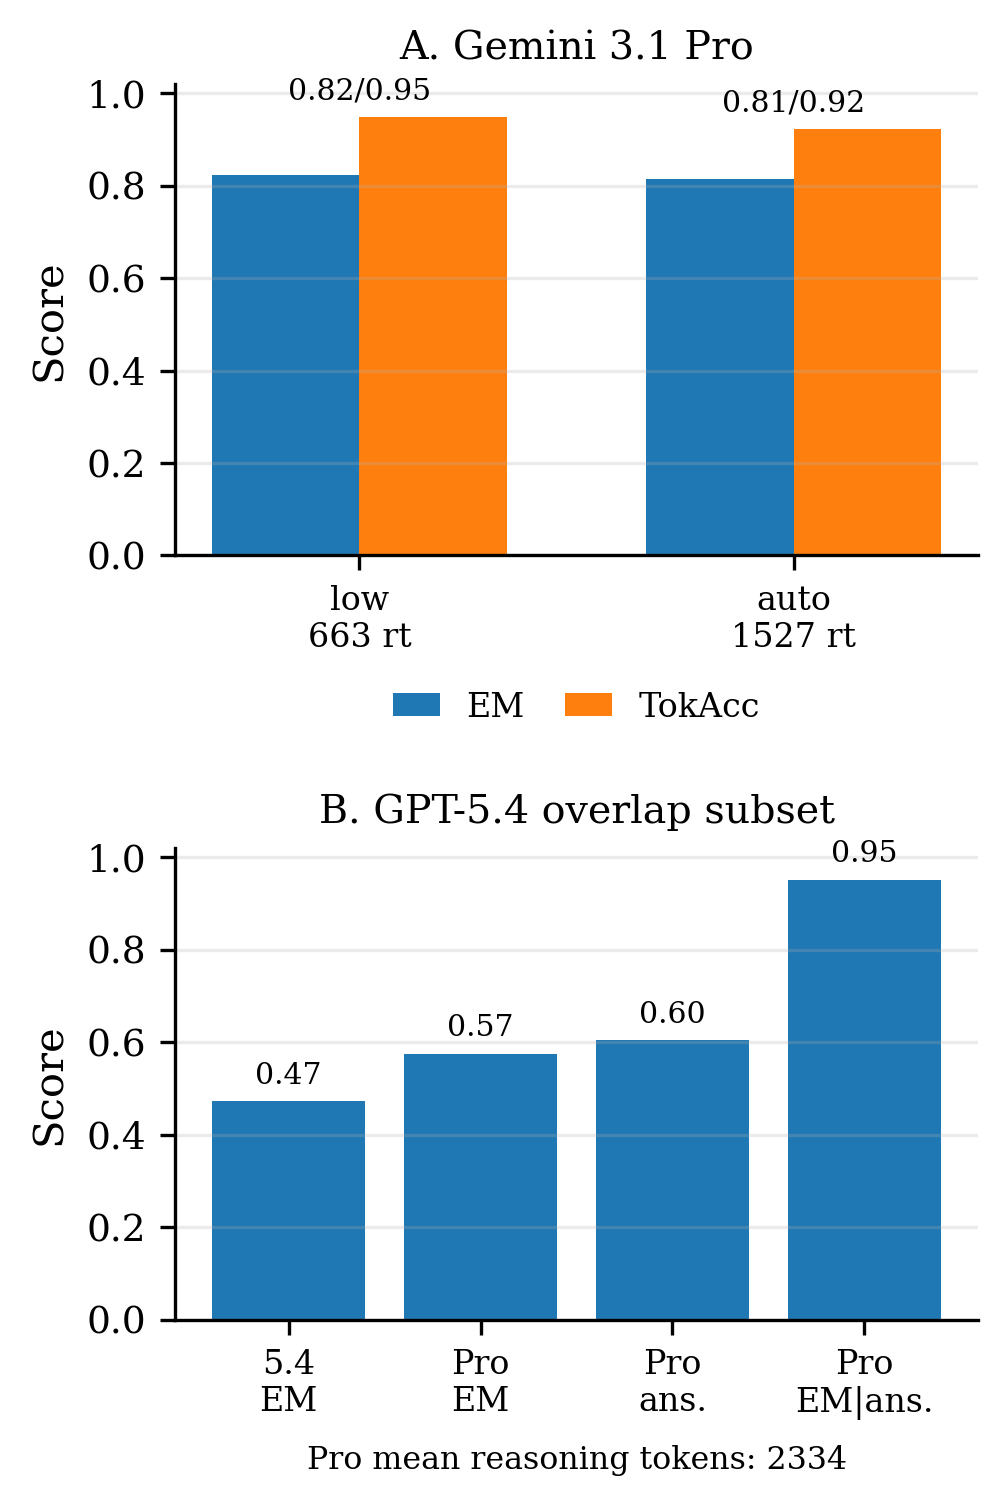
Figure 9: Top—Gemini 3.1 Pro (low) outperforms auto at lower reasoning token cost; Bottom—GPT-5.4 Pro's conditional accuracy is high when it answers, but answer rate drops sharply on hard examples.
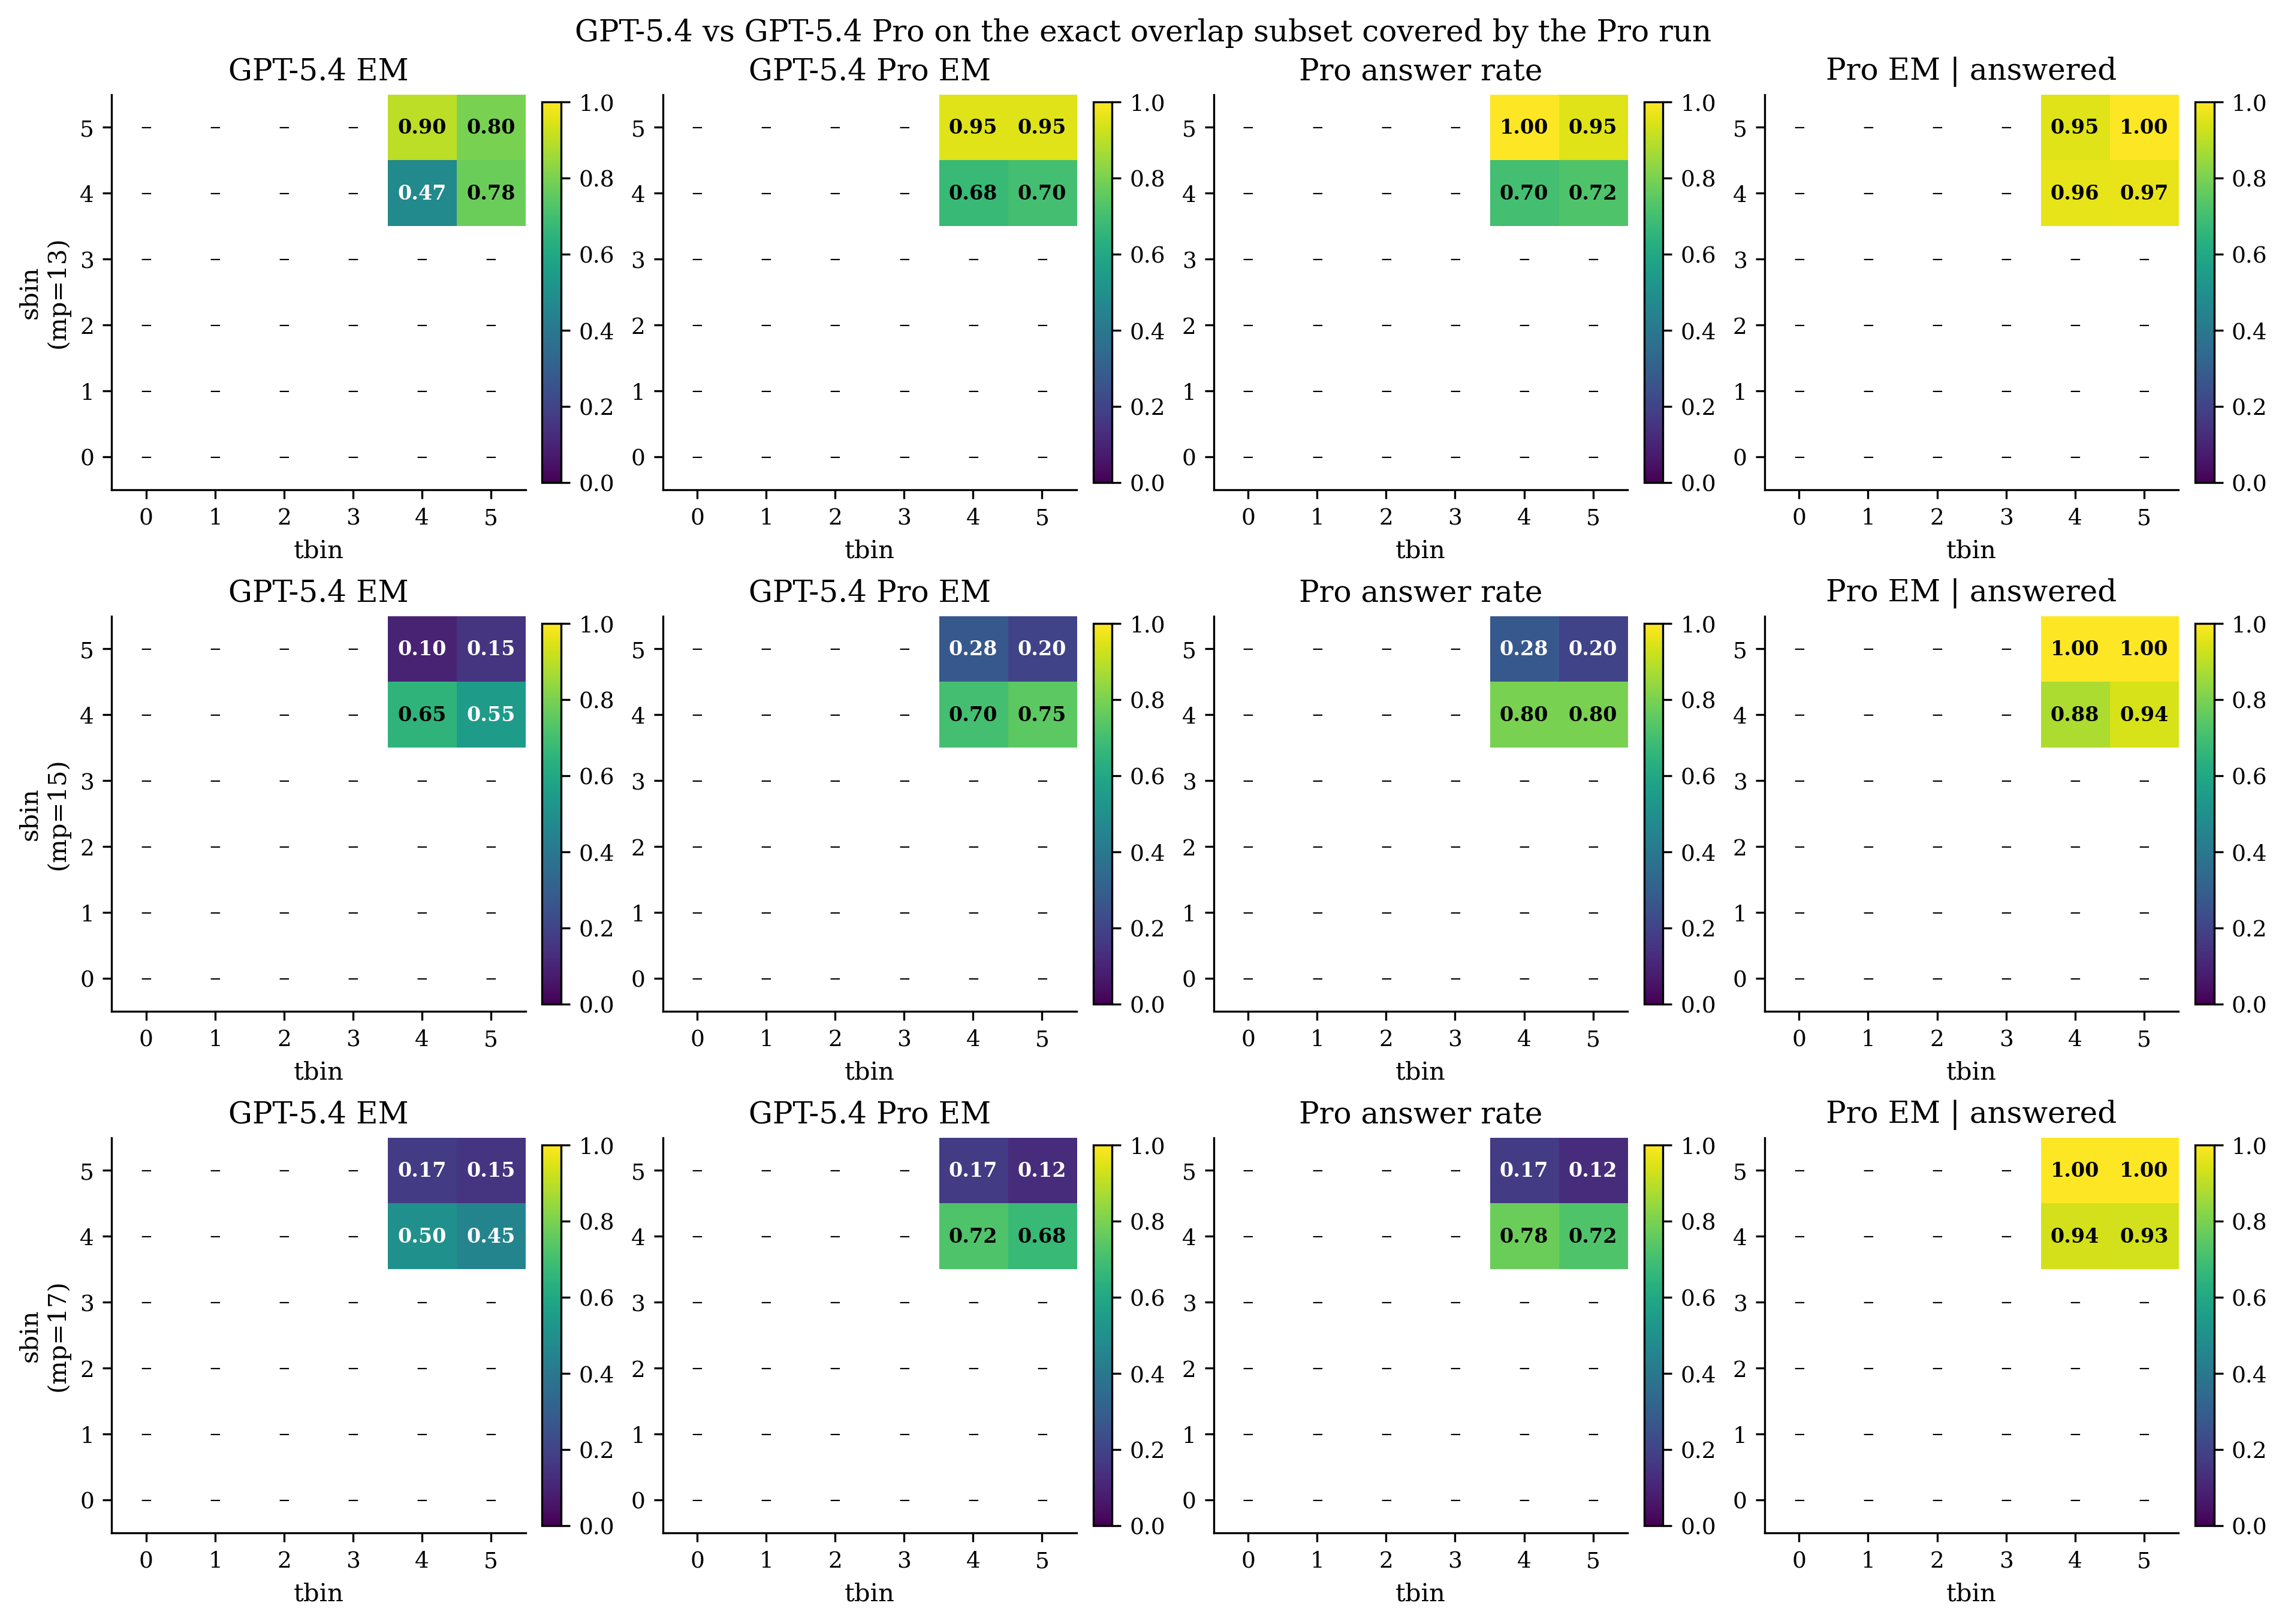
Figure 10: On the hardest examples, GPT-5.4 Pro's overall lower accuracy is driven by frequent abstention from answering, rather than inaccurate outputs when it does answer.
Interpretation and Theoretical Implications
TraversalBench confirms and sharpens open concerns about VLM tunnel vision and the brittleness of nonlocal visual reasoning. Despite high aggregate multimodal performance, leading VLMs are not robust path tracers. The central error mode is not a failure to ever follow a path, but an inability to maintain anchored and image-grounded state when ambiguity occurs—especially at structural bottlenecks such as crossings.
Further, simply increasing chain-of-thought style reasoning or inference budget does not resolve these problems unless it is coupled to a renewed, image-grounded visual attention. State-of-the-art models (e.g., Gemini Pro, GPT-5.4 Pro) remain far from saturated in the hardest complexity bins, and local ambiguities trigger disanchored, drifting outputs or outright non-response. These findings are consistent with recent attention-head analysis, which reports that only a small fraction of attention heads in deep layers mediate effective visual grounding in VLMs ([Bi et al., CVPR 2025]; [Kang et al., ICLR 2025]).
From an architectural standpoint, it remains uncertain whether fundamental model changes are required or whether scaling targeted training data and visual-grounding objectives could address the deficit. The evidence points to a mix: neither scaling nor reasoning budget alone suffices, and architectural refinements for sustained spatial attention may be necessary.
Practical Implications and Prospects
Practically, the inability to robustly follow paths impinges on all multimodal applications that require faithful stepwise navigation of visual structure, such as map and diagram understanding, physical navigation, and any setting where error in a local spatial operation can cascade to downstream reasoning failures.
TraversalBench provides a tool for precision error analysis, separating out distinct classes of failure and offering actionable diagnostic signals for model improvement. Future directions include extending the dataset to further local geometric controls (e.g., curvature), integrating closed-form theoretical analyses leveraging graph readability, and scaling both the number and difficulty of benchmark instances.
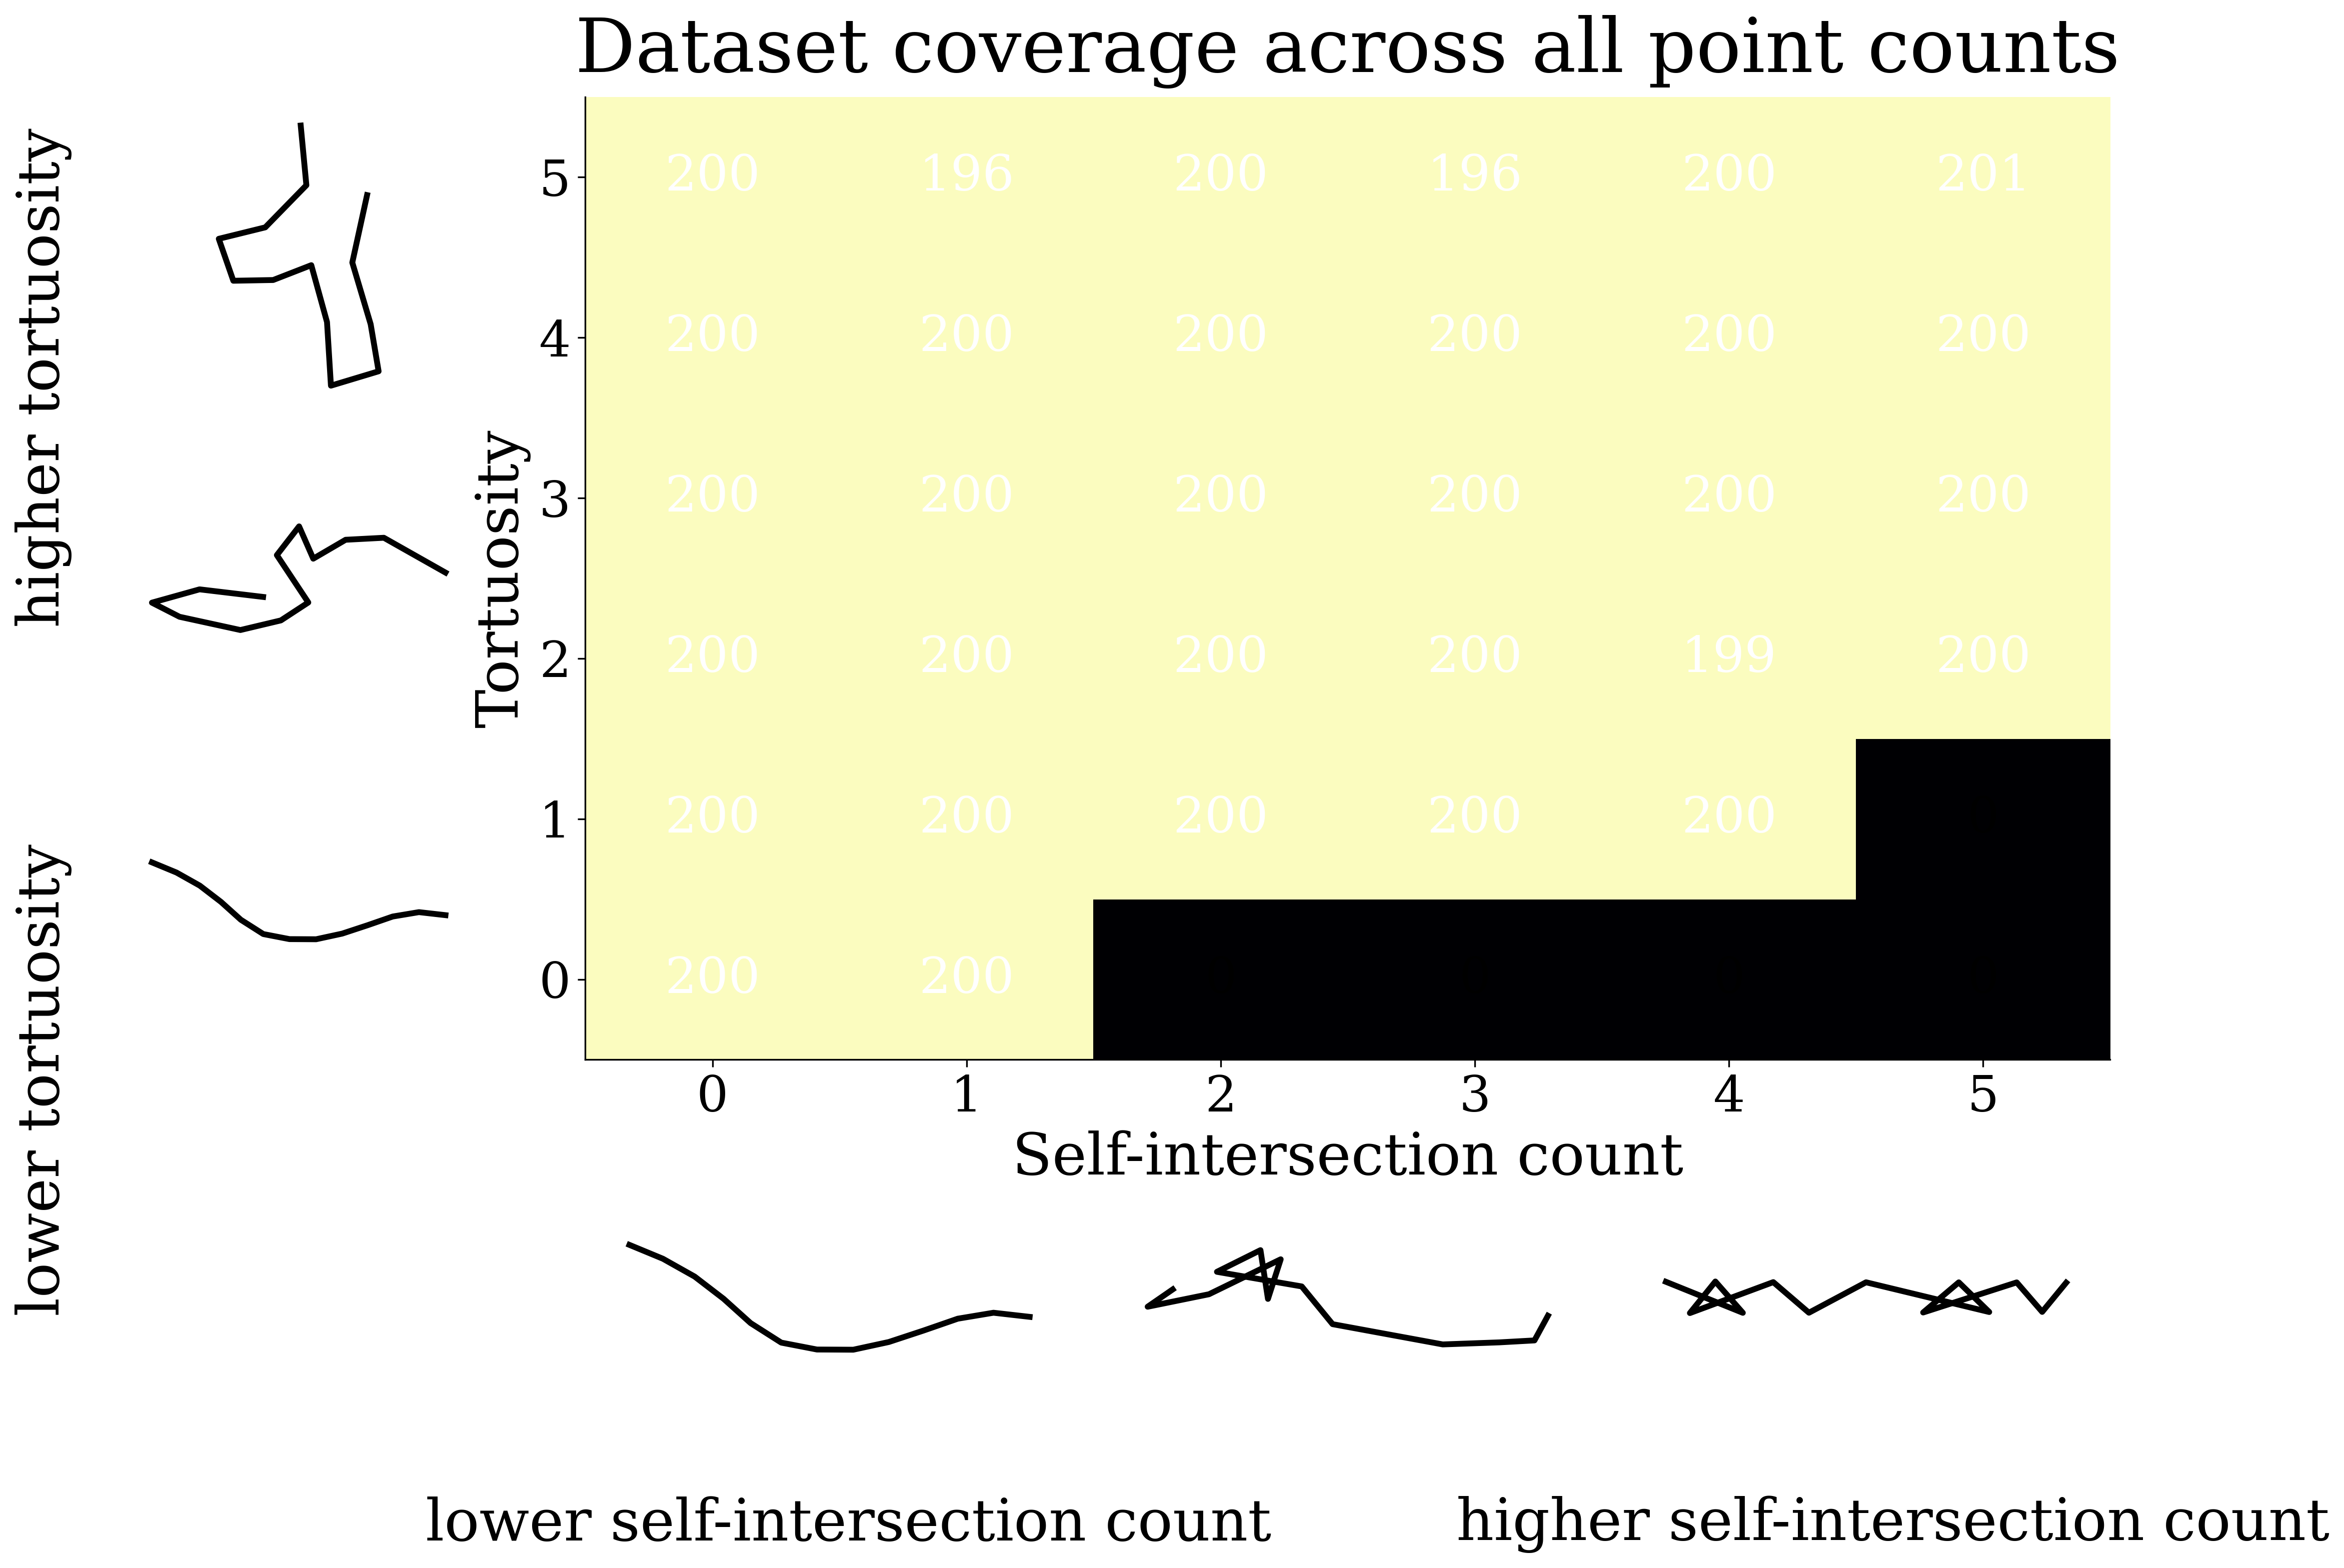
Figure 11: Heatmap showing coverage of the benchmark over the joint tortuosity and self-intersection grid; yellow cells covered, black uncovered.
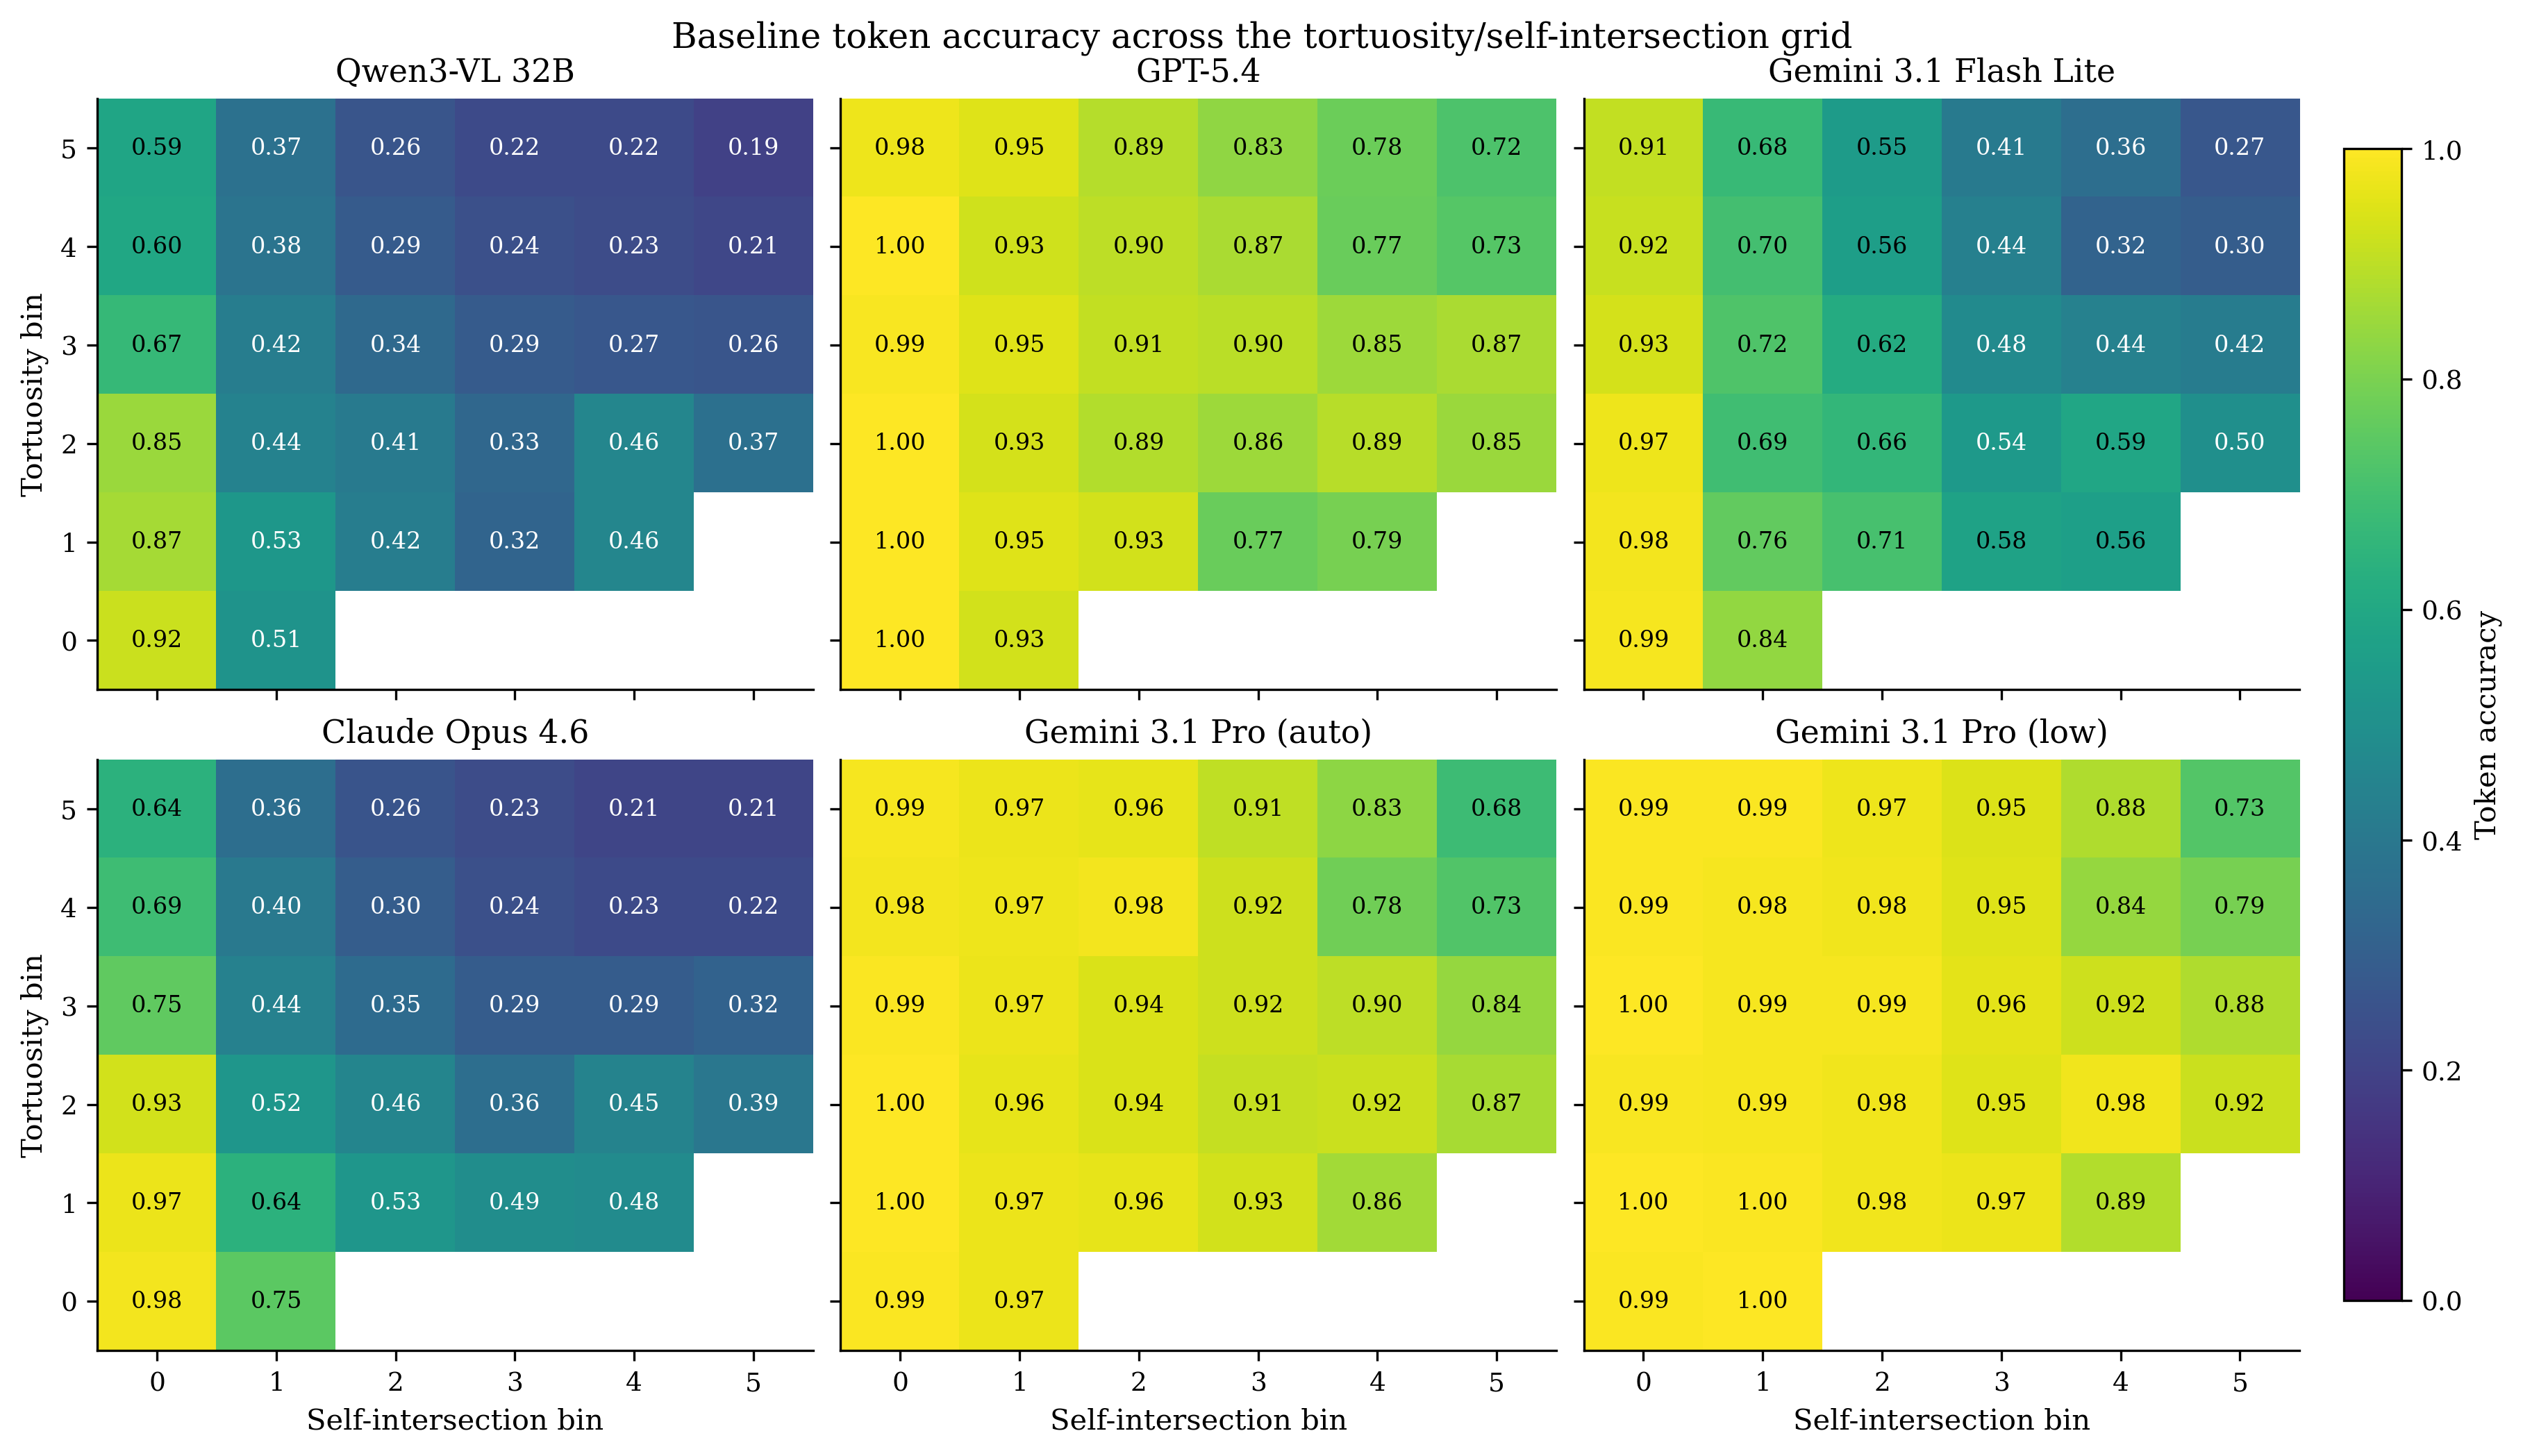
Figure 12: Token accuracy heatmaps for all models, highlighting degradation with increasing global path complexity.
Conclusion
TraversalBench offers a controlled, diagnostic framework for evaluating VLMs on exact, sequence-faithful visual path traversal under systematically varied complexity and ambiguity. The central bottleneck for current models is unstable visual grounding at critical local ambiguities, particularly at self-intersections, while cumulative distractor structure further compounds error. Addressing these deficits likely requires innovations in both dataset construction and training protocols that promote persistent, image-grounded state tracking, as well as potential architectural modifications for robust spatial attention.