- The paper introduces ridge-regularized Bradley–Terry models to evaluate NFL pass blocking and pass rushing performance by adjusting for opponent quality.
- It utilizes comprehensive tracking data and binary outcome definitions to derive interpretable rankings for both offensive and defensive linemen.
- Results demonstrate improved predictive performance and alignment with expert evaluations, emphasizing the benefit of modeling outcome severity over raw metrics.
Motivation and Context
NFL pass protection and pass rushing have substantial impact on team success, but robust, interpretable metrics for evaluating individual linemen have proven elusive due to severe context-dependency and information sparsity. Traditional metrics (e.g., sacks, hits, pressures) inadequately disentangle individual contribution from outcome stochasticity and environmental factors. Modern player-tracking data enable fine-grained analysis of line engagements, but existing metrics like PBWR and STRAIN remain limited in their capacity for opponent and context adjustment.
This study introduces a paired-comparison modeling paradigm to address these gaps, leveraging a regularized Bradley–Terry (BT) framework to derive joint, opponent-adjusted ratings for blockers and rushers from 2021 NFL tracking data, capturing both overall win rates and outcome severity.
Dataset and Outcome Construction
The analysis is based on 153,138 blocker–rusher interactions from 33,283 pass plays during the 2021 regular season, as recorded by Hudl’s player tracking at 10Hz. Interactions are defined by labeled engagements, incorporating double-team status as a key covariate. Outcomes are labeled from the rusher's perspective under two schemes:
- Binary Win/Loss: A win is assigned if the rusher is closer to the quarterback than the blocker within 2.5 seconds of the snap.
- Multinomial Severity: Four classes in increasing “defensive” severity—loss, win (pressure, no contact), hit, sack—with each engagement assigned the most severe label realized in the interaction.
Empirical marginal frequencies are heavily skewed: loss (0.73), win (0.25), hit (0.011), sack (0.0063). The four severity classes are mapped to unit interval weights anchored to EPA values—w(loss)=0, w(win)=0.10, w(hit)=0.20, w(sack)=1.00—for computing expected severity.
Modeling Framework
Two BT models are estimated:
- Binary Ridge-regularized BT: Models the log-odds of win probability as a function of rusher and blocker latent effects with an explicit double-team term, logit P(win)=α+r−b+δD.
- Multinomial Ridge-regularized BT: Extends the model to four outcome classes, fitting class logits for each engagement. Regularization is critical to control variance from uneven exposure and incomplete matchup graphs.
Training/test splits are deterministic and ordered, and all models are benchmarked against strong baselines:
- Global Baselines: Role-agnostic empirical frequencies.
- Matchup Baselines: Player-specific, smoothed historical encounter frequencies with empirical Bayes shrinkage; no explicit latent skill estimation.
Holdout log-loss quantifies predictive accuracy:
- The binary win/loss BT model reduces log-loss by 0.24% over the matchup baseline and 1.21% over the global baseline.
- The multinomial severity BT model shows similar improvements, with gains of 0.24% (vs. matchup) and 1.20% (vs. global).
- Bootstrap analysis confirms the statistical stability of improvements for the win/loss model and relative to the global baseline for severity; severity vs. matchup is directionally positive but less robust.
Player Ratings: Distribution and Leaderboards
The BT framework yields interpretable player scores. Score distributions reflect internal separation for blockers and rushers across both tasks.
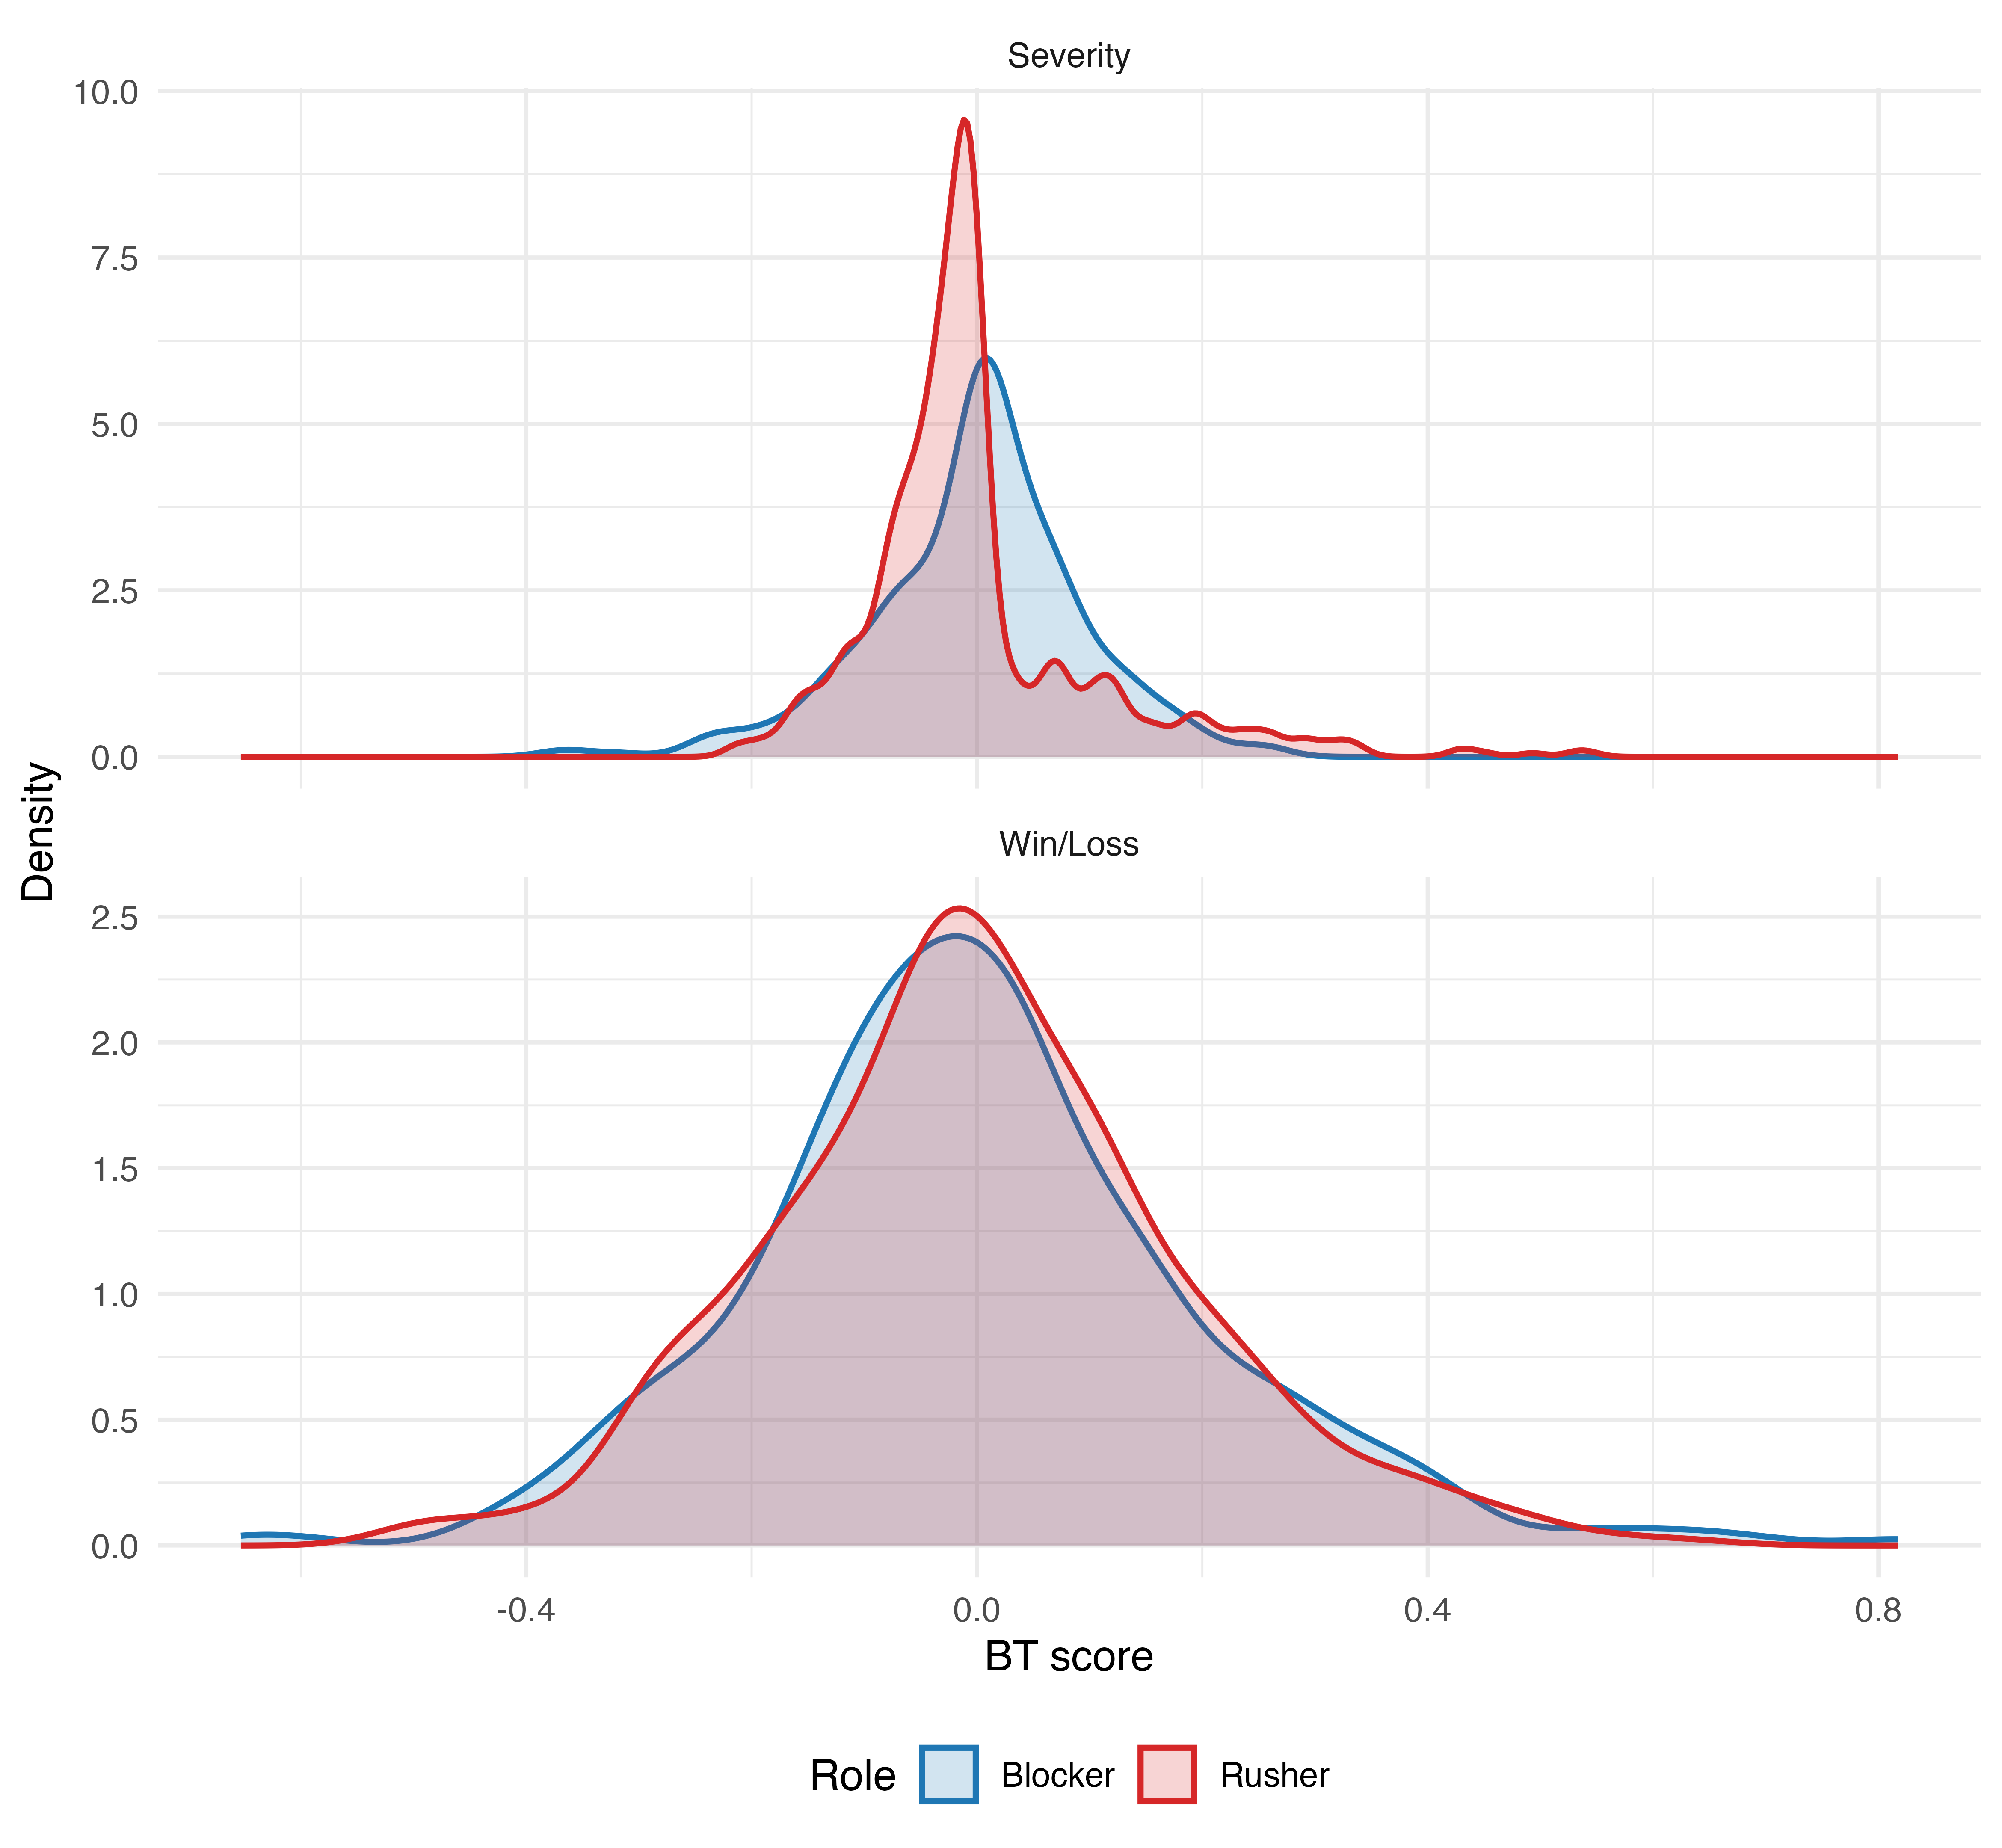
Figure 1: Distribution of BT scores by model and role, indicating the separation of player ability as estimated by the models for each role.
Top-10 leaderboards (minimum 200 interactions) highlight elite performers by BT score.
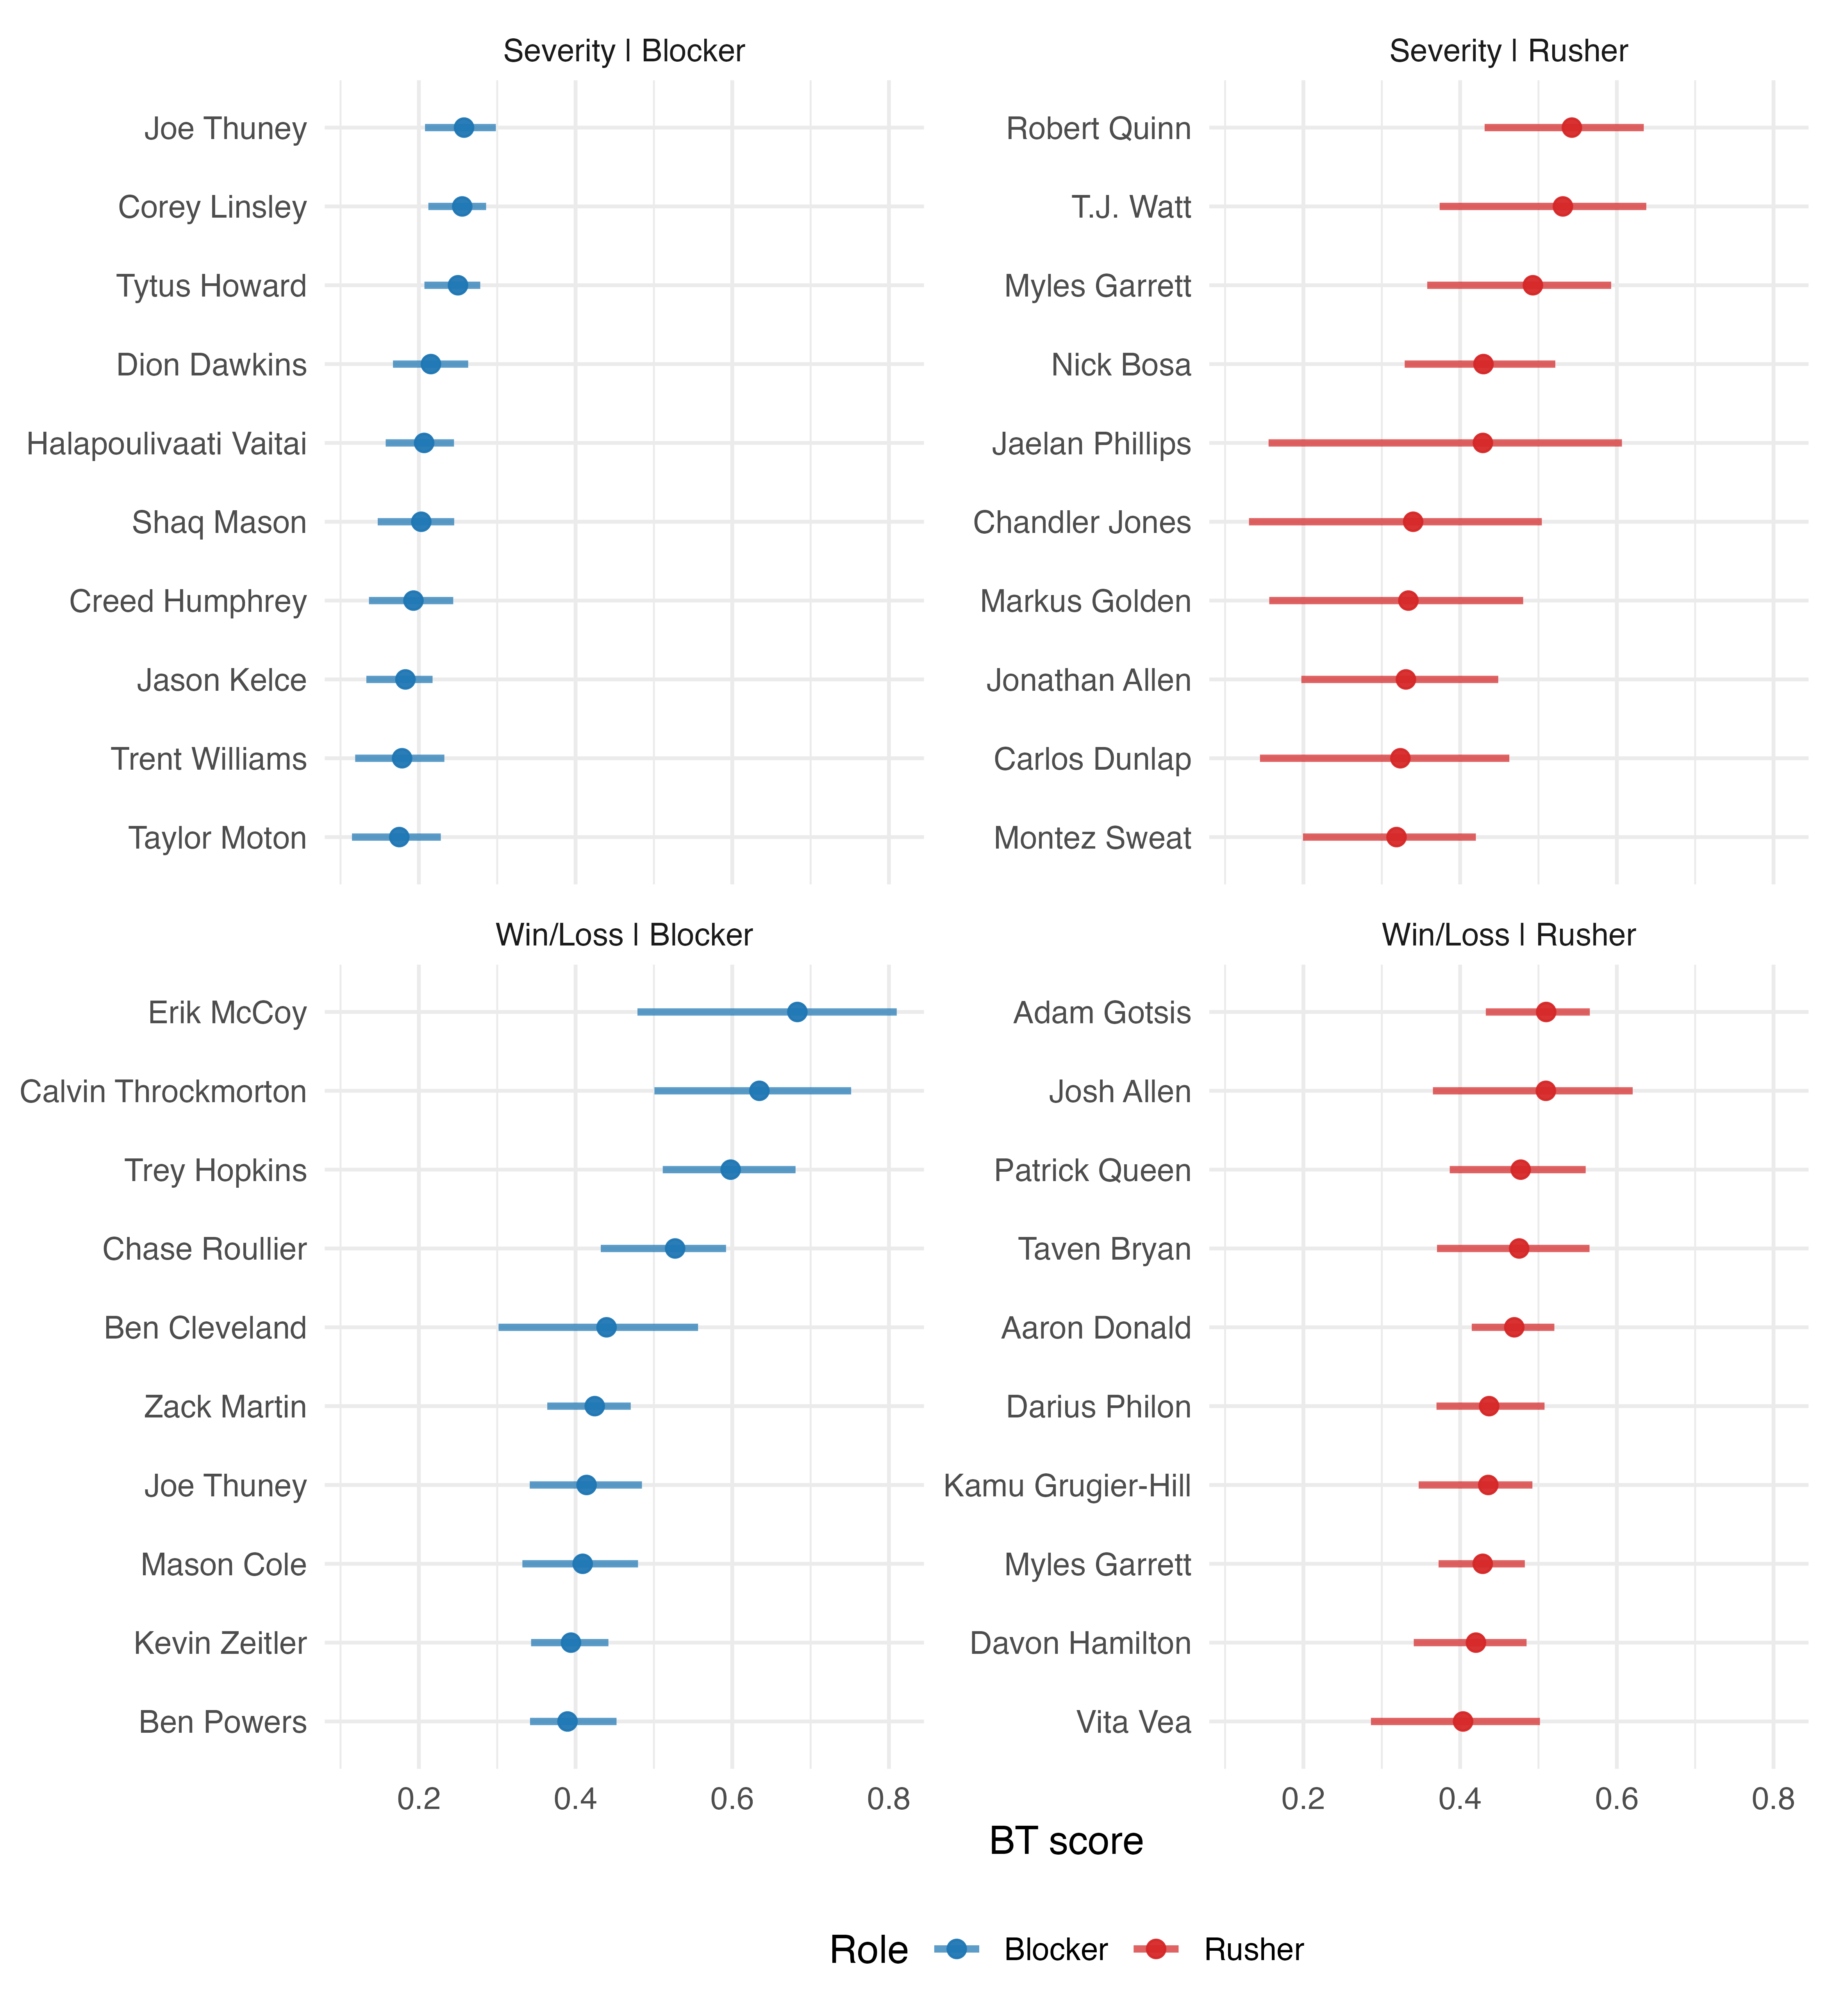
Figure 2: Top 10 players by BT score in each model-role panel with bootstrap-derived 50% uncertainty intervals, supporting the empirical separation in role-specific talent.
Scores track interaction-level efficiency, conditional on assigned matchups, and are not designed as all-snap value measures. Consistency between win/loss and severity leaderboards is observed among elite rushers; for blockers, severity emphasizes high-impact prevention.
Alignment with External Awards
Externally, the severity-based BT rankings show strong concordance with 2021 AP All-Pro selections. Discriminative power is quantified via AUC and enrichment@K metrics, both outperforming empirical-rate-based benchmarks:
- Severity model leads AUC and enrichment@K in most role/accolade slices.
- Severity-based rankings show the clearest alignment with expert recognition, particularly among blockers.
Longitudinal Analysis: Week-by-Week Score Dynamics
Weekly path bootstraps provide uncertainty quantification and temporal evolution of top performers’ scores.
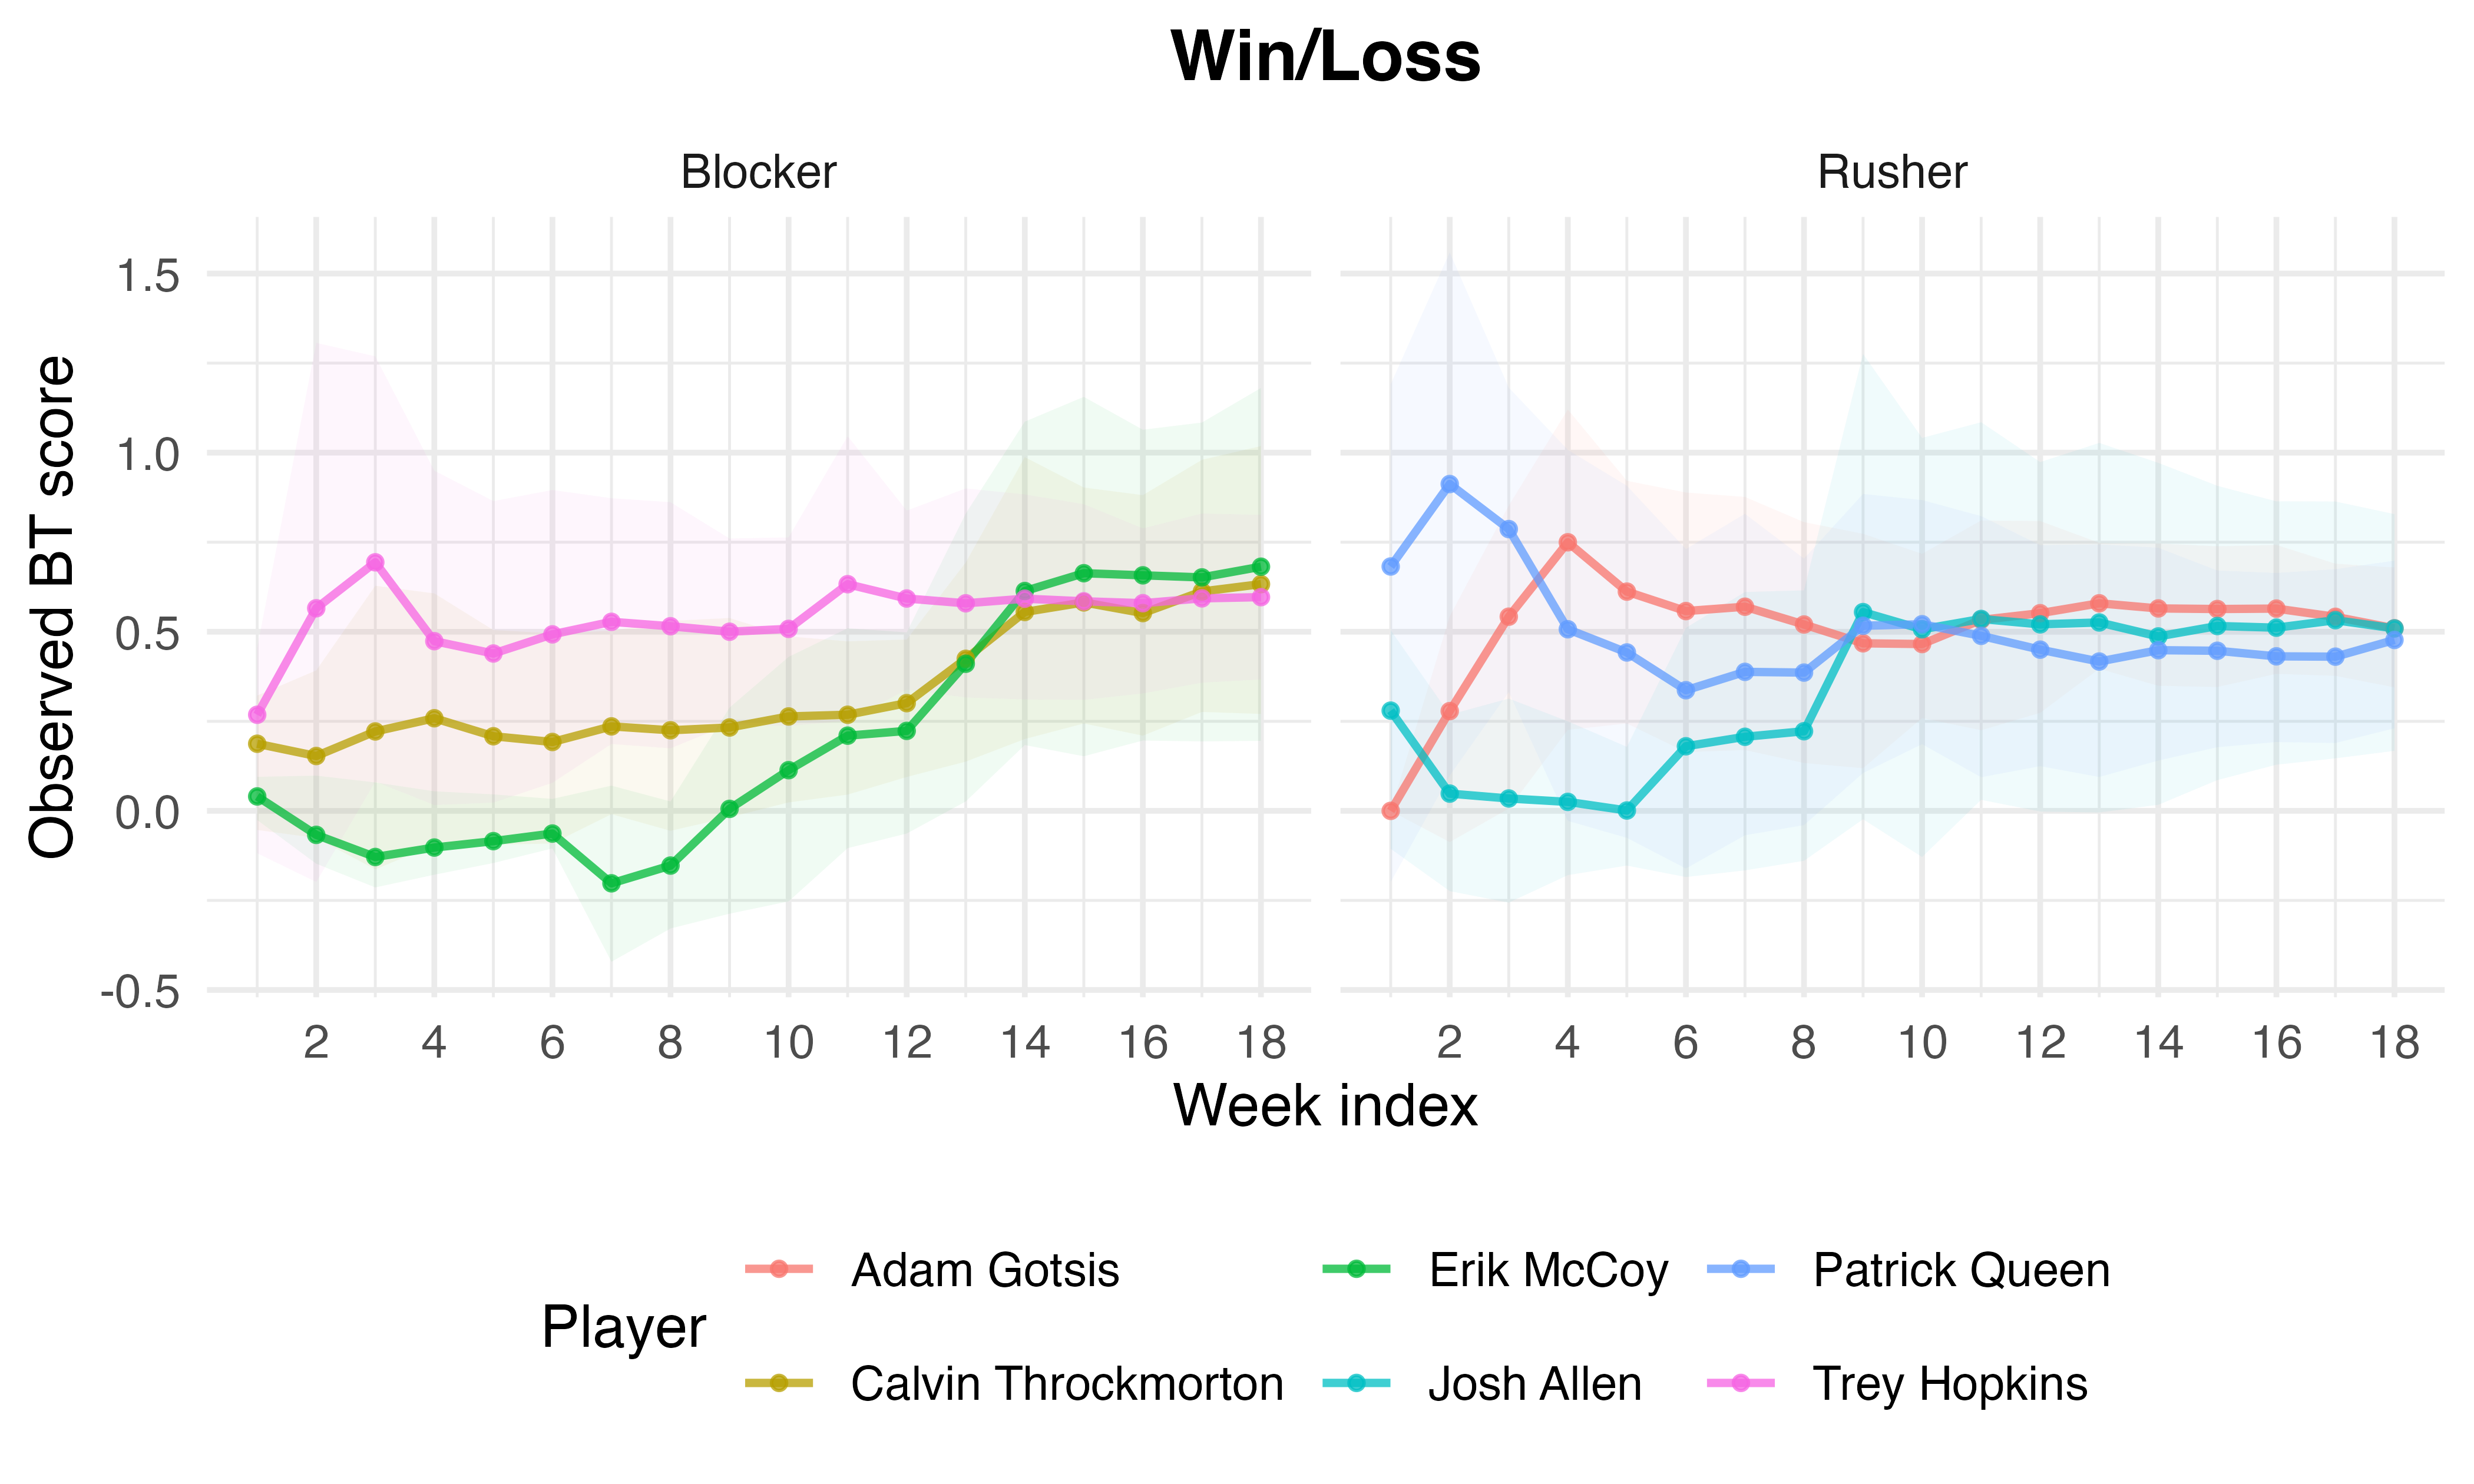
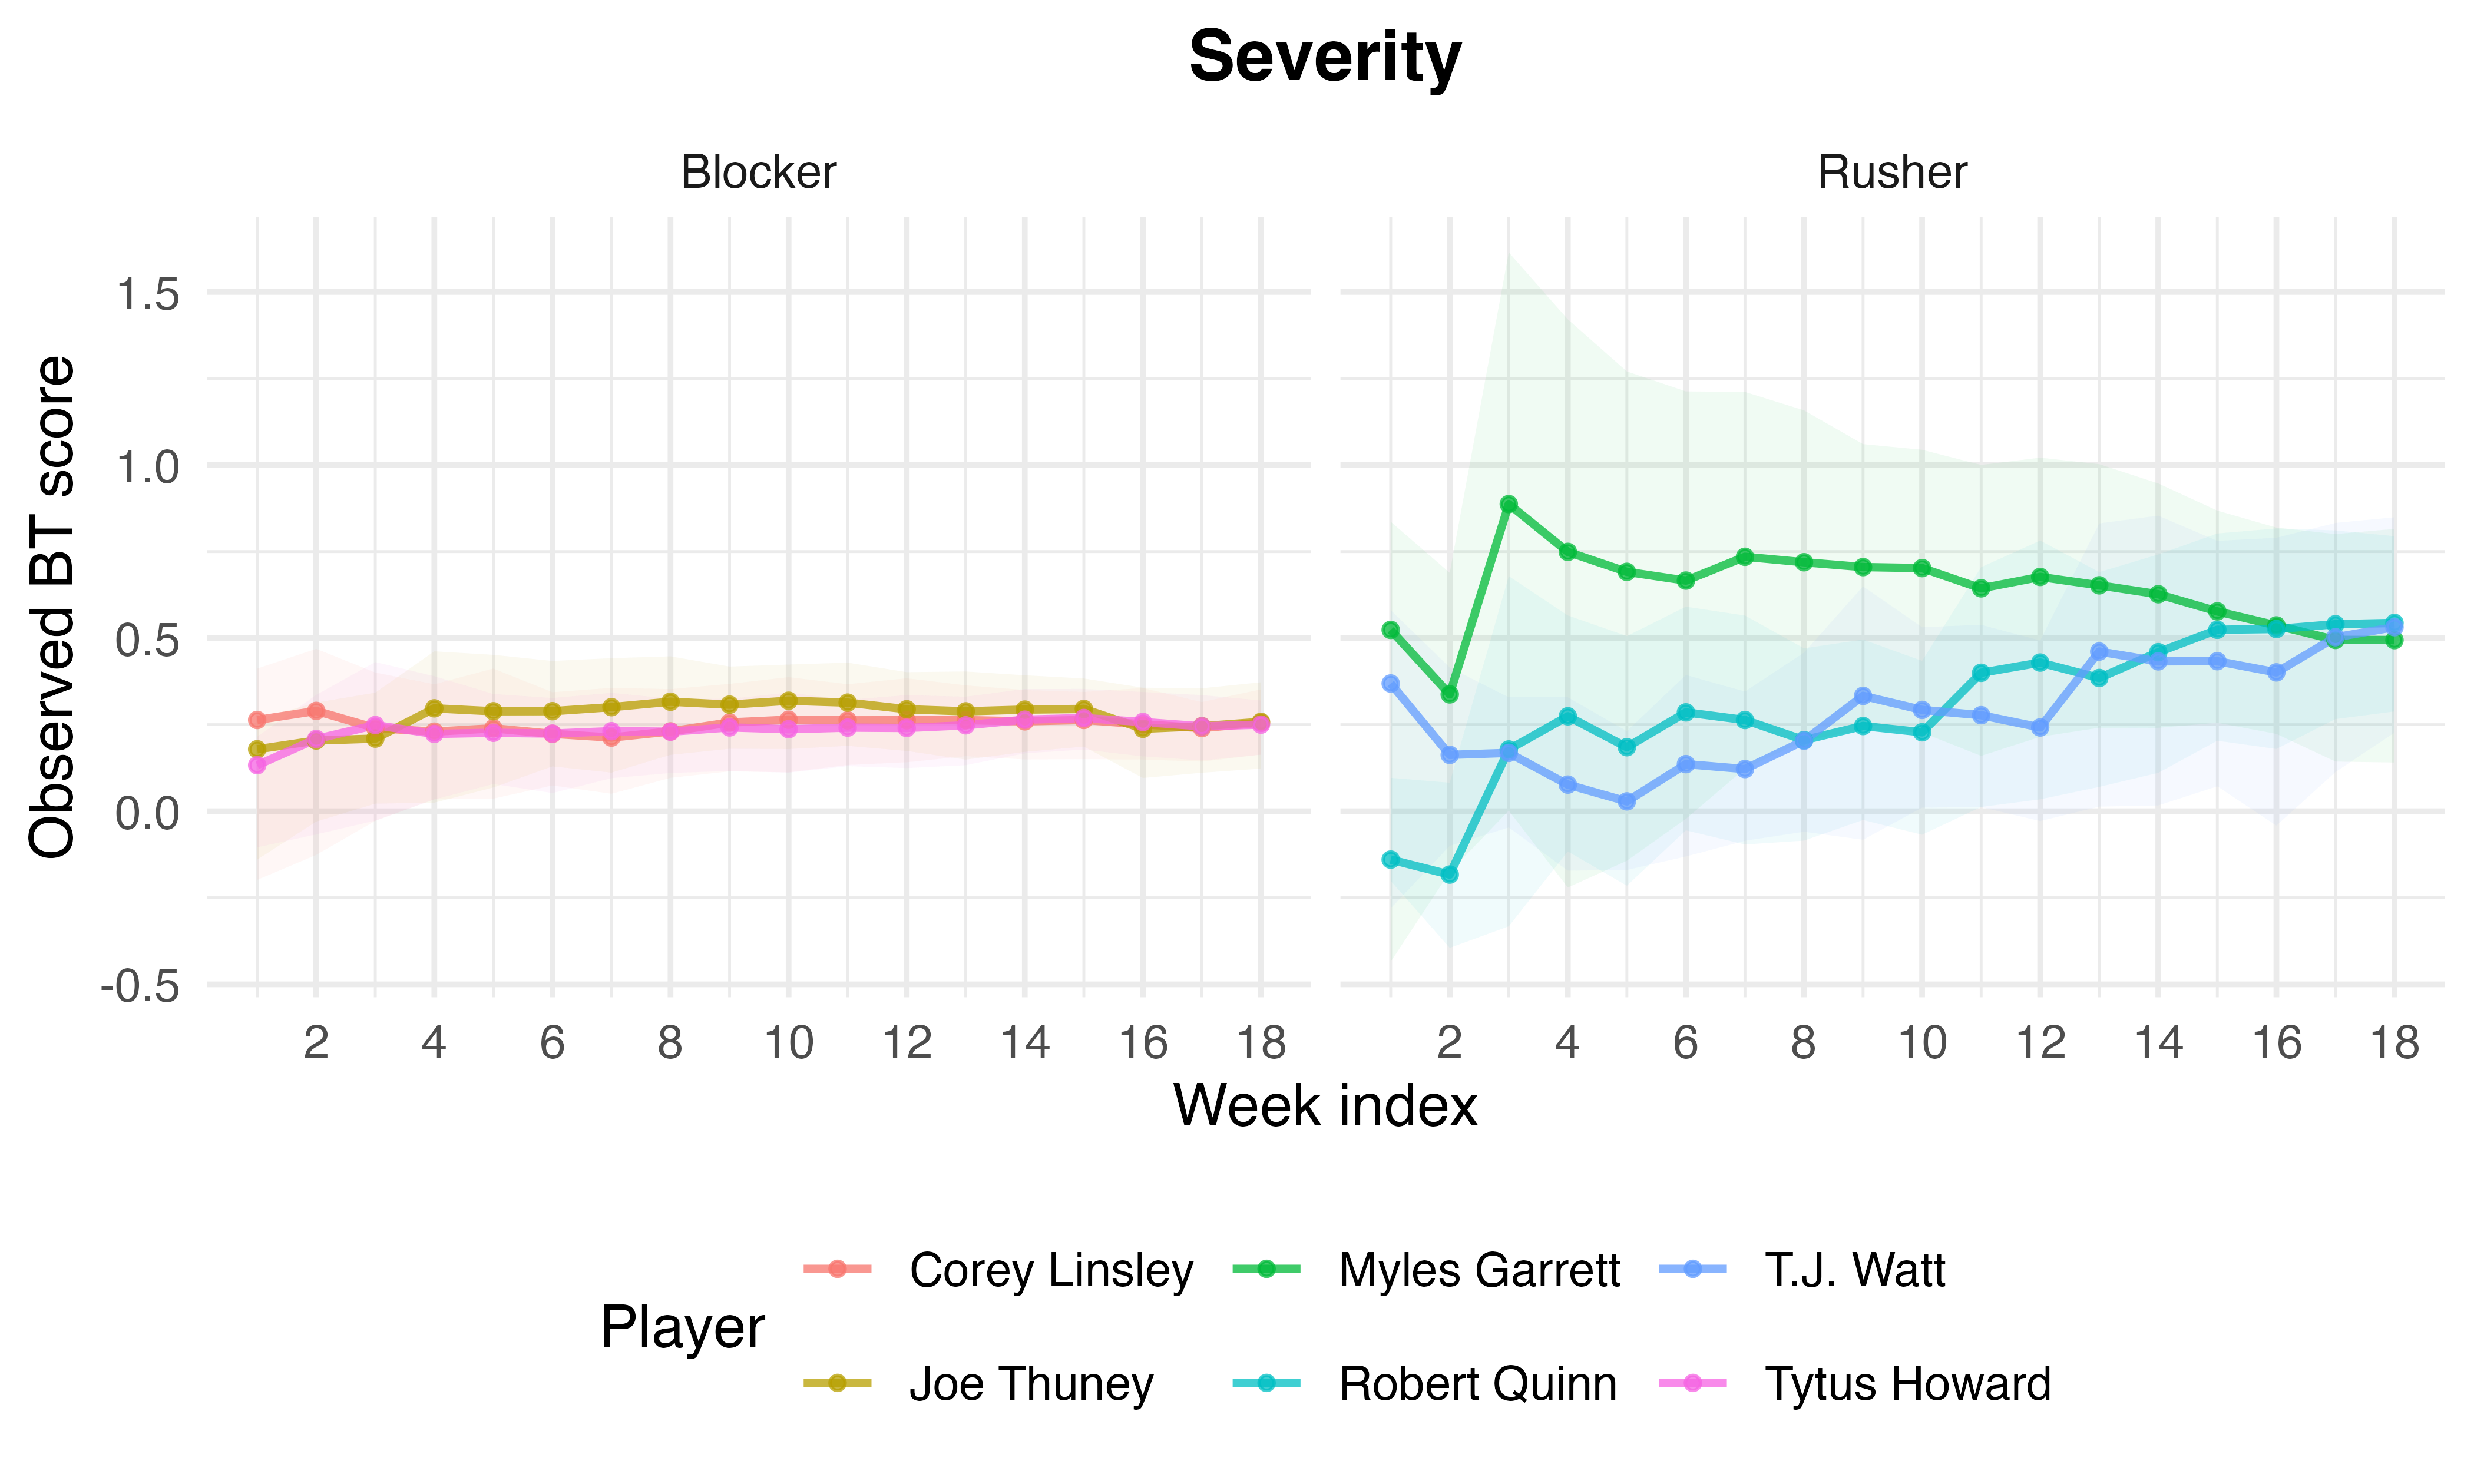
Figure 3: Weekly cumulative BT score paths with bootstrap uncertainty ribbons for the top three players in each model-role panel, illustrating convergence and variance over the season.
Cumulative exposure monotonically refines estimates, and initial weeks exhibit pronounced uncertainty.
Theoretical Implications
- Opponent-adjusted paired-comparison methods, via regularized BT models, produce interpretable, role-conditional player value estimates from large-scale tracking data.
- Multinomial severity modeling, anchored in outcome value (EPA), delivers improvements in aligning model-based assessment with expert human judgment.
- The explicit inclusion of context features (e.g., double-team indicators) and posterior uncertainty quantification augments model transparency and robustness.
Limitations and Prospects for Extension
Key limitations include the potential crudeness of the distance-based win proxy, incomplete context capture (e.g., only coarse double-team encoding, little quarterback/play-level conditioning), and lack of explicit modeling for teammate effects or assignment structure. Future work could extend the BT framework with hierarchical shrinkage, richer outcome definitions utilizing advanced pocket geometry and QB decision tracking, and multi-season or multi-level pooling to enhance rating stability and interpretability.
Conclusion
Ridge-regularized BT models, fit to high-resolution tracking data, yield opponent-adjusted, interpretable ratings for NFL offensive and defensive linemen, outperforming competitive baselines in both binary and severity-based tasks. Severity modeling exhibits especially strong external validity, aligning more closely with independent All-Pro selections. These findings suggest that integrating outcome granularity and opponent structure into line play metrics meaningfully advances both the theoretical and practical measurement of pass blocking and pass rushing performance.