Crashing Waves vs. Rising Tides: Preliminary Findings on AI Automation from Thousands of Worker Evaluations of Labor Market Tasks
Abstract: We propose that AI automation is a continuum between: (i) crashing waves where AI capabilities surge abruptly over small sets of tasks, and (ii) rising tides where the increase in AI capabilities is more continuous and broad-based. We test for these effects in preliminary evidence from an ongoing evaluation of AI capabilities across over 3,000 broad-based tasks derived from the U.S. Department of Labor O*NET categorization that are text-based and thus LLM-addressable. Based on more than 17,000 evaluations by workers from these jobs, we find little evidence of crashing waves (in contrast to recent work by METR), but substantial evidence that rising tides are the primary form of AI automation. AI performance is high and improving rapidly across a wide range of tasks. We estimate that, in 2024-Q2, AI models successfully complete tasks that take humans approximately 3-4 hours with about a 50% success rate, increasing to about 65% by 2025-Q3. If recent trends in AI capability growth persist, this pace of AI improvement implies that LLMs will be able to complete most text-related tasks with success rates of, on average, 80%-95% by 2029 at a minimally sufficient quality level. Achieving near-perfect success rates at this quality level or comparable success rates at superior quality would require several additional years. These AI capability improvements would impact the economy and labor market as organizations adopt AI, which could have a substantially longer timeline.

Paper Prompts
Sign up for free to create and run prompts on this paper using GPT-5.
Top Community Prompts
Explain it Like I'm 14
Overview
This paper asks: When AI gets better, does it suddenly master a few new tasks all at once like a crashing wave, or does it improve steadily across many tasks like a rising tide? Using thousands of real-world, text-based job tasks, the authors find the “rising tide” story fits best: AI is already good at many tasks and is getting better across the board, fairly quickly but mostly without sudden jumps.
The big questions
The study focuses on three simple questions:
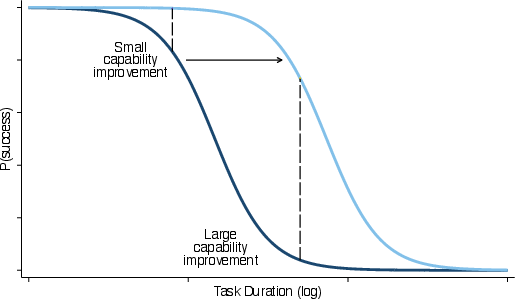
- Do AI systems improve in sudden bursts on certain tasks (“crashing waves”) or more smoothly and broadly across many tasks (“rising tides”)?
- How does AI success change as tasks get longer or more complex (for humans)?
- How fast are AI systems improving over time, and what might that mean for workers and the economy?
How they did the study
Think of a “task” as a piece of work a person might do on the job: write an email, summarize a report, draft a lesson plan, outline a legal memo, and so on. Here’s the approach in everyday terms:
- Picking tasks: The team started from the U.S. Department of Labor’s O*NET list of tasks people do at work. They kept only tasks where a language-based AI could realistically help (for example, writing or analysis, not lifting boxes). They also focused on tasks where AI could save at least about 10% of a person’s time.
- Creating examples: For each chosen task, they wrote up realistic examples (called “instances”)—like specific prompts or scenarios an AI could try to complete.
- Running many AIs: More than 40 AI models attempted these task instances. This covered models of different sizes and release dates.
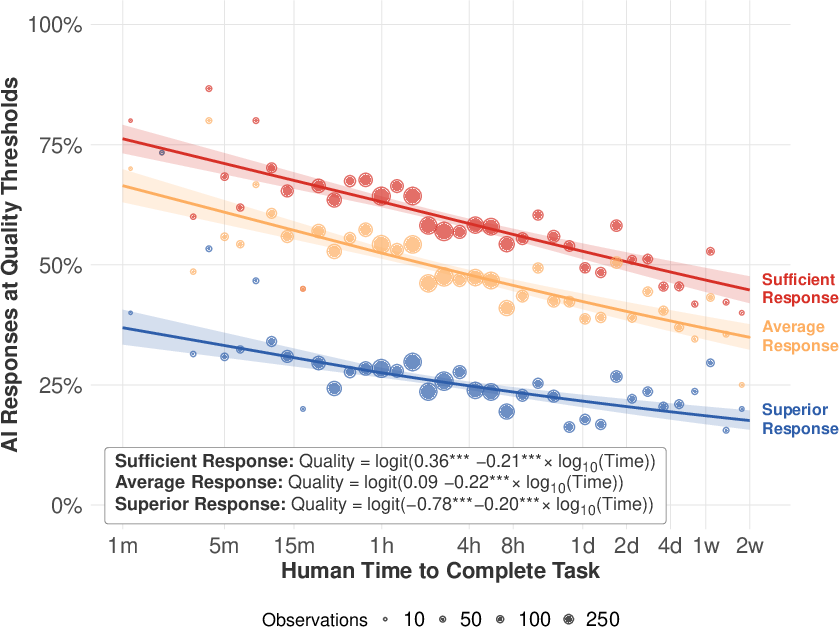
- Human scoring: People with experience in those jobs graded the AI’s answers on a 1–9 scale:
- 7 means “minimally sufficient as-is” (a manager would accept it without edits).
- 8 means “average human quality as-is.”
- 9 means “superior quality as-is.”
- Main measure: The key outcome was whether the AI’s answer needed no edits to be minimally acceptable (score ≥ 7). That’s treated as “AI can handle it.”
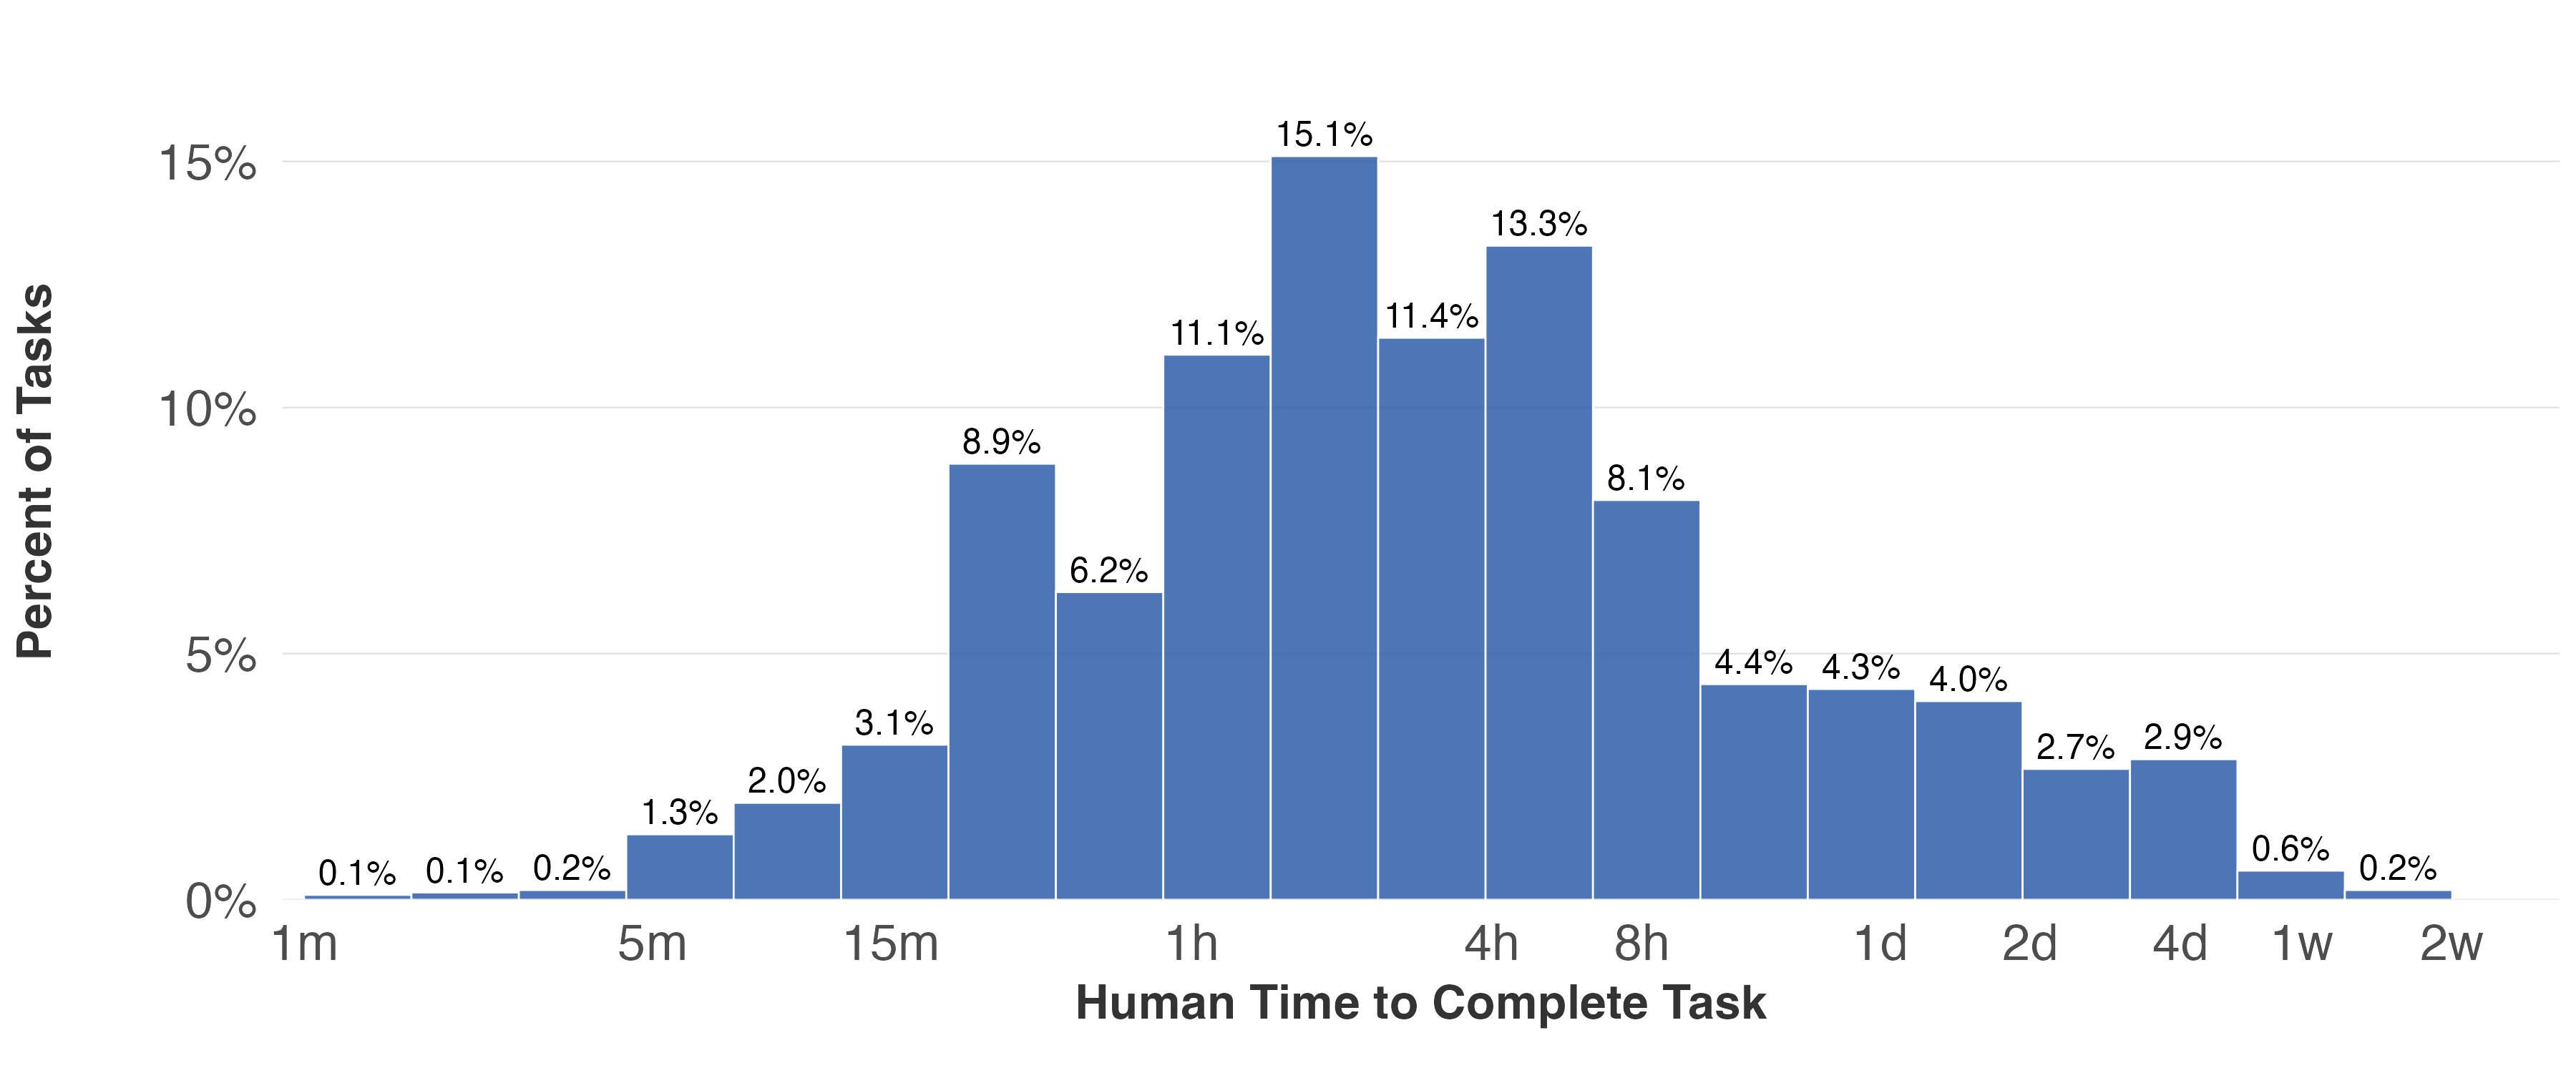
- Task length: For each task instance, evaluators reported how long it would take a human to complete (from about 10 minutes to several days). The study then looked at how AI success changes as human task time gets longer.
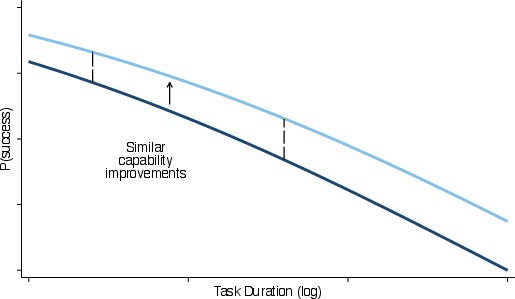
- Simple pattern check: They fit a smooth curve that shows how the chance of AI success changes with task length. A steep drop would look like a “crashing wave” (AI suddenly fails on tasks just a bit longer). A gentle, flatter drop would look like a “rising tide” (AI performance is more similar across short and long tasks).
Why “task length” matters: Longer tasks usually involve more steps in a row. If AI needs to get each step right, longer tasks give it more chances to slip up—so you’d expect success to fall as tasks get longer. The question is how sharply it falls.
What they found
Here are the main findings, explained simply:
- Rising tide, not crashing waves: AI does a bit worse on longer tasks, but the drop is surprisingly small on average. In other words, AI performance is fairly similar for short and long text-based tasks. That’s a “rising tide” pattern, not big sudden jumps.
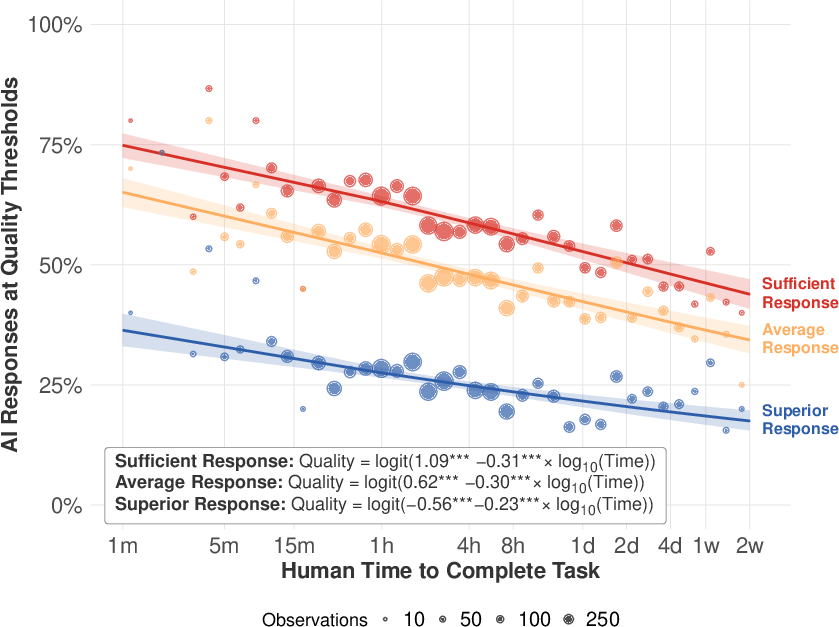
- AI is already pretty capable: Across many tasks, AIs can produce minimally acceptable work (no edits needed) around half to three-quarters of the time, depending on the job area and model.
- Fast improvement across the board:
- From mid-2024 to mid-2025, AI went from handling 3–4 hour tasks with a 50% success rate to handling about 1-week tasks at 50%.
- For tasks from 5 minutes to 24 hours long, success rates rose by roughly 8–11 percentage points over the study period.
- A practical way to picture it: the “longest task the AI can handle at a given success rate” roughly doubled every ~4 months.
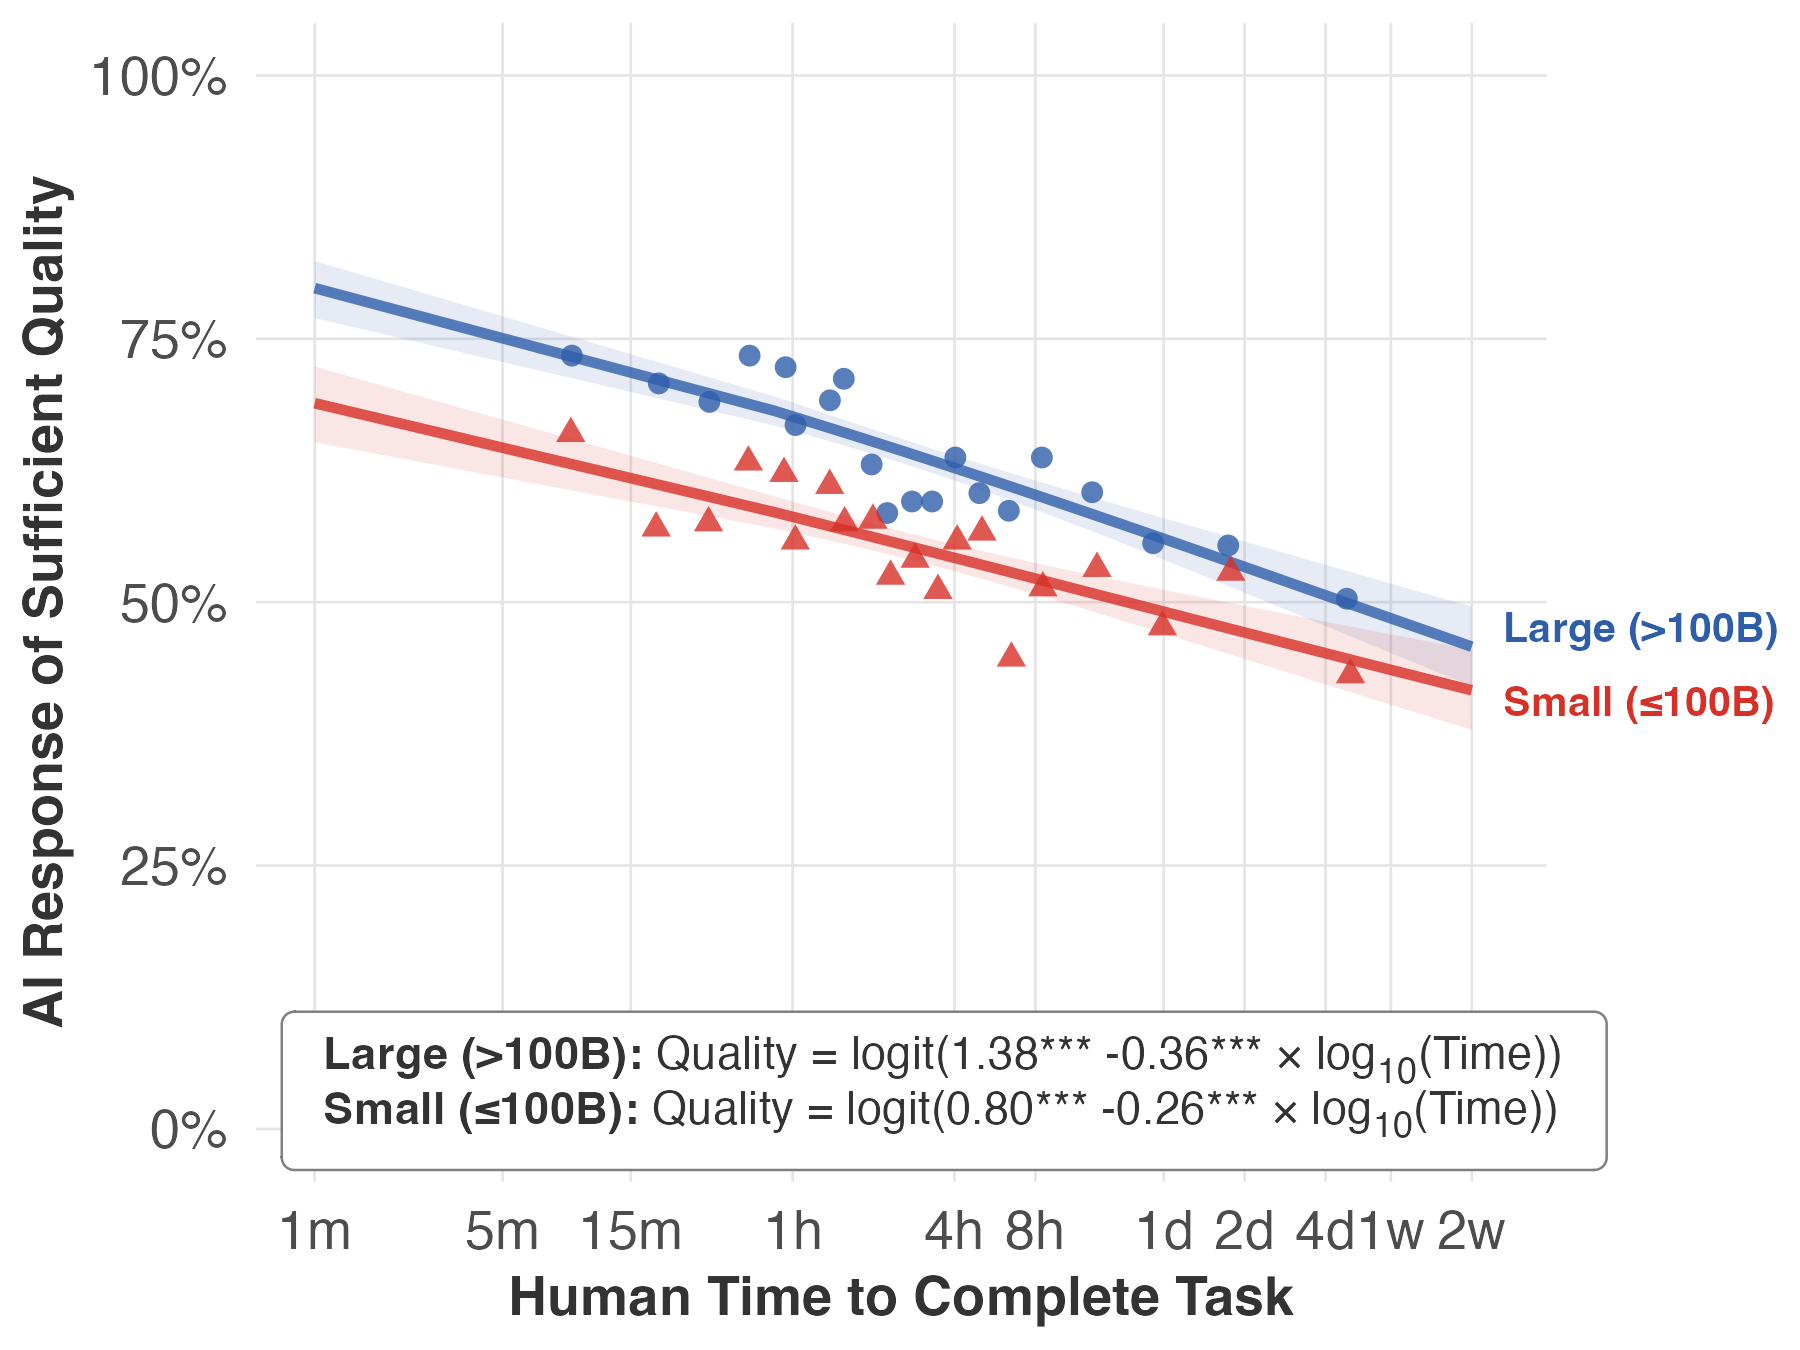
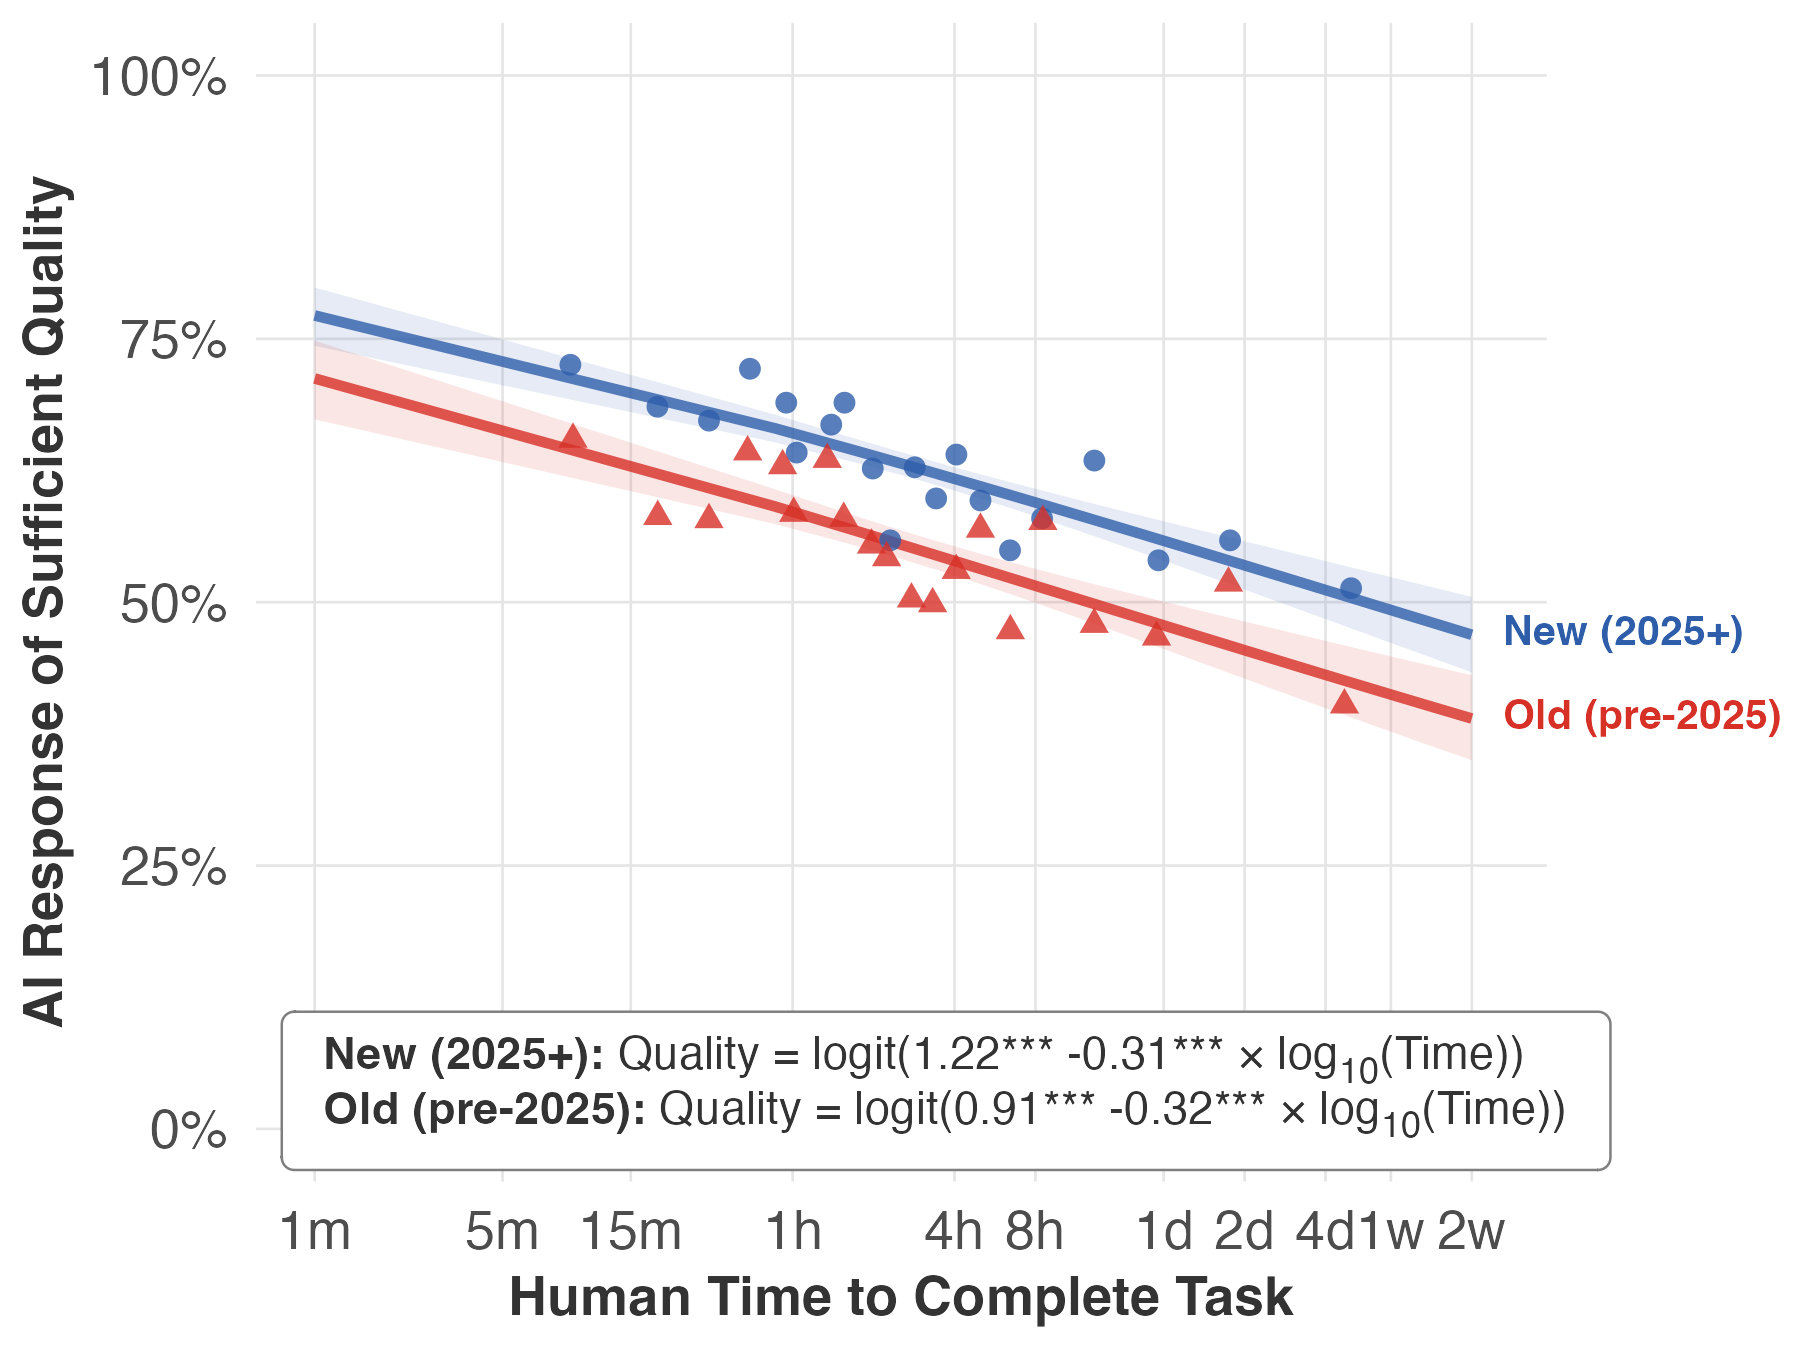
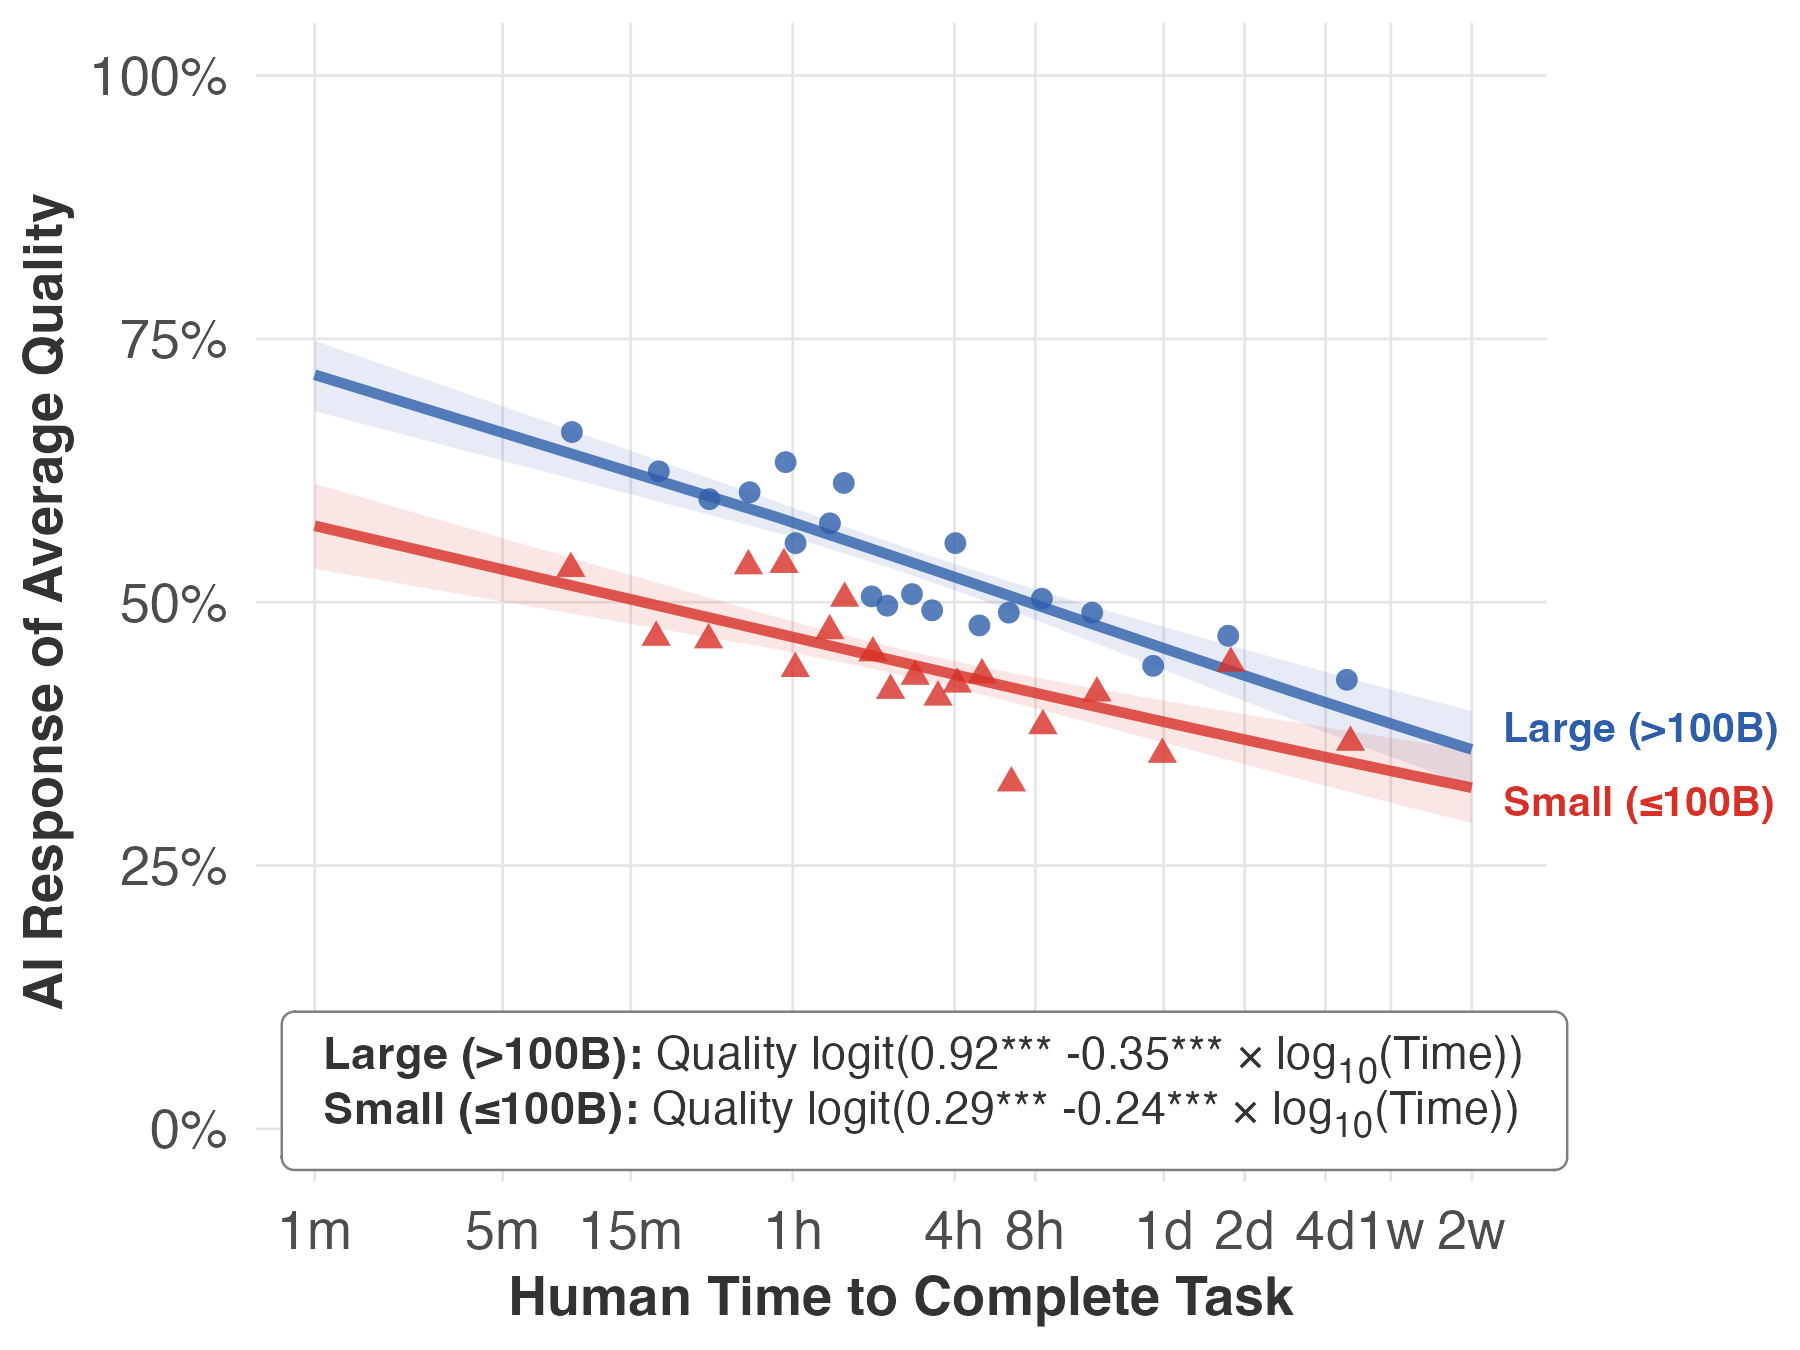
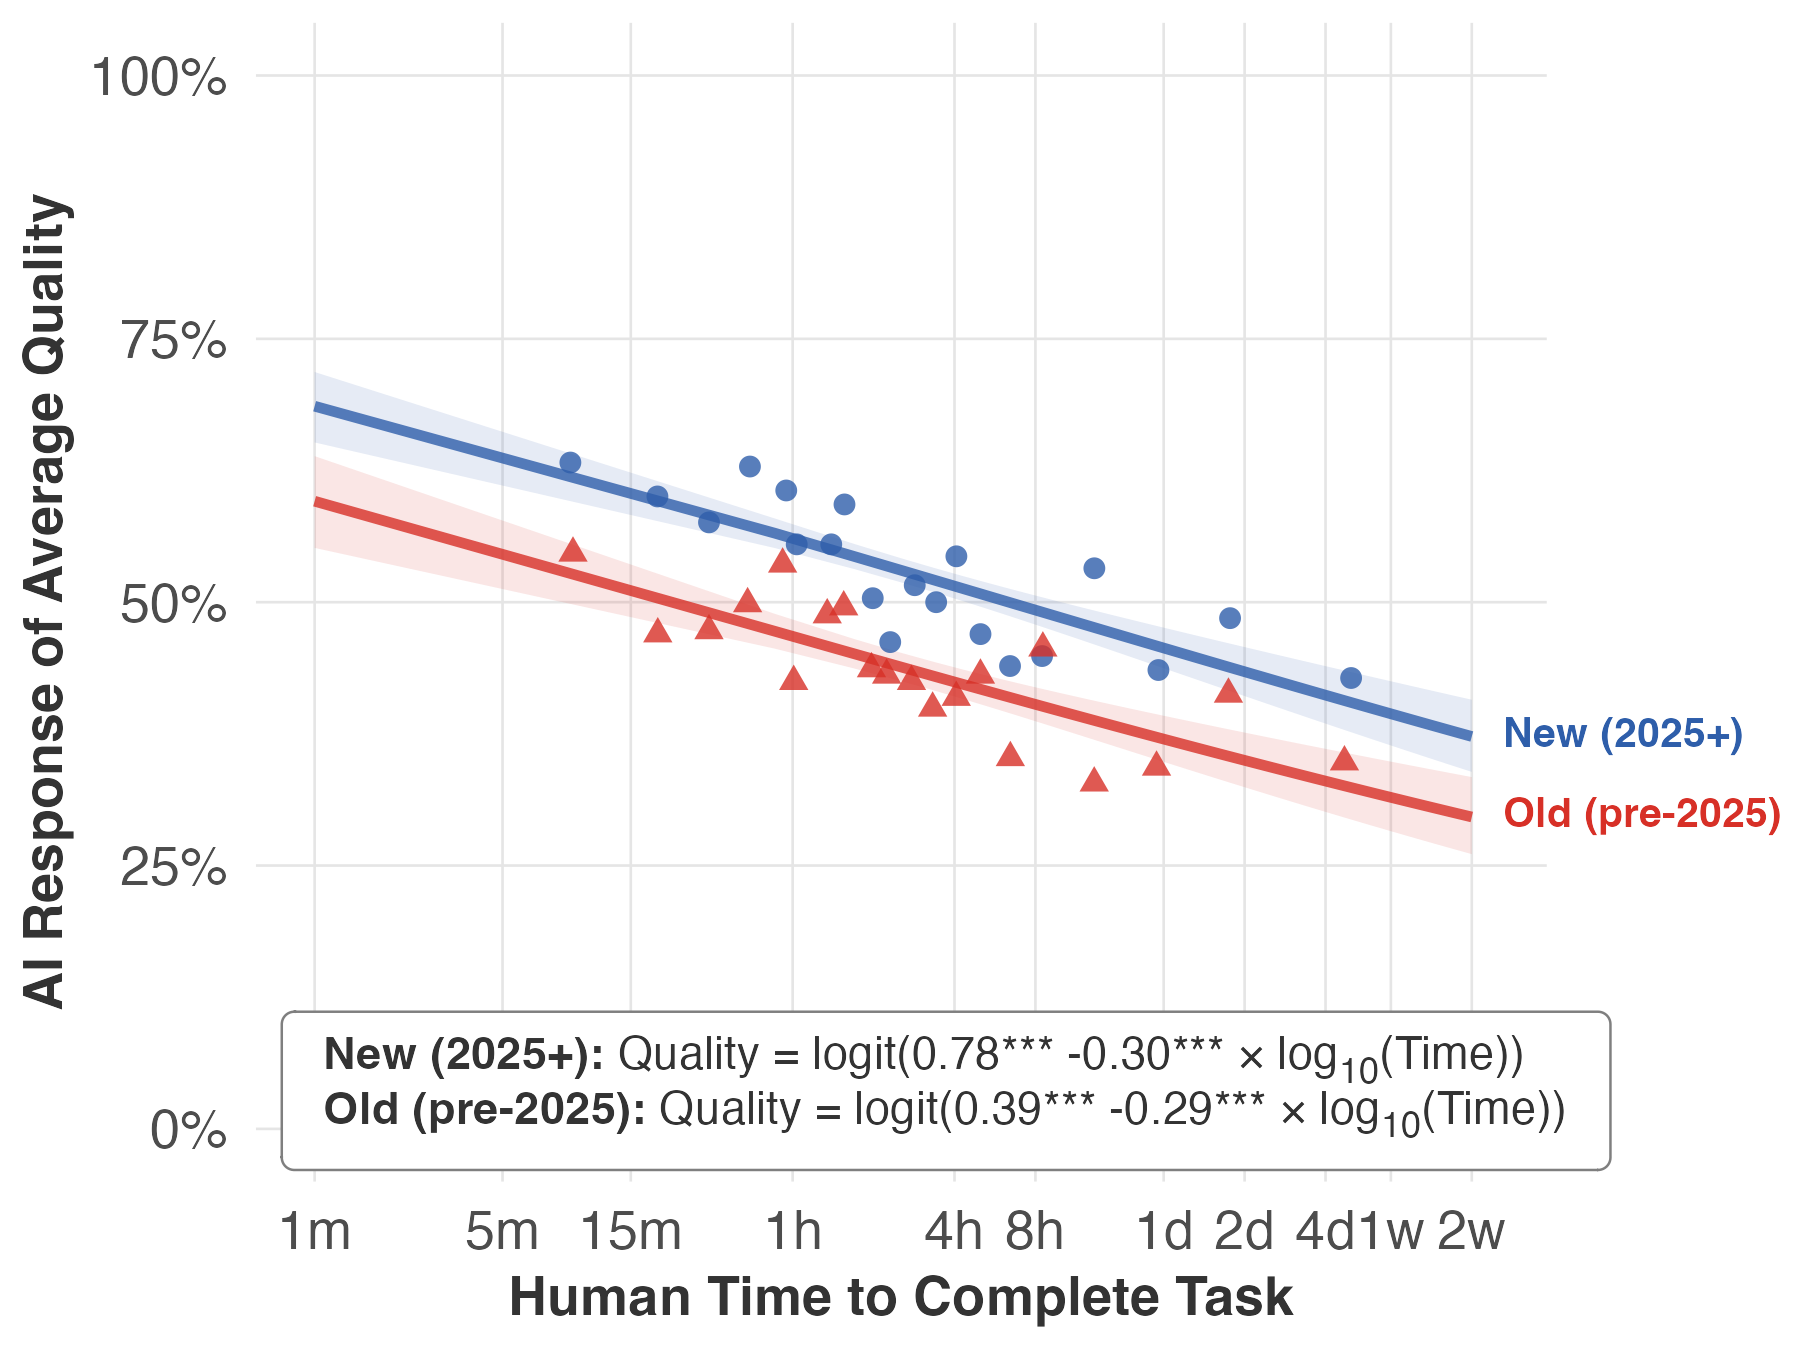
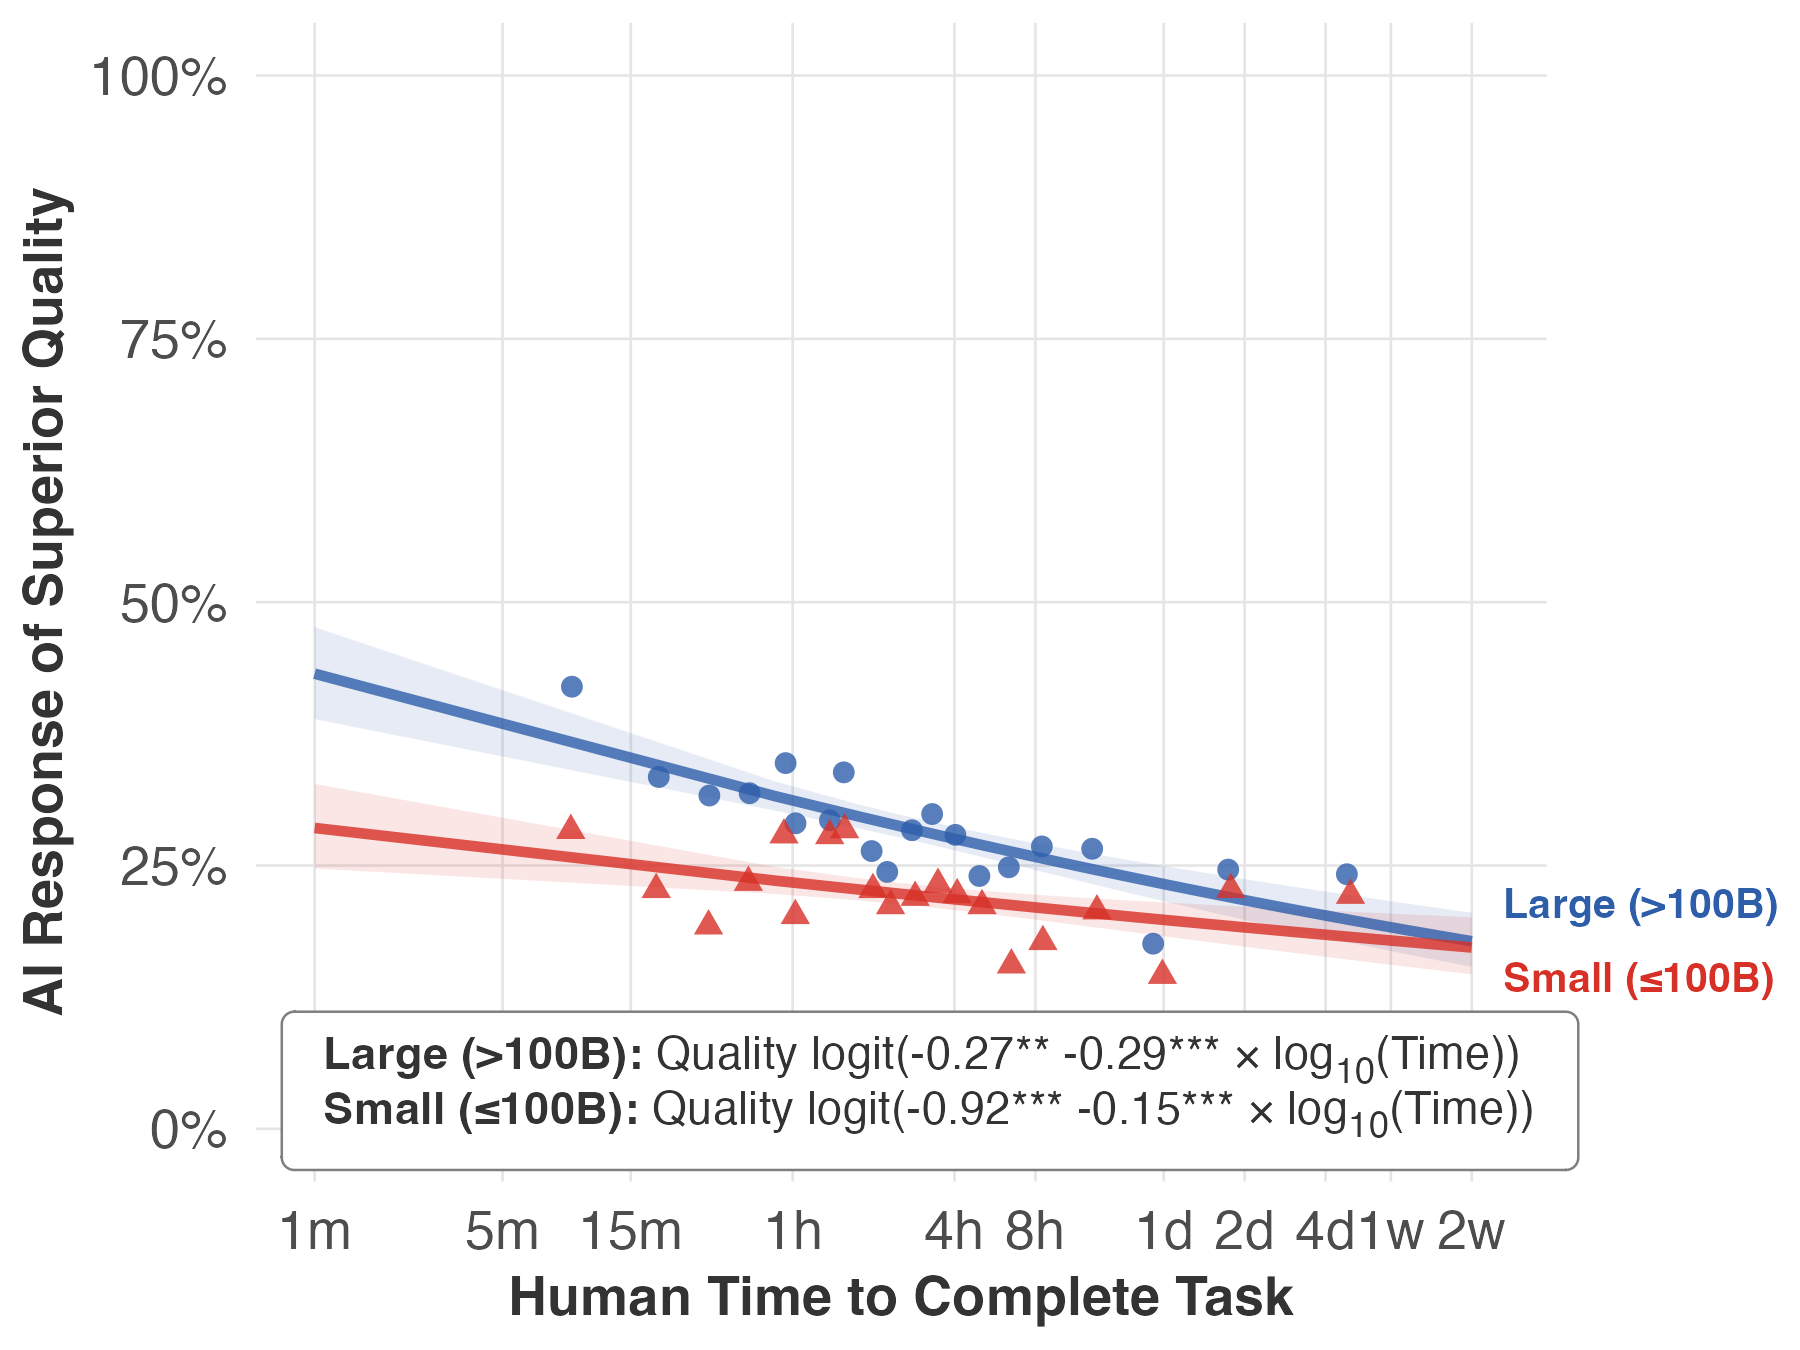
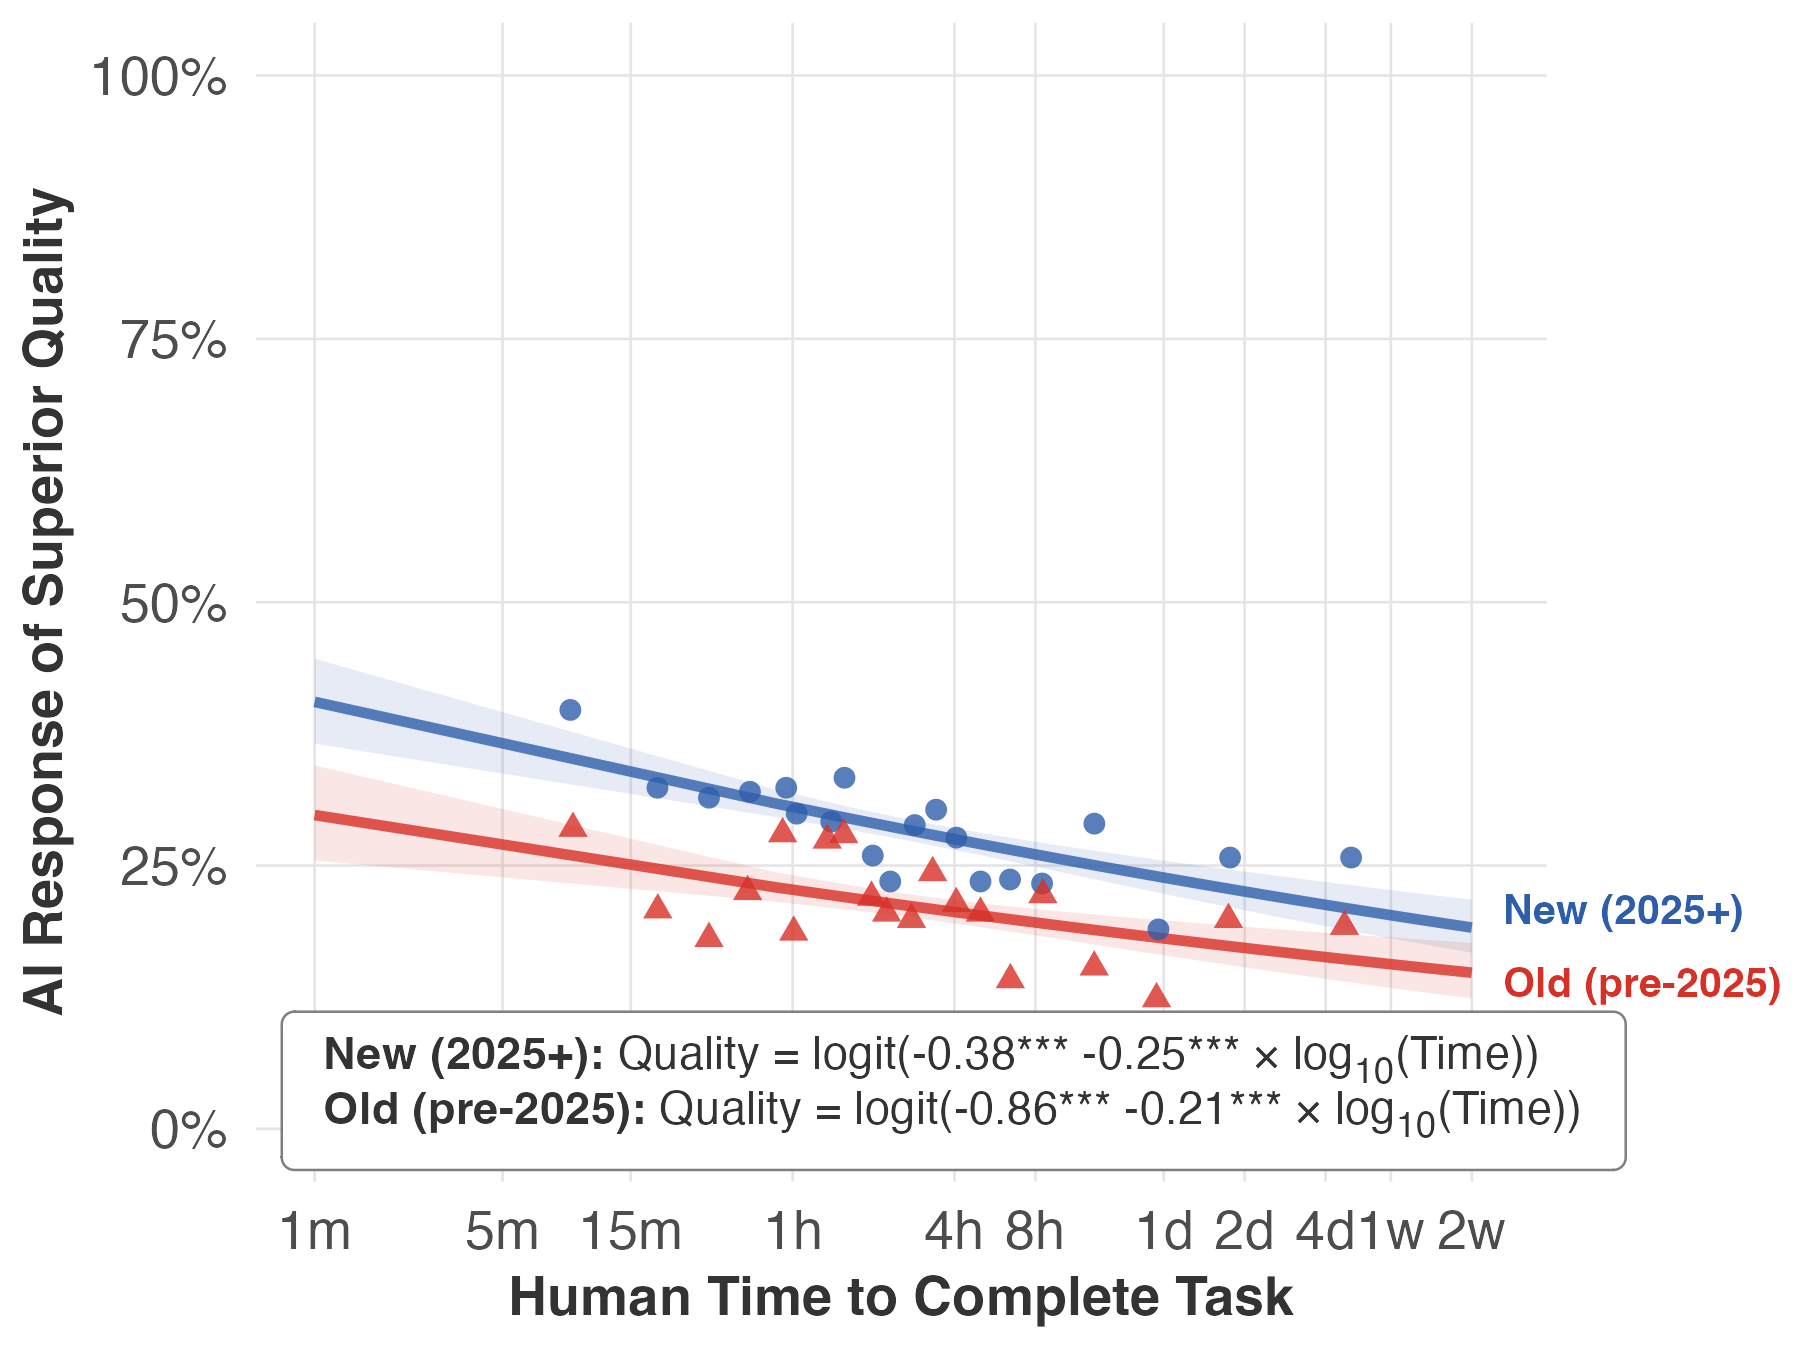
- Newer vs. bigger models:
- Newer models (released later) improve performance about equally across short and long tasks—a parallel lift.
- Bigger models (released at the same time as smaller ones) help more on short tasks than on long ones—the advantage fades as tasks get longer.
- Different job areas, different slopes: Most job families show the same rising-tide pattern, but the strength varies. Some areas (like Personal Care and Service) show a bigger drop with longer tasks; others (like Office/Admin or Business/Finance) show smaller drops. Average success also varies (for example, “Legal” tasks had lower success on average).
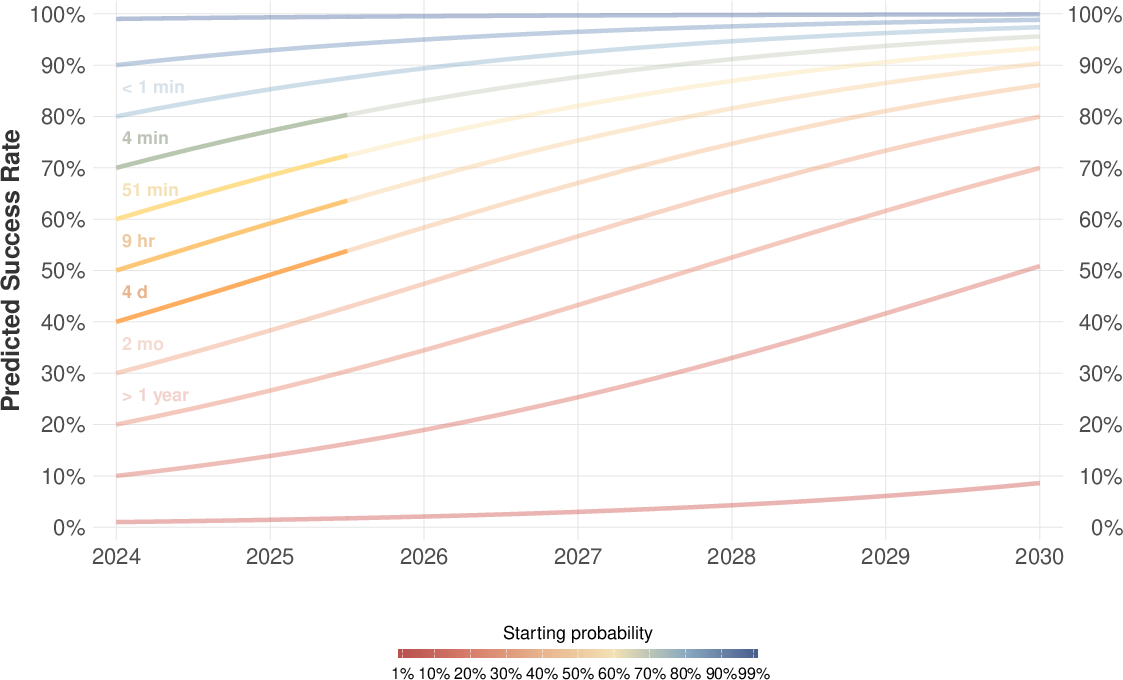
- Looking ahead (if trends continue): By around 2029, the authors project that AI could complete most text-related tasks with 80–95% success at a “minimally sufficient” level. Reaching near-perfect levels—or reaching the same success at “average” or “superior” quality—would likely take several more years.
Why this matters:
- If improvement is a rising tide, individual workers are less likely to be blindsided by sudden, narrow bursts of automation. But because the tide lifts many tasks at once—and quickly—it can still be very disruptive across the whole labor market.
Limits, cautions, and context
A few important caveats keep this grounded:
- Text-focused tasks only: The study tested tasks where LLMs make sense. It did not include purely physical tasks or tasks with no meaningful text component.
- “No edits” is a minimal bar: “Minimally sufficient” means a manager would accept it as-is, not that it’s excellent. Higher bars (average or superior quality) are harder and have lower current success rates.
- Not the same as whole jobs: Jobs are bundles of tasks, plus teamwork, accountability, real-world constraints, and “last mile” effort to fit outputs into complex workflows. Even if AI can do many tasks, turning that into full job automation takes longer and is costlier.
- Future progress could slow: The projections assume recent improvement continues. But compute costs, hardware limits, and slower algorithmic gains could all slow progress. The authors present the 2029 forecast as an upper-bound scenario.
What this could mean for people and organizations
- For workers: Expect broad, steady improvement in AI help across many text-based tasks—writing, analysis, planning, summarizing—rather than sudden jumps in just a few. That gives more time to adapt, but the pace is still fast enough to matter.
- For managers and teams: AI can already handle a significant share of routine text tasks and is improving quickly. Planning for training, oversight, and quality control remains important, especially in areas with low tolerance for error.
- For the economy: Even if AI capabilities rise fast, actual adoption takes time. Processes, tools, and rules must change. The bigger effect on jobs and productivity may show up over several years, not overnight.
Simple takeaway
AI progress looks less like a sudden crashing wave and more like a fast-rising tide. It is lifting performance across many kinds of text-based work at once. If recent trends continue, by the end of the decade AI could handle most such tasks at a “good enough” level, while truly top-tier, near-flawless performance will take longer. This gives people some time to adjust—but the tide is rising quickly, and it will touch a lot of jobs.
Knowledge Gaps
Knowledge gaps, limitations, and open questions
Below is a concise list of what remains missing, uncertain, or unexplored in the study, framed to guide actionable follow‑up research.
- Sampling bias from task pre‑filtering: Tasks are included only if GPT‑4 predicted ≥10% time savings and are text/partially text-based, likely inflating success rates and limiting representativeness. Future work should evaluate a random, unfiltered O*NET task sample and report how results change.
- Generalizability beyond text tasks: Findings exclude non-text, multimodal, and physically embodied work components. Assess whether “rising tide” patterns hold when tasks require images, audio, code execution, sensors, or physical actions.
- Coverage of task-duration tails: Extremely short (seconds) and very long (multi-week) tasks are scarce. The logistic slope in the tails—and the possibility of “crashing waves” at extremes—remains undetermined. Expand coverage to the tails and test slope stability.
- Measurement of task duration: Human time-on-task is provided by evaluators and may be noisy or biased. Validate duration measures with independent benchmarks (e.g., time-use diaries, instrumented workflows, or archival logs) and quantify measurement error.
- Subjective outcome metric and inter-rater reliability: “Manager acceptance without edits” is subjective and evaluator agreement rates are not reported. Collect inter-rater reliability statistics (e.g., Krippendorff’s alpha), use anchored vignettes, and calibrate raters across domains.
- Binary success thresholds obscure edit costs: “No edits needed” does not quantify the time or difficulty of edits when outputs are “useful with edits.” Directly measure edit time/effort and incorporate “last‑mile” costs into success/automation estimates.
- Single-shot vs. multi-run variance: Non-determinism in LLM outputs is not captured if only one sample is scored. Use multiple generations per model-task with fixed temperatures to estimate variance and tail risks.
- Protocol transparency and prompt sensitivity: Details on prompts, chain-of-thought use, few-shot examples, system prompts, context window limits, and temperature settings are not fully specified. Release complete evaluation protocols and perform prompt-robustness ablations.
- Tool use and realistic agent workflows: It is unclear whether models used retrieval, browsing, code execution, or plugins. Since real deployments do, re-run evaluations with standardized tool stacks to gauge the gap between “bare LLM” and tool-augmented performance.
- Instance construction and realism: Task instances are constructed and later screened as “realistic,” but creation may introduce systematic biases (e.g., towards well-specified tasks). Audit instance-generation procedures and compare against naturally occurring artifacts (e.g., real reports/emails).
- Model pooling and slope attenuation: Pooling across models and domains may flatten estimated slopes. Fit hierarchical/mixed-effects models and report model-specific slopes to test whether pooling conceals steepness for particular systems or domains.
- Mechanisms behind job-family heterogeneity: Large slope differences across job families are reported, but causal mechanisms (e.g., sequential dependence, domain ambiguity, compliance constraints) are not tested. Link slope estimates to independently measured task-structure features.
- Micro-foundation remains unvalidated: The mapping from the slope β to “number of sequentially dependent steps” is theoretical. Construct tasks with known step dependency profiles to empirically validate or refine the mapping.
- Size vs. vintage contributions: The paper notes different patterns for larger models versus newer vintages but does not quantify their relative contributions or underlying causes (architecture, data, RL, post-training). Decompose gains with controlled comparisons and ablation studies.
- Functional-form risk in projections: The time trend assumes a parallel upward shift (constant slope) in logistic space; alternative links (e.g., probit, cloglog, spline) could change forecasts materially, especially in the tails. Report model-averaged forecasts and stress tests across functional forms.
- Trend-extrapolation uncertainty: Projections to 2029 presume recent improvement rates persist; potential deceleration from compute, data, or algorithmic limits is acknowledged but not modeled. Provide scenario analyses (e.g., plateau, slowdown, step-change) with confidence bands.
- External validity to deployment: “Minimally sufficient” acceptance may not meet organizational, legal, or safety requirements in high-stakes domains. Incorporate domain-specific acceptance thresholds, compliance checks, and error cost models.
- Error severity and risk profiles: Success probabilities do not distinguish benign from catastrophic errors or hallucinations. Classify error types and severities, and integrate risk-weighted performance metrics.
- Economic and organizational adoption gap: The translation from capability to realized automation (costs, integration, workflow redesign, complementarity with workers) is not estimated. Conduct field studies to map capability curves to adoption timelines and net productivity effects.
- Cross-period comparability: API changes, default safety layers, or context-window expansions across time may confound “vintage” effects. Control for platform changes and report sensitivity to API/version drift.
- Small-sample job families: Some families (e.g., N≈40) yield wide confidence intervals and inconclusive slopes. Increase samples in underrepresented families to stabilize estimates.
- Language, geography, and equity: The study targets U.S. O*NET tasks; non-English tasks and global contexts are not assessed. Test multilingual tasks and examine differential impacts across languages and regions.
- Fairness and disparate impact: Task success by population served (e.g., legal, healthcare, social services) isn’t analyzed for bias. Evaluate subgroup performance and fairness constraints in domains with vulnerable populations.
- Collaboration and hybrid workflows: The study evaluates full AI completion, not mixed human–AI teaming where AI drafts and humans refine. Measure productivity and quality in hybrid conditions and compare to full automation.
- Cost-performance tradeoffs: Inference cost, latency, and throughput are not considered; economic feasibility at scale is unknown. Add cost and latency metrics to produce $/task and time-to-completion frontiers.
- Release criteria and “frontier” definition: The set of frontier models changes over time; sensitivity to alternative frontier definitions is only briefly noted. Pre-register and test multiple frontier definitions to ensure robustness.
- Reconciliation with METR findings: Differences with METR’s steeper curves are hypothesized (task types, duration coverage) but not experimentally resolved. Run matched-task head-to-head comparisons and meta-analyses to pinpoint sources of discrepancy.
- Data and code availability: Public release plans for datasets, prompts, rubrics, and scoring tools are not stated. Open materials to enable replication, independent audits, and method extensions.
Practical Applications
Overview
Drawing on the paper’s central finding—that AI automation is proceeding as a broad, “rising tide” across many text-based labor-market tasks rather than as sudden “crashing waves”—the applications below translate the results, methods, and observed improvement rates into concrete actions. Each item notes relevant sectors, potential tools/products/workflows, and key assumptions/dependencies that could affect feasibility.
Immediate Applications
These applications can be piloted or deployed now using current frontier models and the paper’s evaluation methodology.
- Cross-functional “automation opportunity” audits using task-duration triage
- Sectors: enterprise operations (management, office/admin support), software, education, healthcare administration, finance, sales/marketing, media/content
- What: Inventory department workflows; estimate human task duration; prioritize LLM automation where current success rates are ≥50–70% at “minimally sufficient” quality (score ≥7). Use duration bands (e.g., 5–60 minutes; 1–4 hours; 4–24 hours) to set targets.
- Tools/workflows: “Duration-aware” automation planner integrated with ticketing (Jira, ServiceNow), RPA, and document systems; dashboards showing expected success by duration.
- Assumptions/dependencies: Tasks must be LLM-addressable (text or partially text); success thresholds align with manager expectations; reliable duration estimates exist; privacy/compliance needs are met.
- Model selection policy: newer-vintage for broad gains; larger models for short tasks
- Sectors: all that deploy LLMs
- What: Adopt a policy that prioritizes newer models for across-the-board improvements (parallel shift), and routes ≤1-hour tasks to larger models for a stronger uplift on short tasks (outward rotation).
- Tools/workflows: Model router that considers task duration and target quality (≥7/≥8/9) to choose model size and vintage automatically.
- Assumptions/dependencies: Cost/performance trade-offs acceptable; access to multiple model families; latency constraints for larger models are manageable.
- Human-in-the-loop QA calibrated to error tolerance and task duration
- Sectors: healthcare (documentation, prior auth), finance (memos, reconciliations), legal (drafts), education (rubrics/lesson plans), customer operations
- What: For domains with low error tolerance or longer-duration tasks, pair LLM outputs with lightweight QA checklists or manager sign-off; for short, routine tasks, accept “minimally sufficient” outputs with spot checks.
- Tools/workflows: Quality gates aligned to score ≥7/≥8/9; sampling-based audits; automated uncertainty flags; review SLAs by job family.
- Assumptions/dependencies: Clear definition of “minimally sufficient”; audit capacity; regulatory requirements for human oversight.
- Task redesign to decompose long tasks into serial substeps
- Sectors: software (docs/tests/specs), management (reports/briefs), education (unit plans), research (summaries/lit scans), media (packages)
- What: Break multi-day tasks into coupled steps that map to higher LLM success on short segments; sequence with orchestration tools and insert QA after critical steps.
- Tools/workflows: Agentic planners; checklists that mirror sequential dependence; step-wise templates; “chain-of-steps” libraries.
- Assumptions/dependencies: Staff skilled in decomposition; orchestration reliability; data/context provisioning for each substep.
- Organization-wide “acceptability thresholds” and governance for LLM outputs
- Sectors: policy, regulated industries (health, finance, legal), enterprise governance
- What: Define when “no edits required” at ≥7 is acceptable vs. when ≥8/9 is needed; align to risk profiles by job family (e.g., legal shows lower success, thus stricter thresholds).
- Tools/workflows: Policy matrices by domain and duration; automated enforcement in content pipelines; exception logging.
- Assumptions/dependencies: Risk appetite agreed; stakeholders trained; monitoring in place.
- Workforce planning and training that anticipates broad-based improvement
- Sectors: HR across industries; public workforce agencies
- What: Use the study’s rising-tide pattern to prioritize upskilling in review, task decomposition, prompt engineering, and AI supervision across many roles rather than only a few.
- Tools/workflows: Role-by-role curricula; micro-credentialing for AI QA; “AI supervisor” training paths.
- Assumptions/dependencies: Training time and budget; employee buy-in; task mix remains text-heavy enough to benefit.
- Procurement and budgeting based on projected improvement rates
- Sectors: enterprise IT, public sector
- What: Budget for faster ROI in short tasks (with larger models) and steady improvement for longer tasks (newer vintages); plan upgrade cadence (~3–6 months) to capture parallel shifts.
- Tools/workflows: Cost models tying API spend to duration-weighted gains; refresh schedules; A/B tests for each release.
- Assumptions/dependencies: Model pricing stability; access to new models; measurable KPIs tied to “minimally sufficient” acceptance.
- Domain-specific pilots where success rates already strong
- Sectors: office/admin support (scheduling, correspondence), sales/marketing (briefs, sequences), healthcare support and practitioners (documentation), education (materials), installation/maintenance (text tasks)
- What: Launch production pilots for tasks commonly in the several-minutes-to-few-hours range where predicted success ≥60–70% already.
- Tools/workflows: Pre-approved prompt libraries; red-team tests; fallback to human.
- Assumptions/dependencies: Sufficient task volume; robust data security; change management readiness.
- Academic replication and benchmarking using the paper’s methodology
- Sectors: academia, applied research labs
- What: Recreate the O*NET-mapped, worker-evaluated pipeline; estimate success–duration curves by domain; test alternative micro-foundations for the logistic slope (sequential dependence).
- Tools/workflows: Open task-instance repositories; evaluator panels; reproducible scoring protocols.
- Assumptions/dependencies: Access to evaluators; IRB/ethics for worker studies; funding for cross-model tests.
- Policy monitoring dashboards for gradual capability shifts
- Sectors: labor departments, economic development, regulators
- What: Track success rates and failure-rate halving in priority occupations; identify domains with steeper slopes (e.g., personal care & service text-tasks) for proactive support.
- Tools/workflows: Occupational “automation exposure” dashboards; early-warning indicators for training/reskilling.
- Assumptions/dependencies: Continuous data collection; accepted metrics; stakeholder coordination.
Long-Term Applications
These require additional research, scaling, integration, or regulatory development—often leveraging the study’s projections (e.g., 80–95% minimally sufficient success by ~2029) and acknowledging uncertainties about compute/algorithmic slowdowns.
- Duration-aware autonomous agents for end-to-end workflows
- Sectors: software (feature specs → tests → docs), finance (closing packs, compliance), healthcare admin (end-to-end prior auth), education (course design), media (multi-asset campaigns)
- What: Agents plan and execute multi-day workflows by decomposing into substeps, selecting models (size/vintage) per step, and inserting QA at error-intolerant points.
- Tools/products: Orchestration platforms with “serial-dependence” planners; acceptance-threshold routers; learned QA checkpoints.
- Assumptions/dependencies: Reliable task segmentation; tool-use integrations; alignment with domain regulations; improved long-duration performance as projected.
- Sector-specific certification of AI-generated work at defined quality thresholds
- Sectors: healthcare, finance, legal, public sector
- What: Standards defining when AI outputs can be accepted without edits (≥7), when average/superior quality is required (≥8/9), and required human oversight.
- Tools/products: Certification audits; third-party conformity assessment; provenance tracking.
- Assumptions/dependencies: Regulator consensus; measurable, repeatable scoring; liability frameworks.
- Dynamic labor policy “glidepaths” keyed to rising-tide trends
- Sectors: policy/labor economics
- What: Phase-in of benefits, mobility support, and reskilling tied to observed success-rate trajectories (rather than sudden shocks). Target job families with consistent gains.
- Tools/workflows: Trigger-based funding releases; regional training consortia; employer incentives for upskilling.
- Assumptions/dependencies: High-quality, timely monitoring data; political consensus; program evaluation capacity.
- Enterprise-wide task-to-AI mapping systems rooted in O*NET taxonomies
- Sectors: large enterprises, HR tech vendors
- What: Maintain live catalogs mapping internal tasks to O*NET-like descriptors, with duration, error tolerance, and current model performance overlays to guide automation roadmaps.
- Tools/products: “Task graph” platforms; ROI and risk simulators; model upgrade impact forecasts.
- Assumptions/dependencies: Accurate task capture; change management; integration with HRIS/ITSM.
- Research programs to improve long-duration task performance
- Sectors: AI R&D, academia, tool vendors
- What: Target methods that close the gap on longer, serially dependent tasks (e.g., improved planning/RL, memory, tool-use, verification); quantify how slope relates to task structure.
- Tools/workflows: Benchmarks reflecting realistic multi-step tasks; longitudinal evaluations by job family.
- Assumptions/dependencies: Sustained compute and algorithmic progress; data availability for end-to-end tasks.
- Industry-specific AI QA and incident reporting ecosystems
- Sectors: regulated industries, critical infrastructure, public sector
- What: Shared registries for AI errors, near-misses, and mitigations—by duration band and domain—to refine acceptance thresholds and oversight.
- Tools/products: Incident databases; safety pattern libraries; continuous assurance services.
- Assumptions/dependencies: Legal protection for reporting; standardized taxonomies; cultural adoption.
- Education system redesign for “AI supervisor” competencies
- Sectors: K–12, higher education, vocational training
- What: Curricula that teach task decomposition, acceptance criteria, uncertainty detection, and domain-specific QA aligned to rising-tide adoption across disciplines.
- Tools/products: Micro-credentials; assessment rubrics tied to ≥7/≥8/9 thresholds; capstones on orchestrating multi-step AI work.
- Assumptions/dependencies: Standards bodies’ buy-in; teacher training; equitable access to models.
- Macro-planning for compute, privacy, and compliance infrastructure
- Sectors: government, hyperscalers, large enterprises
- What: Investment roadmaps anticipating broad-based AI use in text-heavy workflows (storage, secure data interfaces, audit trails) and potential slowdowns in hardware/algorithmic progress.
- Tools/workflows: Capacity forecasting models; privacy-enhancing tech; cost-containment via caching/distillation.
- Assumptions/dependencies: Budget stability; regulatory clarity; evolution of model licensing/costs.
- Adaptive compensation and job design
- Sectors: enterprise HR, gig platforms
- What: Redesign roles to focus on oversight and value-added tasks; compensation models recognizing productivity increases from AI assistance and time reallocation from short to complex work.
- Tools/workflows: Task-mix tracking; performance metrics tied to QA and throughput; internal marketplaces for decomposed tasks.
- Assumptions/dependencies: Labor relations; fair attribution of AI contributions; safeguards against over-automation.
- Longitudinal occupational forecasting grounded in success–duration curves
- Sectors: labor economists, think tanks, policymakers
- What: Forecast employment shifts by combining observed slopes and progress rates with task mixes and “last-mile” costs to predict timing/scale of impacts.
- Tools/workflows: Open models integrating success rates, failure-rate halving times, and adoption lags.
- Assumptions/dependencies: Stable or transparently updated improvement rates; credible adoption models; data on firm integration costs.
Notes on Key Assumptions and Dependencies
- Applicability is limited to text-based or partially text-based tasks; purely physical tasks are out of scope.
- “Minimally sufficient” (score ≥7) is not synonymous with average or superior quality (≥8/9); domains with low error tolerance require stricter thresholds and stronger oversight.
- Task sampling was pre-filtered for ≥10% time-savings potential via GPT-4, which may bias toward LLM-relevant tasks.
- Human evaluator judgments introduce variance; organizations should calibrate scoring to their standards.
- Extrapolations (e.g., 80–95% minimally sufficient by ~2029) assume continued recent capability growth; potential slowdowns in compute, hardware, or algorithms could extend timelines.
- Adoption depends on “last-mile” integration costs, data access, privacy/security, and change management—factors that can materially lag capability.
- Differences across job families are meaningful; legal tasks show lower success levels, while some families (e.g., personal care & service text tasks) exhibit steeper duration effects, requiring customized strategies.
Glossary
- binned scatter: A plotting approach that groups observations into bins to display average relationships in noisy data. "Binned scatter points summarize the raw data."
- complementary log-log specification: A statistical link function alternative to the logit for modeling binary outcomes, often used when event probabilities are near 0 or 1. "These results are robust to using alternative functional forms, such as a complementary log-log specification (Appendix Figure \ref{start_prob_projection_logit_vs_cloglog})."
- doubling time: The time required for a capability metric to double; here, how quickly feasible task duration grows for a fixed success rate. "When estimating a linear-trend model across all periods, the implied "doubling time," or the calendar time between model releases needed for newer models to achieve the same success rate on tasks which are twice as long, equals 3.8 months and is estimated with relatively high precision."
- failure-rate halving time: The time it takes for the failure probability (1 − success rate) to be reduced by half. "Based on these curves, we approximate failure-rate halving times (the failure rate is 1 minus the success rate), which equal 2.4â3.2 years over this period."
- frontier models: The most capable or latest-generation AI models at a given time used for state-of-the-art evaluation. "We estimate Eq. \eqref{eq:logit_reg_time} using only frontier models (see figure notes)."
- job family: A group of occupations with related activities, used here per the O*NET taxonomy. "Automation within particular "job families" (e.g., management or community and social service) also follows the same rising-tide pattern in most cases."
- last mile costs: The additional costs and effort required to take a system from adequate to fully deployable or near-perfect performance. "As discussed later, these findings will not translate directly to shares of job automation, because of sampling issues, "last mile" costs (\cite{fleming2024last}), and other reasons."
- linear-trend model: A model that adds a term linear in time (or release date) to capture systematic temporal improvement. "When estimating a linear-trend model across all periods, the implied "doubling time," or the calendar time between model releases needed for newer models to achieve the same success rate on tasks which are twice as long, equals 3.8 months and is estimated with relatively high precision."
- LLM-addressable: Tasks that can be attempted or assisted by LLMs because they are text-based. "We test for these effects in preliminary evidence from an ongoing evaluation of AI capabilities across over 3,000 broad-based tasks derived from the U.S. Department of Labor O*NET categorization that are text-based and thus LLM-addressable."
- log-odds: The logarithm of the odds p/(1−p), a common scale for coefficients in logistic models. "Coefficients are shown as log-odds on the figure."
- log-spaced time bins: Bins whose boundaries increase geometrically, used to evenly cover orders of magnitude in time. "we partition task instances into 40 equally sized, log-spaced time bins and compute success rates and sample sizes within each bin."
- logistic CDF: The cumulative distribution function of the logistic distribution, used as the link function in logistic regression. "Here, denotes the logistic CDF and is a constant."
- logistic curve: An S-shaped function describing probabilities as a function of predictors; here, success versus task duration. "For crashing waves, this relationship can be well described by a steep logistic curve."
- logistic model: A regression model for binary outcomes using the logistic CDF as the link function. "Our main specification estimates the following logistic model:"
- logit: The inverse of the logistic function, mapping probabilities to the real line; also the canonical link for logistic regression. "Because and ."
- maximum likelihood: A method of parameter estimation that maximizes the likelihood of observed data under the model. "We estimate Eq. \eqref{eq:logit_reg} by maximum likelihood."
- micro-foundation: A theoretical modeling rationale that explains an empirical relationship in terms of underlying mechanisms. "In Section \ref{theory_subsection}, we provide one possible micro-foundation for Eq. \eqref{eq:logit_reg} under which the slope coefficient admits a structural interpretation: it can be mapped to the number of sequentially dependent steps required to complete a task."
- model vintage: The release cohort or time period of a model, used to distinguish improvements due to newer generations. "The performance gains from increasing model size are different than those from newer model vintages."
- non-deterministic: Describing tasks or benchmarks where multiple valid outputs or stochastic elements exist, reducing predictability. "By contrast, we focus on non-deterministic, realistic, and representative labor-market tasks."
- O*NET: The U.S. Department of Labor’s Occupational Information Network, a taxonomy of occupations, tasks, and skills. "over 3,000 broad-based tasks derived from the U.S. Department of Labor O*NET categorization"
- reinforcement learning: A training paradigm where agents learn by receiving feedback signals (rewards) for actions, potentially improving task sequencing. "A natural interpretation is that improving longer-duration tasks is more demanding than improving short-duration tasks --- and in particular that long-duration tasks, even if they are ultimately sequences of coupled short-duration ones (see Section \ref{theory_subsection}), could require additional training / reinforcement learning over how to combine them."
- serial dependence: Dependence across sequential steps, where later parts of a task rely on earlier parts. "Task duration can plausibly relate to the serial dependence of tasks: longer tasks may require completing more coupled sequential sub-steps."
- sigmoidal: Having an S-shaped form; characteristic of logistic-type curves in probability space. "Because the release-date term, , enters additively in the logit specification of Eq. \eqref{eq:logit_reg_time}, it implies a sigmoidal path in probability space."
- standard errors clustered by participant: An adjustment to variance estimates that accounts for within-cluster correlation in residuals at the participant level. "Standard errors are clustered by participant in parentheses."
Collections
Sign up for free to add this paper to one or more collections.