Towards a Neural Debugger for Python
Abstract: Training LLMs on Python execution traces grounds them in code execution and enables the line-by-line execution prediction of whole Python programs, effectively turning them into neural interpreters (FAIR CodeGen Team et al., 2025). However, developers rarely execute programs step by step; instead, they use debuggers to stop execution at certain breakpoints and step through relevant portions only while inspecting or modifying program variables. Existing neural interpreter approaches lack such interactive control. To address this limitation, we introduce neural debuggers: LLMs that emulate traditional debuggers, supporting operations such as stepping into, over, or out of functions, as well as setting breakpoints at specific source lines. We show that neural debuggers -- obtained via fine-tuning large LLMs or pre-training smaller models from scratch -- can reliably model both forward execution (predicting future states and outputs) and inverse execution (inferring prior states or inputs) conditioned on debugger actions. Evaluated on CruxEval, our models achieve strong performance on both output and input prediction tasks, demonstrating robust conditional execution modeling. Our work takes first steps towards future agentic coding systems in which neural debuggers serve as a world model for simulated debugging environments, providing execution feedback or enabling agents to interact with real debugging tools. This capability lays the foundation for more powerful code generation, program understanding, and automated debugging.
Paper Prompts
Sign up for free to create and run prompts on this paper using GPT-5.
Top Community Prompts
Explain it Like I'm 14
What this paper is about
This paper introduces a new kind of AI tool called a “neural debugger” for Python. Think of it like a smart, pretend debugger that can imagine how code would run when you tell it to “step into,” “step over,” “step out,” or “stop at a breakpoint,” even if the code can’t actually be executed on a computer right now. The goal is to make AI models better at understanding and navigating how programs run, so they can help write, test, and fix code more effectively.
What questions the researchers asked
Here are the main questions the paper explores:
- Can an AI model follow common debugger commands (step into/over/return, breakpoints) and accurately predict what happens next in a Python program?
- Can the model also “work backwards” to guess what earlier inputs or states might have led to the current state (inverse execution)?
- How well does this approach improve a model’s ability to understand code and predict program outputs and inputs on standard tests?
How they did it (explained simply)
The team trained LLMs using detailed “stories” of how Python programs run, one line at a time. They turned debugging into a simple game:
- Imagine a video game where the “world” is the program’s current line and its variables, and your “moves” are debugger commands like step_into or breakpoint. Each move changes the game’s state.
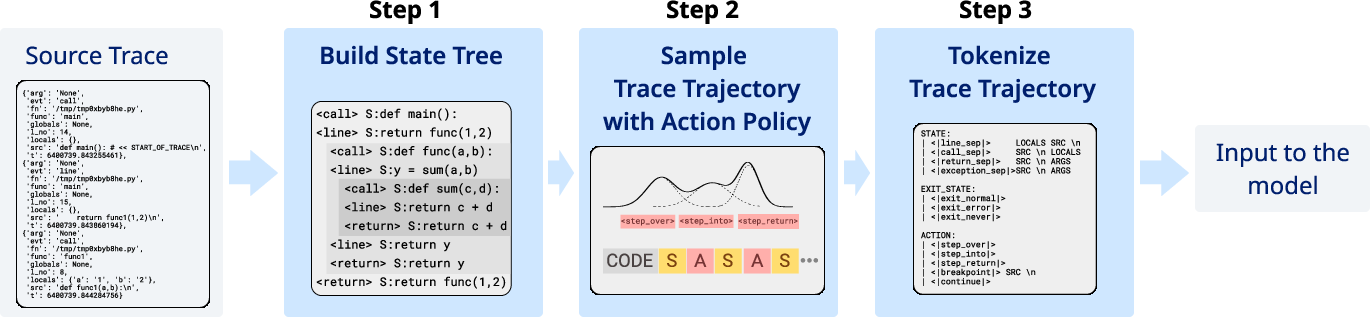
- They recorded real program runs using Python’s built-in tracer (like a recorder that notes each line executed, variables at that moment, and when functions are called or return).
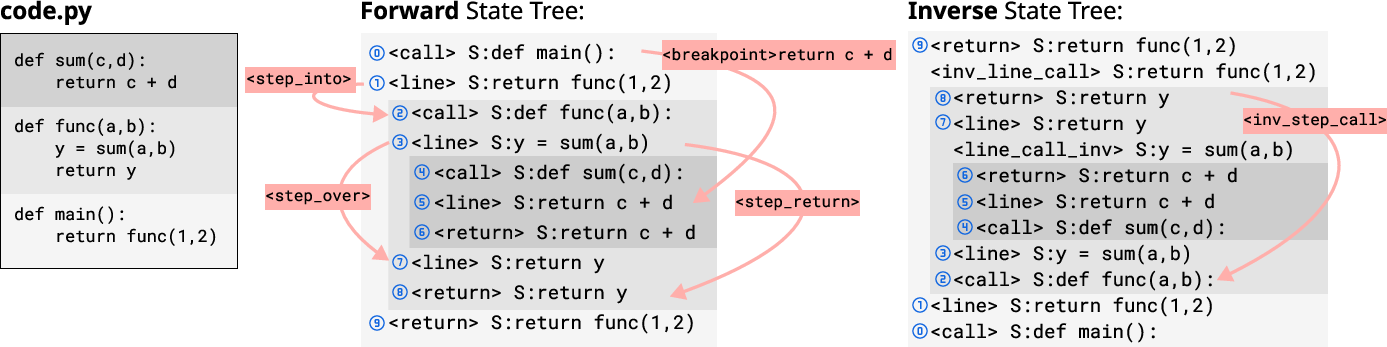
- From these recordings, they built a “state tree.” You can think of this as a map of all the places the program goes (including stepping into and out of function calls) and the order it visits them.
- They then sampled many “paths” through this tree by pretending to press debugger buttons (step/jump actions) to create training examples.
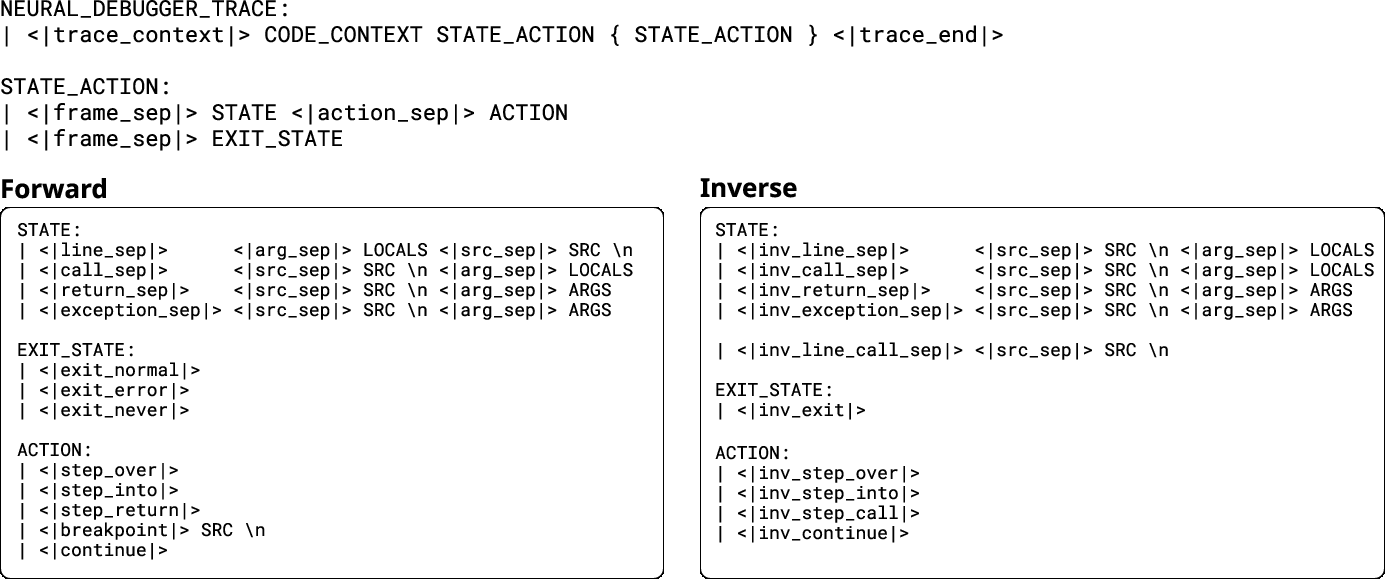
- They formatted these examples into a clear, structured text language so regular LLMs could learn from them.
- They trained two kinds of models:
- A big model (32B parameters) that had already learned from similar data and was fine-tuned on this debugger-style data.
- A smaller model (1.8B parameters) trained from scratch on the debugger data.
Two kinds of predictions were taught:
- Forward execution: predict what happens next when you press a debugger button.
- Inverse execution: guess what could have happened before, including possible inputs, given the current state. This is tricky because many different inputs can lead to the same state (like many number pairs can add up to 10).
What they found and why it matters
Here are the key findings:
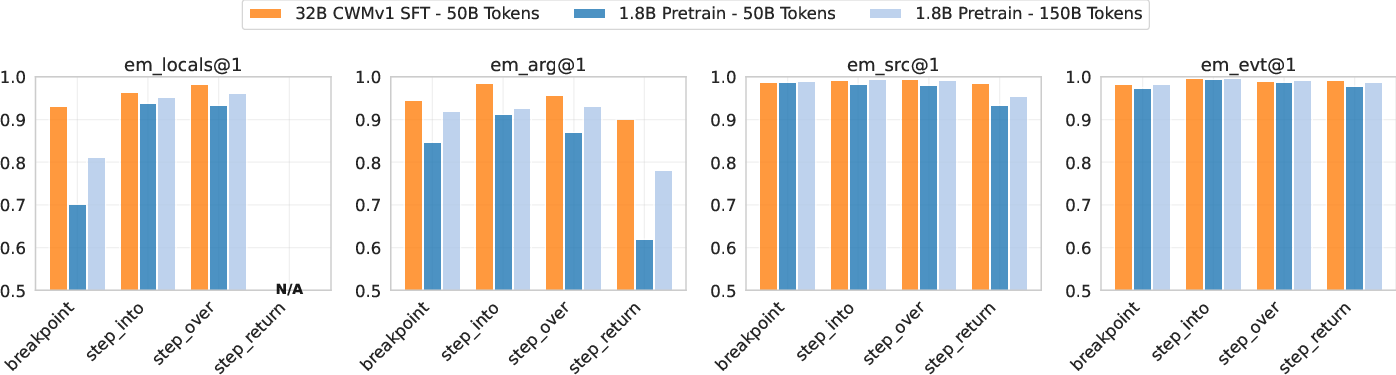
- The neural debugger can accurately predict what happens next when following step commands. The big model reached over 90% accuracy on forward next-state prediction for common actions.
- Jump actions (like jumping straight to a return line or a breakpoint) are harder, but the models still improved with more training.
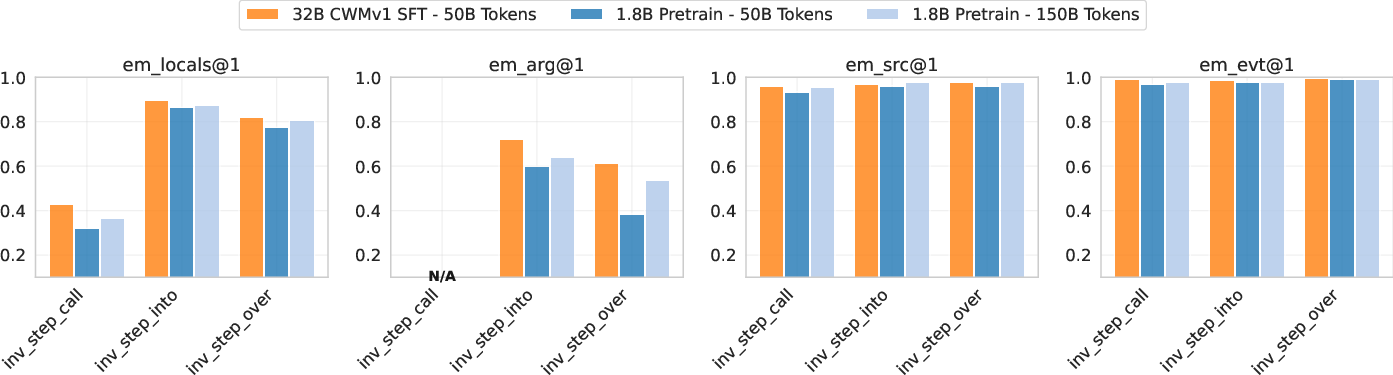
- Working backwards (inverse execution) is possible and gets better with training, though it’s naturally more ambiguous.
- The models did very well on a benchmark called CruxEval:
- Output prediction: up to 83.2% pass@1 using the breakpoint action with the big model.
- Input prediction: up to 66.5% pass@1 with the big model.
- Smaller models also did surprisingly well after enough training, showing you don’t always need a huge model to get useful debugging behavior.
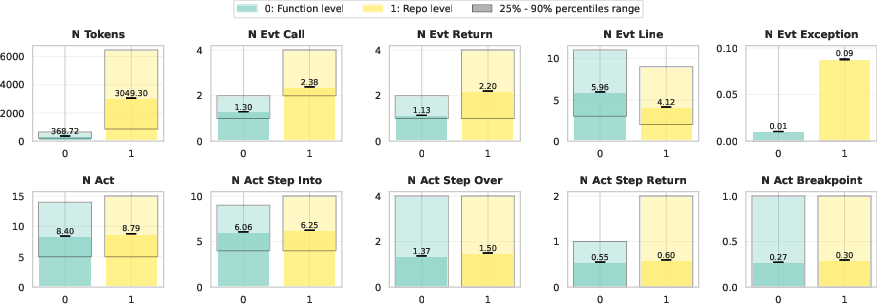
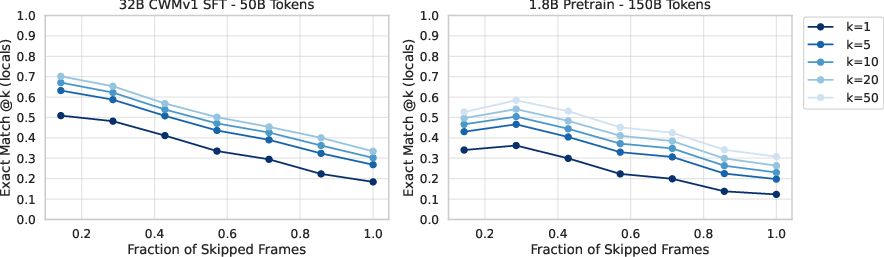
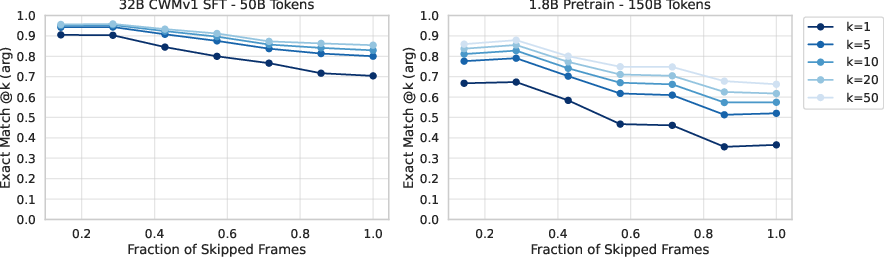
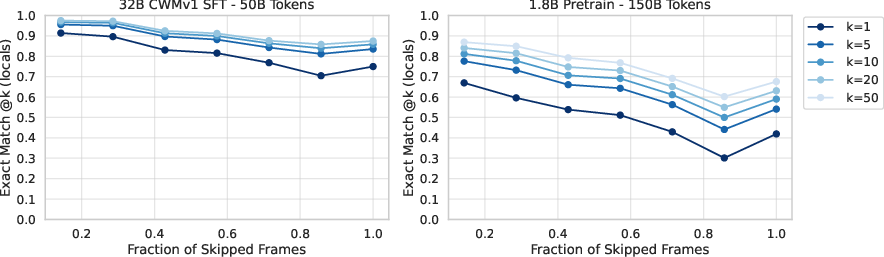
- The models are very good at predicting which source line runs next and what kind of event happens (like call or return). Predicting exact variable values is harder and where most mistakes occur.
- Accuracy drops as you ask the model to “skip” more steps (longer jumps or longer prediction horizons), but sampling multiple guesses helps.
These results matter because they show AI can learn not just to read code, but to navigate and control program execution like a debugger—making it much more useful for real-world coding tasks.
What this could mean in the future
Neural debuggers could:
- Help coding assistants plan, run, and debug code more intelligently, even in places where you can’t run the program (like restricted environments or partially written code).
- Speed up testing and fixing by letting an AI “simulate” execution without constantly re-running the program.
- Guess inputs that cause certain behaviors, which is useful for testing and finding edge cases.
- Act as a “world model” for agent-like coding systems, so agents can practice and plan debugging before interacting with real tools.
There are still limits: predicting exact variable values is harder than predicting control flow, and accuracy falls with longer jumps. But this work lays a strong foundation for smarter, more interactive AI tools that understand how programs actually run, not just how they look.
Knowledge Gaps
Knowledge gaps, limitations, and open questions
Below is a consolidated list of concrete gaps and open questions that remain unresolved by the paper and could guide future work:
- Missing reward/policy learning: the debugger MDP omits a reward and learns no action policy; trajectories are generated via a stochastic, non-human policy. How would imitation learning or RL with human traces or outcome-based rewards change efficiency (fewer steps to reach faults) and accuracy?
- Lack of human debugging behavior modeling: no datasets of real developer debugging sessions are used. How to collect and learn from realistic action distributions (e.g., not stepping through all loop iterations)?
- Unvalidated claim of simulating non-executable/partial programs: the paper asserts this capability but provides no empirical evaluation on incomplete code (missing deps, stubs, TODOs). How accurate are predictions with partial contexts, and what minimum context is needed?
- No integration with real debuggers/IDEs: there is no demonstration of round-trip interaction with pdb/ptvsd/VS Code (latency, synchronization, determinism, error handling). How to align action semantics and maintain consistency with a live process?
- Limited evaluation scope: metrics focus on next-state exact match and CruxEval input/output prediction. Performance on real debugging tasks (bug localization, failure reproduction, patch validation, regression triage) and user studies remains unknown.
- Inverse execution ambiguity not rigorously evaluated: EM@1 for inv_step_call is acknowledged as ill-suited. What probabilistic metrics (calibration, coverage/diversity, likelihood) and task setups better capture one-to-many inverse inference?
- Weakness in local variable prediction: errors concentrate in LOCALS/ARGS. What structured representations (SSA-like forms, typed schemas), auxiliary losses, constraint checking, or symbolic-execution–augmented training improve data-flow modeling?
- Serialization risks and scalability: LOCALS serialized via repr-to-JSON can be non-deterministic, huge, cyclic, or security-sensitive; “..":"..” elisions hide context. How to design canonical, bounded, safe, and compressible object encodings with cycle handling?
- Concurrency and async not addressed: sys.settrace has limitations with threads, asyncio, generators, and yields; semantics of step_over/into across awaits/yields are unspecified. How to extend the state tree and actions for multi-threaded/async programs?
- External side effects unmodeled: file I/O, networking, randomness, time, environment variables, and system calls are only discussed aspirationally. What datasets and formalisms are needed to model and validate side-effectful execution?
- C extensions and native code gaps: frames originating in C/C++ or external processes may be invisible to sys.settrace. How robust is state-tree reconstruction when parts of the call stack are opaque?
- Scalability to long traces/deep stacks: token-length constraints likely limit coverage of large repo-level sessions. Which memory-augmented architectures, hierarchical encodings, or retrieval schemes preserve long-horizon consistency?
- Jump action difficulty not systematically addressed: breakpoint and step_return lag step actions. Can planning (e.g., search over the state tree), curricula, or auxiliary targets (line-selection heads) improve jump accuracy?
- Prediction horizon degradation: accuracy drops with longer horizons; only naive sampling budgets are explored. Can uncertainty-aware jumping, iterative refinement, rollouts, or MCTS-like planning mitigate this?
- Restricted action space: no conditional breakpoints, watchpoints, or state mutation (editing variables mid-session), which are common in real debuggers. How to extend and learn richer action semantics safely?
- Exceptions underexplored: exception prediction is more frequent in repo-level data, but there’s no focused evaluation of exception types/messages/propagation and recovery behavior.
- Multi-file and multi-module contexts: the grammar shows a single CODE block; cross-file call stacks, relative/absolute breakpoints, and module resolution are not evaluated. How to handle multi-file projects and large codebases?
- Python-only scope: portability to other languages (e.g., Java, C/C++, TypeScript) with different debugging semantics remains untested. What language-agnostic abstractions of actions/states generalize?
- Dataset biases from trajectory generation: stochastic action policy and single-function entry sampling for repo traces may distort distributions of events and depths. What is their impact on generalization, and can ablations quantify it?
- Data contamination controls: with mixes including DCLM and GitHub code, contamination analysis for CruxEval and other benchmarks is not reported. How to ensure clean evaluation?
- Reproducibility and release: precise data mix ratios, repository lists, and model artifacts are not stated as publicly available. Will datasets, code, and models be released to enable verification and extension?
- Compute and latency characteristics: the “constant time” jump claim is not empirically benchmarked; training/inference costs, throughput, and latency vs. traditional debuggers are unreported.
- Environment determinism: sensitivity to Python versions, library versions, and platform differences is not studied. How robust are predictions across environments?
- Absence of semantic consistency guarantees: there are no checks that predicted states satisfy program semantics or invariants. Can hybrid methods (static analysis, constraint solvers) enforce consistency during decoding?
- Agentic integration not demonstrated: although positioned as a world model for coding agents, no closed-loop agent experiments or end-to-end debugging/fixing pipelines are shown.
- Privacy, security, and licensing risks: execution traces and serialized objects may contain secrets or proprietary data; mitigations, filtering, and licensing compliance are not discussed.
Practical Applications
Immediate Applications
The following use cases can be piloted now with the paper’s methods (neural debuggers trained on Python execution traces with step/ jump actions and inverse execution). Each item lists likely sectors, the product/workflow shape, and key dependencies.
- Neural debugger IDE extension for offline stepping and breakpoints
- Sectors: software, education
- What it enables: Step-into/over/return and line breakpoints on Python code without running it; inspect predicted locals and flows to localize bugs when runtimes or deps are missing.
- Tools/products: VS Code/JetBrains plugin using the model as a “simulation backend”; Debug Adapter Protocol (DAP) shim that routes actions to the neural debugger; CLI “ndebug” for headless use.
- Dependencies/assumptions: Python focus; accuracy on locals/events is high for short horizons but degrades with long jumps; 32B models are heavy (prefer 1.8B on-device for privacy, with quality trade-offs); requires robust serialization of locals; must present uncertainty and allow quick fallbacks to real execution.
- PR triage and code review assistant with speculative execution
- Sectors: software, enterprise IT
- What it enables: For each changed function, simulate key paths and predicted return values; surface likely failing cases, critical branches, and suggested breakpoints; summarize control-flow changes.
- Tools/products: GitHub/GitLab app that comments on PRs; “what changed in behavior” report powered by breakpoint and step_return predictions.
- Dependencies/assumptions: Works best on pure-Python, deterministic functions; must gate with confidence thresholds; integrate with CI secrets policy (no code/PII leaving org); legal/IP acceptance of training data.
- Unit-test input synthesis (inverse execution) for edge-case coverage
- Sectors: software testing/QA
- What it enables: Given a function and desired post-condition (e.g., return value, state), generate plausible inputs via inv_step_call; seed property-based testing (e.g., Hypothesis) and fuzzers.
- Tools/products: “TestSeeds” service that emits input dicts; integration with PyTest/Hypothesis to auto-extend test suites; mutation-testing booster.
- Dependencies/assumptions: Inverse prediction is one-to-many; must deduplicate/validate by actually running tests; ambiguity requires sampling and assert-based filtering; accuracy drops for long horizons.
- CI/CD fast prechecks when environments are unavailable or flaky
- Sectors: software/DevOps, regulated industries
- What it enables: Run simulated “smoke checks” on logic while containers/builds spin up; provide quick failure hypotheses and suggested breakpoints for later live reruns.
- Tools/products: CI step “simulate-return-values” for hot paths; dashboards showing predicted outcomes and confidence; flaky-test triage via predicted inputs.
- Dependencies/assumptions: Must flag approximation; integrate with later real runs; calibrate to avoid false confidence; track model drift.
- Security triage for untrusted or hard-to-run code (sandboxless preview)
- Sectors: cybersecurity, policy/public sector IT
- What it enables: Inspect likely code paths and outputs without executing untrusted code; generate inputs that may trigger exceptions or suspicious branches; prioritize manual review.
- Tools/products: “SafePreview” service for code attachments; SOC tooling plugin to summarize behavior; API stub that masks I/O and predicts states.
- Dependencies/assumptions: No true side-effect modeling yet (I/O simulated as tokens); handle adversarial code and serialization safely; avoid leaking secrets via repr(); human-in-the-loop recommended.
- Classroom/code-lab “execution tutor”
- Sectors: education (K–12, higher ed, bootcamps)
- What it enables: Interactive stepping with highlighted source lines and evolving locals; “explain next line” and “why did this value change?”; inverse mode to ask “what inputs yield X?”
- Tools/products: Web-based stepper for lessons and homework; LMS integration for auto-explanations; practice mode for CruxEval-style tasks.
- Dependencies/assumptions: Align with curricula; restrict to safe code; log predictions with rationales; surface confidence.
- Data science notebook assistant for logic debugging
- Sectors: data/ML engineering
- What it enables: Simulate function cells to preview transformations; propose breakpoints and sample inputs that reproduce observed anomalies.
- Tools/products: Jupyter/Lab plugin (“Simulate next cell”); Pandas pipeline assistants.
- Dependencies/assumptions: Large objects in locals need truncated serialization; downstream effects (file/DB) are not executed; human verification required.
- Offline API/dep stubber when resources are unavailable
- Sectors: software, cloud/DevOps
- What it enables: Predict return values at call sites to unavailable APIs; allow local reasoning and UI dev while backends are down.
- Tools/products: “Stub-by-Prediction” that annotates call sites with predicted returns; swagger-aware wrappers that route to neural debugger predictions.
- Dependencies/assumptions: Must tag predictions clearly; avoid using for correctness-critical flows; cache and invalidate as code evolves.
- Research tooling for execution-aware LLMs
- Sectors: academia
- What it enables: Benchmarks and datasets for forward/inverse execution; ablations on action policies; studying horizon effects and uncertainty calibration.
- Tools/products: Open prompts and trace-format libraries; evaluation harness for CruxEval-like tasks with debugger actions.
- Dependencies/assumptions: Access to trace corpora; reproducible training recipes; licensing clarity.
- Lightweight local model option for privacy-preserving scenarios
- Sectors: healthcare, finance, public sector
- What it enables: Run 1.8B model on secure workstations for on-prem debugging assistance where code/data cannot leave perimeter.
- Tools/products: Containerized service with no external calls; integration with enterprise IDEs.
- Dependencies/assumptions: Accept lower accuracy than 32B; careful PII handling in repr(); model updates via vetted channels only.
Long-Term Applications
These opportunities require further research, broader data coverage (beyond Python, with side effects), higher accuracy for long horizons, or deeper toolchain integration.
- Autonomous debugging agents that plan and interact with real debuggers
- Sectors: software, enterprise IT
- What it could enable: Agents that choose breakpoints/steps, run fix attempts, validate via tests, and iterate; combine neural “world model” with live DAP sessions.
- Potential products: “Autofix Bot” that isolates faults and proposes patches with step plans and confidence; continuous triage service.
- Dependencies/assumptions: Reliable long-horizon predictions; policy learning over actions; safe tool-use; guardrails against hallucinated states.
- Execution-aware code generation with planning and self-verification
- Sectors: software, platform teams
- What it could enable: Generators that simulate execution to guide design, pick breakpoints, and verify outputs before emitting code.
- Potential products: Spec-to-code systems with simulated test passes; planning-aware copilots.
- Dependencies/assumptions: Tight coupling between generator and debugger models; calibrated uncertainty; integration with unit tests.
- Cross-language neural debugger platform
- Sectors: software, robotics, embedded
- What it could enable: Extend to languages with tracing APIs (Java, C#) or via IRs (LLVM); unify step/jump semantics across languages.
- Potential products: Polyglot “Neural Debugger” suite; ROS node logic steppers; IaC (Terraform) plan simulators.
- Dependencies/assumptions: Language-specific trace collection; differences in concurrency/memory models; significant new datasets.
- OS, I/O, and API world-modeling for richer side effects
- Sectors: cloud/DevOps, cybersecurity, fintech/healthtech
- What it could enable: Simulate file/FS, network, and OS calls for richer “what-if” analysis; detect risky paths without running code.
- Potential products: “SystemCallSim” for pre-deployment risk scans; offline integration tests with high-fidelity stubs.
- Dependencies/assumptions: Data for syscalls/OS behaviors; modeling non-determinism; safety constraints to avoid misleading assurances.
- Speculative execution in CI for test selection and prioritization
- Sectors: software, large repos/monorepos
- What it could enable: Predict which tests and inputs are most likely to fail; run those first; reduce cycle time.
- Potential products: CI smart scheduler using predicted breakpoints and outcomes; flaky test isolation.
- Dependencies/assumptions: Strong correlation between simulated signals and real failures; feedback loops to retrain; governance for false positives.
- Program repair guided by inverse constraints
- Sectors: software maintenance
- What it could enable: Use inverse execution to propose inputs demonstrating regressions; synthesize patches that satisfy both forward and inverse constraints.
- Potential products: Constraint-driven auto-repair tools; “generate counterexample inputs” assistants.
- Dependencies/assumptions: Rich counterexample generation; solver integration; human approval workflow.
- Software “digital twins” for safety- and compliance-critical review
- Sectors: healthcare, finance, public sector, automotive
- What it could enable: Maintain a simulation twin of critical code to support audits, traceability, and impact analyses of changes without touching prod data.
- Potential products: Audit dashboards that replay hypothetical scenarios; change-impact risk scores.
- Dependencies/assumptions: High fidelity needed; formal methods or runtime validation to bound error; governance standards.
- Interactive reverse debugging with sampling of plausible histories
- Sectors: software, forensics
- What it could enable: Given a failure state, sample plausible prior states and inputs to reproduce it; accelerate bug reproduction and incident response.
- Potential products: “HistorySampler” for postmortems; log gap-filling assistants.
- Dependencies/assumptions: Ambiguity management and ranking; acceptance that outputs are hypotheses that require verification.
- Robotics and embedded logic rehearsal without hardware
- Sectors: robotics, IoT
- What it could enable: Offline rehearsal of control-node logic and event handling; suggest inputs/events leading to edge behaviors.
- Potential products: ROS/IoT simulators that plug into existing pipelines.
- Dependencies/assumptions: Real-time/concurrency not yet captured; multi-process/multi-thread traces required; hardware-in-the-loop remains necessary.
- Policy and standards for AI-assisted debugging and secure code evaluation
- Sectors: policy/regulation, enterprise governance
- What it could enable: Guidelines on acceptable use of simulated execution results; audit trails for AI debugging actions; procurement standards for on-prem deployment.
- Potential products: Compliance frameworks, certification for tool vendors.
- Dependencies/assumptions: Broad stakeholder consensus; evidence on efficacy and risk; privacy-preserving deployments.
- Developer analytics and onboarding accelerators
- Sectors: enterprise IT/HR/enablement
- What it could enable: Measure comprehension via simulated traces; personalized breakpoint-based walkthroughs for new services.
- Potential products: Onboarding portals with execution tours; skill diagnostics.
- Dependencies/assumptions: Ethical use of telemetry; opt-in and anonymization; validated correlations with productivity.
Notes on feasibility across all applications:
- Current strengths: Accurate source-line/event prediction; strong short-horizon performance; step actions easier than long jump actions.
- Current limits: Variable value prediction errors are common; accuracy decreases with prediction horizon; Python-only; side effects (I/O, network, OS) not truly executed; inverse execution is inherently ambiguous and needs sampling plus validation.
- Operational considerations: Model size vs latency/privacy trade-offs; integration with IDEs/CI via DAP/LSP and policy controls; clear UX to communicate uncertainty; ensure training data licensing and PII-safe serialization.
Glossary
- Abstract syntax tree: A tree-structured representation of source code produced by parsing before compilation or execution. "it is parsed into an abstract syntax tree and compiled into code objects,"
- Agentic coding systems: Automated or semi-automated coding setups where agents plan, act, and interact with tools to accomplish programming tasks. "future agentic coding systems in which neural debuggers serve as a world model for simulated debugging environments"
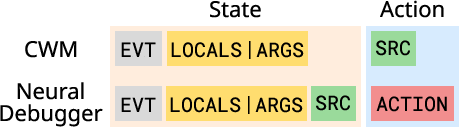
- ARGS: The serialized field in a debugger state holding return or exception arguments associated with an event. "every state contains an event type (EVT), local variables and their values (LOCALS) or arguments (ARGS), and the source line of the statement being executed (SRC)"
- Behavior cloning: A learning approach that mimics observed action sequences without explicit rewards, often used in imitation learning. "Although this setup superficially resembles behavior cloning or imitation learning"
- Breakpoint: A debugging control action that jumps execution to a specified source line. "breakpoint (jumps to a specified source line)"
- Bytecode: The low-level instruction format produced by compiling Python code objects, executed by the interpreter. "which contain the operations in the form of bytecode."
- Call stack: The runtime stack that tracks active function calls and where execution should resume after returns. "At runtime, computer programs maintain a call stack to store information about active subroutines,"
- Code objects: Compiled units (e.g., modules, functions) containing bytecode and metadata used by the Python interpreter. "it is parsed into an abstract syntax tree and compiled into code objects, which contain the operations in the form of bytecode."
- Code World Model (CWM): An open-weights LLM trained on Python execution traces to model line-by-line execution. "Code World Model (CWM) is the first open-weights LLM that has been trained on Python execution traces during mid-training at a large scale"
- Continue: A debugger action that advances execution until program termination, yielding an exit code. "continue: Outcome is the exit code."
- CruxEval: A benchmark for input–output prediction tasks on Python functions to assess code reasoning capabilities. "Evaluated on CruxEval, our models achieve strong performance on both output and input prediction tasks"
- Decoder-only Transformer: A Transformer architecture using only the autoregressive (decoder) stack for next-token prediction. "We train neural debugger models by finetuning and pre-training decoder-only Transformer LLMs"
- DCLM: A web data corpus used in LLM training mixes (DataCompLM), serving as general text training data. "web data from DCLM"
- Dense Transformer: A standard, non-sparse Transformer model where all layers are fully parameterized and active. "CWM is a \SI{32}{B} parameter dense Transformer LLM"
- Dynamic scratchpads: A tracing strategy where a model updates a single evolving scratch space to store intermediate computations. "Their proposed dynamic scratchpads, in which the model updates a single self-contained scratchpad instance,"
- Exact-match accuracy: A metric that counts a prediction as correct only if it matches the reference exactly. "We report exact-match accuracy between model predictions (with greedy decoding) and ground-truth program states."
- Evaluation loop: The interpreter’s main loop that executes bytecode instructions from code objects. "The code objects are executed in Python's evaluation loop,"
- EVT: The event-type field in a debugger state indicating the kind of runtime event (line, call, return, exception). "every state contains an event type (EVT), local variables and their values (LOCALS) or arguments (ARGS), and the source line of the statement being executed (SRC)"
- Exit code: The program’s termination status (e.g., normal, error), often produced after a continue action. "continue: Outcome is the exit code."
- Forward execution: Predicting future program states and outputs given current state and actions. "model both forward execution (predicting future states and outputs)"
- Frame object: A Python runtime structure holding local/global variables, the current code object, and execution context. "Each frame object contains local and global variables and the code object,"
- Fuzzing: Automated testing that generates many (often random) inputs to expose faults or edge cases. "such as fuzzing,"
- Graph Neural Network: A neural architecture operating on graph-structured data, used here to analyze code and errors. "train a Graph Neural Network on this dataset to predict statically whether a program will encounter a runtime error"
- Greedy decoding: A decoding method that selects the highest-probability token at each step without sampling. "with greedy decoding"
- Imitation learning: Learning to act by copying behavior from observed trajectories rather than optimizing a reward. "behavior cloning or imitation learning"
- Inverse execution: Inferring plausible prior program states or inputs that could have produced a given state. "inverse execution (inferring prior states or inputs)"
- inv_step_call: An inverse debugging action that directly predicts the input arguments of a function call. "step_return action is repurposed as inv_step_call, which directly predicts a functionâs input arguments."
- inv_step_over: An inverse debugging action that moves to the previous relevant state without descending into a prior call. "whether an inv_step_into or inv_step_over action is executed"
- Linear warmup: A learning rate schedule that increases linearly at the start of training before switching to another schedule. "using a linear warmup and a cosine learning rate decay schedule"
- LOCALS: The serialized dictionary of local variables included in a debugger state. "local variable dictionaries (LOCALS)"
- Markov Decision Process (MDP): A formal framework modeling states, actions, and transitions for decision-making over time. "introducing neural debuggers as a Markov Decision Process (MDP)"
- Mid-training: An intermediate training phase in an LLM’s lifecycle where specialized data (e.g., traces) is introduced. "during mid-training at a large scale"
- Neural debugger: A LLM that simulates and controls program execution via debugger-like actions. "we introduce neural debuggers: LLMs that emulate traditional debuggers,"
- Neural interpreter: A LLM trained to predict program execution step by step like an interpreter. "effectively turning them into neural interpreters"
- Observation–action pairs: A sequence format where observed states are paired with actions, used to represent execution traces. "formatted as sequences of observation-action pairs conditioned on the code that has been executed."
- Pass@1: The probability that the top (single) generated answer solves the task or matches a correctness criterion. "attains CruxEval input and output pass@1 scores of \SI{53.6}{} and \SI{57.7}{}, respectively,"
- Pre-training: Large-scale initial training on broad data before specialization or fine-tuning. "pre-train smaller Transformer models on \SI{50}{B} and \SI{150}{B} tokens"
- Reverse debuggers: Tools that support stepping backward through previously executed traces. "Unlike reverse debuggers, which allow backward stepping only after a forward execution has been performed"
- Scratchpad tracing: A method where models write out intermediate computations and visited lines during execution. "They refer to this approach as \enquote{scratchpad tracing},"
- SRC: The source line field in a debugger state indicating which line is being executed. "every state contains an event type (EVT), local variables and their values (LOCALS) or arguments (ARGS), and the source line of the statement being executed (SRC)"
- State tree: A tree structure organizing execution states (by calls and returns) to define debugger transitions. "we construct a state tree (Section~\ref{sec:debugger_mdp}) from frame events"
- Step_into: A step action that moves into the next statement, descending into called functions. "step_into: The target node is the immediate next node."
- Step_over: A step action that advances to the next statement at the current stack depth, skipping over calls. "step_over: The target node is the next node at the current level."
- Step_return: A jump action that advances to the return point of the current function. "step_return: The target node is the return node with the return event at the current level,"
- Stochastic policy: A probabilistic action-selection mechanism used to sample diverse debugger trajectories. "we employ a stochastic policy composed of mixed categorical distributions"
- sys.settrace: A Python API to register a trace function that observes runtime events and frames. "via sys.settrace(tracefunc)"
- Top-p: Nucleus sampling parameter that restricts sampling to the smallest set of tokens whose probabilities sum to p. "top-p 0.95."
- Transition model: The set of rules mapping actions and current states to next states; here, defined as tree traversal. "Transition model. We visualize the state transitions as traversal on the forward and inverse state tree."
- World model: A learned model that simulates environment dynamics for planning or interaction. "serve as a world model for simulated debugging environments"
Collections
Sign up for free to add this paper to one or more collections.