Improving Human Verification of LLM Reasoning through Interactive Explanation Interfaces
Abstract: The reasoning capabilities of LLMs have led to their increasing employment in several critical applications, particularly education, where they support problem-solving, tutoring, and personalized study. While there are a plethora of works showing the effectiveness of LLMs in generating step-by-step solutions through chain-of-thought (CoT) reasoning on reasoning benchmarks, little is understood about whether the generated CoT is helpful for end-users in improving their ability to comprehend mathematical reasoning problems and detect errors/hallucinations in LLM-generated solutions. To address this gap and contribute to understanding how reasoning can improve human-AI interaction, we present three new interactive reasoning interfaces: interactive CoT (iCoT), interactive Program-of-Thought (iPoT), and interactive Graph (iGraph), and a novel framework that generates the LLM's reasoning from traditional CoT to alternative, interactive formats. Across 125 participants, we found that interactive interfaces significantly improved performance. Specifically, the iGraph interface yielded the highest clarity and error detection rate (85.6%), followed by iPoT (82.5%), iCoT (80.6%), all outperforming standard CoT (73.5%). Interactive interfaces also led to faster response times, where participants using iGraph were fastest (57.9 secs), compared to iCoT and iPoT (60 secs), and the standard CoT baseline (64.7 secs). Furthermore, participants preferred the iGraph reasoning interface, citing its superior ability to enable users to follow the LLM's reasoning process. We discuss the implications of these results and provide recommendations for the future design of reasoning models.
Paper Prompts
Sign up for free to create and run prompts on this paper using GPT-5.
Top Community Prompts
Explain it Like I'm 14
Overview
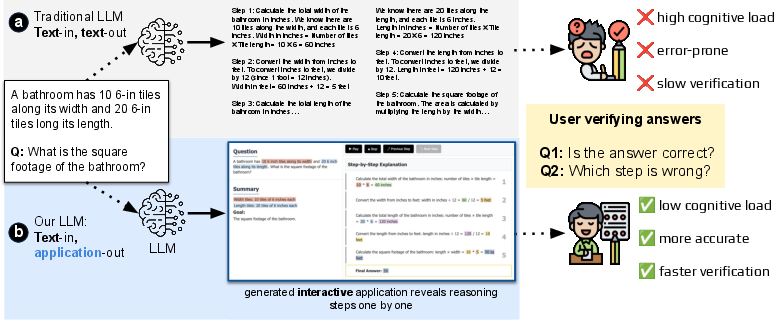
This paper looks at a simple idea: when an AI explains how it solved a math problem, the way that explanation is shown to you matters. Instead of giving a long wall of text, the researchers built interactive, easier-to-follow explanation styles. They tested whether these new styles help people understand the math and catch mistakes faster and more accurately.
Key Questions
The study asked three main questions in easy terms:
- Do interactive explanations help people judge whether the AI’s solution is right or wrong?
- Do these explanations help people find exactly where a mistake happens?
- Do people prefer these interactive formats over plain text explanations?
What Did They Build?
The team created three interactive ways to show the AI’s step-by-step reasoning, plus a standard text-only version to compare against.
Here are the three interactive formats:
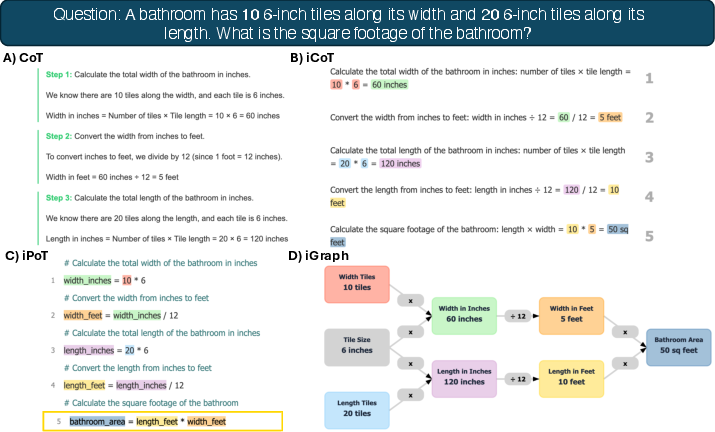
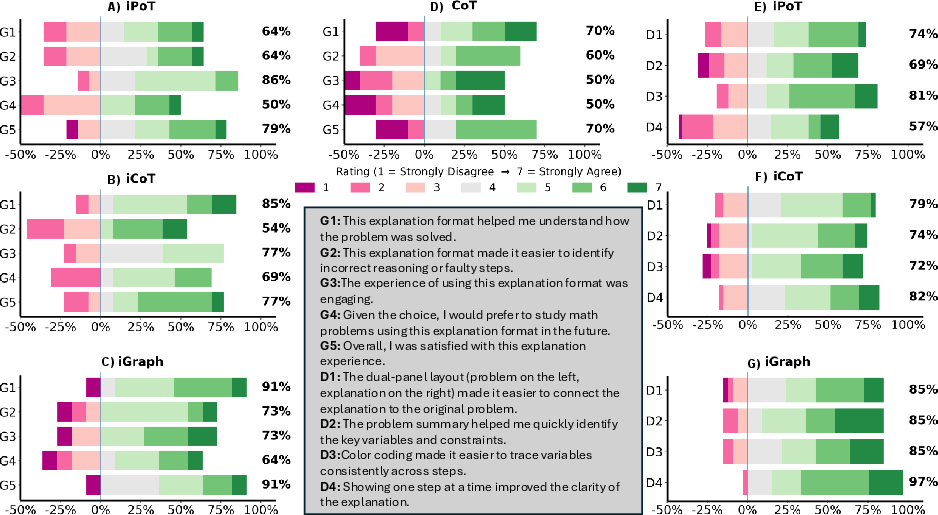
- Interactive Chain-of-Thought (iCoT): Still text, but broken into clear steps with highlights and “next/previous” buttons, so you can move one step at a time.
- Interactive Program-of-Thought (iPoT): The reasoning looks like simple code, with variables and calculations shown line by line—like following a recipe where each ingredient and step is tracked.
- Interactive Graph (iGraph): A flowchart with boxes and arrows that shows how each step leads to the next—like a map of the solution.
All interfaces also used helpful features:
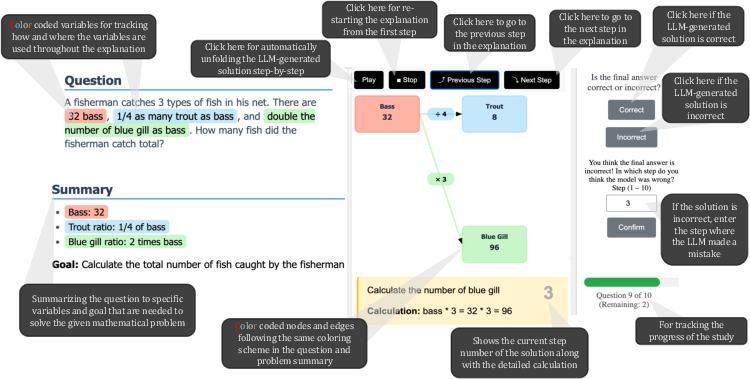
- A dual panel: the problem on the left, the explanation on the right.
- A short problem summary with key numbers and variables.
- Consistent colors for variables (for example, the same color for “apples” wherever they appear).
- Buttons to move through steps at your own pace.
How Did They Test It?
Think of the test like a quiz game:
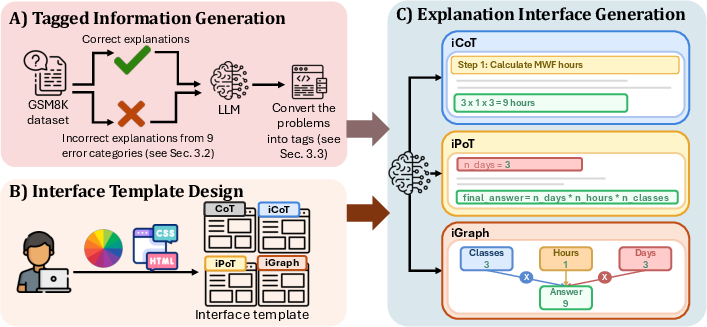
- They took real grade-school math word problems (from a dataset called GSM8K).
- They created explanations that were sometimes correct and sometimes had a planted error (like a wrong calculation or missing step).
- 125 participants reviewed 10 explanations in one of the four formats (standard text, iCoT, iPoT, or iGraph).
- For each explanation, participants had to decide if it was correct. If it wasn’t, they had to point to the exact step where the mistake happened.
- The system recorded accuracy, how fast people answered, and how they clicked through the explanations.
- Afterward, participants rated how clear, helpful, and engaging the format felt.
In everyday terms: the researchers didn’t just check if people could say “right or wrong”—they also checked if people could point out the exact spot where things went wrong, and how quickly and confidently they did it.
Main Results
Here are the key findings:
- Accuracy improved with interactivity:
- iGraph had the highest error-checking accuracy: about 85.6%.
- iPoT: about 82.5%.
- iCoT: about 80.6%.
- Standard text (plain Chain-of-Thought): about 73.5%.
- Finding the exact mistake was easier with interactive formats:
- iGraph again led the pack for pinpointing the wrong step.
- People were a bit faster with interactive formats:
- iGraph was the fastest on average (about 57.9 seconds per question) compared to standard text (about 64.7 seconds).
- People preferred iGraph:
- Participants said iGraph made the reasoning easiest to follow.
- Design features like the dual panel, problem summary, color-coding, and step-by-step controls were rated as helpful.
Why this matters: seeing the reasoning in a structured, interactive way—like a flowchart or simple program—helps people understand and verify the AI’s work more effectively than reading long paragraphs.
Why It Matters
This research shows that explanations should be designed for humans, not just generated by AI. Better explanation interfaces can:
- Help students and teachers check math solutions more accurately and quickly.
- Reduce confusion when AI makes subtle mistakes.
- Build trust by making it easier to spot errors instead of just believing the AI.
- Support safer, more reliable use of AI in classrooms and learning tools.
Takeaway
If you want people to understand and double-check an AI’s reasoning, don’t just show a long block of text. Present the thinking as interactive steps, a simple code-like process, or a visual flowchart. These designs make it easier to follow the logic, find mistakes, and feel confident about the result. The iGraph (flowchart) format worked best overall in this study.
Knowledge Gaps
Knowledge gaps, limitations, and open questions
Below is a focused list of what remains missing, uncertain, or unexplored in the paper, framed to inform concrete next steps for future research.
- External validity beyond GSM8K math: unknown whether the benefits of iCoT/iPoT/iGraph transfer to other domains (e.g., coding, scientific proofs, legal/medical reasoning, commonsense tasks), multimodal problems, or open-ended writing.
- Participant population bias: results are from 125 undergraduates at two U.S. universities; no evaluation with K–12 learners, teachers, tutors, professionals, or non-U.S./non-English populations.
- Expertise and background effects: no analysis of how math proficiency, programming literacy (critical for iPoT), or prior exposure to LLMs moderates the interface effects.
- Accessibility and inclusivity: color-coding and graph visuals were not tested for color-vision deficiencies, screen-reader compatibility, or broader accessibility needs; mobile-responsiveness and small-screen usability are unassessed.
- Ecological validity: lab-style, single-session setting may not reflect real study/tutoring contexts with time pressure, distractions, or integration into curricula and LMSs.
- Learning outcomes: no measurement of long-term learning gains, transfer to new problems, or retention; unclear whether these interfaces help users solve future problems without AI.
- Trust calibration and reliance: user trust, over-/under-reliance, and calibration were not directly measured (e.g., confidence ratings, automation bias); only preference and satisfaction were captured.
- Cognitive load measurement: cognitive load is inferred from time; standardized metrics (e.g., NASA-TLX), eye-tracking, or physiological measures were not used to substantiate reduced mental effort.
- Natural vs injected errors: explanations contained one injected error from a taxonomy; external validity to naturally occurring, multi-error, or subtle/ambiguous model failures is unknown.
- Error-type sensitivity: no breakdown of accuracy/time by error category (e.g., calculation vs context vs unit conversion) to identify which formats help for which error types.
- Base-rate imbalance: each participant saw 9 incorrect and 1 correct explanation, which may bias toward “incorrect” judgments; impact of different correct/incorrect ratios is untested.
- Item effects and counterbalancing: it is unclear whether the same problems were counterbalanced across conditions; without an item-wise mixed-effects model, interface effects may be confounded by problem difficulty.
- Statistical modeling: nonparametric group tests were used, but hierarchical mixed-effects models (participant- and item-level random effects) would better isolate interface effects and increase power.
- Feature-level causal attribution: although feature questionnaires were collected, there was no ablation or factorial design to causally identify which components (dual-panel, summary, color-coding, playback) drive the gains.
- Cross-format content fidelity: the tagging-to-template pipeline assumes equivalence of content across formats; no human or automated audit quantified fidelity, consistency, or leakage of format-specific cues.
- Tagging reliability: LLM-generated tags (facts, steps, formulas, wrongstep) were not validated for accuracy/consistency; inter-annotator agreement or gold-tag comparisons are missing.
- Model dependence: all explanations used Claude 3.7 Sonnet; sensitivity to different models (GPT-4o, Llama, Mistral), prompting styles (few-shot, self-consistency), or solution quality is untested.
- Scale and complexity limits: GSM8K has mostly linear, short chains; performance on longer, branching, or cyclic reasoning (proofs, program traces) and dense graphs remains unknown.
- Real-time, editable interaction: users could not query/modify reasoning or request alternative paths; whether editable, conversational, or what-if interactions further improve verification is open.
- Correction workflow: the study measured error detection/localization but not whether interfaces help users correct the reasoning or guide the model to a correct revised solution.
- Engagement vs accuracy trade-offs: iPoT scored high on engagement but had mixed step-by-step ratings; systematic analysis of when engagement translates (or not) to accuracy is missing.
- Interaction log analysis: clickstream data were collected but not analyzed; linking interaction patterns (e.g., step-backs, dwell time per node) to success/failure could inform design guidelines.
- Response-time interpretation: time differences were not statistically significant; more trials per participant and within-subject designs could clarify speed-accuracy trade-offs.
- Multiple errors and uncertainty: only single-error cases were tested; how interfaces support detection of multiple simultaneous errors and communicate uncertainty/confidence is untested.
- Robustness to adversarial or misleading presentations: whether certain visual structures (e.g., neat graphs) induce overtrust when the logic is wrong was not assessed.
- Fairness and subgroup analysis: no reporting by demographic subgroups; potential disparate benefits/harms (e.g., novices vs advanced students) remain unknown.
- Security/operational risks: the approach generates and serves LLM-produced HTML/JS; potential security, sandboxing, and content-safety concerns are not discussed.
- Deployment and cost: latency, compute cost, and maintainability of the two-stage LLM pipeline for large-scale classroom use were not evaluated.
- Baselines: comparison excludes alternative strong baselines (e.g., numbered/bulleted CoT, tabular step lists, structured outlines, Tree-of-Thought views, verified/tool-augmented CoT).
- Device and context variability: performance on mobile devices, tablets, or low-bandwidth environments was not studied.
- Pre-registration and reproducibility: analyses were not described as pre-registered; open materials exist on Hugging Face, but full data, code, and detailed protocols for exact replication are not fully documented in the paper.
- Ethical considerations in education: impacts on grading, academic integrity, and students’ independent reasoning skills over time were not examined.
Practical Applications
Immediate Applications
The following applications can be deployed now using the paper’s interfaces (iCoT, iPoT, iGraph), tagging schema, templates, and implementation details (HTML/JS generation, HuggingFace hosting), with minimal adaptation beyond math-like, stepwise reasoning tasks.
- EdTech: interactive math tutoring and homework verification
- Sector: Education
- Use case: Integrate iGraph/iCoT into tutoring apps and LMS (Canvas, Google Classroom) so students can step through solutions, detect errors at specific steps, and build reasoning skills.
- Tools/products/workflows: “Interactive Reasoning Viewer” component library; dual-panel layout with color-coded variables and step playback; teacher dashboards to review student reasoning and error localization; automated grading that checks correctness plus the identified error step.
- Assumptions/dependencies: Access to LLM CoT outputs; tasks are structured, multi-step problems (e.g., GSM8K-like); fidelity of interfaces to actual reasoning; basic visual/UI literacy for students.
- University instruction and assessment
- Sector: Academia
- Use case: Instructors and TAs use iGraph/iPoT to demonstrate worked examples in lectures and to assess whether students can verify solutions and pinpoint faulty steps.
- Tools/products/workflows: In-class interactive reasoning demos; homework portals that require students to mark incorrect steps; error-injection practice sets aligned with the paper’s taxonomy (CA, CO, CV, CS, MS, HA, UC, OP, FC) to train error-spotting skills.
- Assumptions/dependencies: Course content includes multi-step quantitative reasoning; availability of pre-generated interfaces via HuggingFace or similar hosting; accessibility accommodations for color usage.
- Software engineering assistants with step-through “reasoning debugger”
- Sector: Software
- Use case: Wrap LLM planning/output in iPoT (code-like pseudo-steps) so developers can step through plans, see variable updates, and detect flawed logic before code execution.
- Tools/products/workflows: IDE plugin for VS Code/JetBrains providing a “Reasoning Debugger” pane (step forward/back, variable watch, plan graph); logs of verification actions for traceability.
- Assumptions/dependencies: LLM can produce faithful PoT-style steps; mapping from natural language plans to pseudo-code steps is accurate; developers accept overhead for verification.
- Customer support and knowledge work quality control
- Sector: Software/Enterprise
- Use case: Analysts verify LLM-generated responses to complex policy or billing questions using iCoT/iGraph to reduce cognitive load and catch subtle mistakes.
- Tools/products/workflows: Internal “Verification Panel” that requires step-level review and acceptance before sending answers to customers; click-history logs to audit what was reviewed.
- Assumptions/dependencies: The tasks break down into discrete steps; staff training on reading structured graphs/code-like steps; model outputs are accessible for transformation.
- Internal AI output auditing and compliance dashboards
- Sector: Finance, Insurance, Enterprise Risk
- Use case: Risk teams use interactive interfaces to audit LLM decisions (e.g., pricing calculations, eligibility checks), improving error detection and transparency.
- Tools/products/workflows: Reasoning audit dashboards built on iGraph; error localization metrics and response-time logs; storage of annotated decisions for audit trails.
- Assumptions/dependencies: Availability of stepwise reasoning traces; legal/privacy compliance for storing reasoning logs; organizational willingness to include human-in-the-loop checks.
- Healthcare education (non-clinical decision support)
- Sector: Healthcare education
- Use case: Nursing/pharmacy programs use iGraph to teach dosage and unit conversions, with explicit step verification and error-type drills (e.g., Unit Conversion, Calculation).
- Tools/products/workflows: Interactive worked examples; quizzes requiring wrong-step identification; curricular modules leveraging the error taxonomy.
- Assumptions/dependencies: Constrained to educational contexts, not clinical decision-making; content validated by domain experts; careful handling of units and safety-critical steps.
- Consumer calculators with transparent logic
- Sector: Daily life/Finance
- Use case: Personal budgeting, loan amortization, or tax estimation tools show iGraph reasoning, enabling users to inspect each step and catch mistakes (e.g., operator or unit errors).
- Tools/products/workflows: Browser-based calculators with iGraph; step-level highlights and summaries; “show me where the math could go wrong” feature using error templates.
- Assumptions/dependencies: Tasks are numeric and stepwise; users comfortable with simple interactive UIs; accurate mapping from formulas to visual nodes.
- Browser extension to convert CoT into interactive explanations
- Sector: Software
- Use case: Users of ChatGPT/Claude can render long CoT outputs as iCoT/iPoT/iGraph for faster verification and lower cognitive load.
- Tools/products/workflows: Extension that applies the paper’s tagging schema and templates to LLM outputs; local HTML/JS rendering; optional cloud-based storage for audit.
- Assumptions/dependencies: Access to CoT; safe HTML/JS generation; correct tagging from free-form text; content security policies.
- Human-centered evaluation harness for XAI UX teams
- Sector: Software/UX Research
- Use case: Product teams measure verification accuracy, error localization, time-on-task, and interaction behavior using the paper’s metrics and error-injection taxonomy.
- Tools/products/workflows: Experiment wrapper and data logging (JSON logs; click histories); internal benchmark suite for explanation format A/B testing; survey templates for clarity/usability.
- Assumptions/dependencies: Representative users; ethical consent processes; domain adaptation of error types beyond math.
Long-Term Applications
These applications require further research, scaling, validation, cross-domain generalization, or regulatory alignment before deployment.
- Regulatory guidance: standardized “interactive verification” requirements for high-stakes AI
- Sector: Policy/Regulation
- Use case: Procurement and compliance frameworks recommend or require interactive reasoning UIs (step-level verification, audit logs) for AI used in finance, healthcare, public services.
- Tools/products/workflows: Policy templates; certification checklists; audit tools integrating error localization metrics and interaction logs.
- Assumptions/dependencies: Evidence that interactive formats improve outcomes beyond math; cross-domain studies; alignment with privacy/security standards and accessibility norms.
- Clinical decision support with verified reasoning traces
- Sector: Healthcare
- Use case: Clinicians review diagnostic or treatment plans using iGraph, verifying each step and data linkage before acting.
- Tools/products/workflows: EHR-integrated “Reasoning Viewer”; step-level sign-off; escalation workflows for uncertain steps; provenance tracking and data linking.
- Assumptions/dependencies: High-fidelity, domain-specific reasoning; rigorous validation and bias analysis; integration with EHR systems; regulatory approvals; medical liability considerations.
- Transparent robo-advisors and wealth management
- Sector: Finance
- Use case: Advisors and clients inspect recommendation logic (risk calculations, portfolio shifts) in iGraph; regulators audit stepwise reasoning for suitability/fiduciary standards.
- Tools/products/workflows: Client-facing interactive reports; compliance dashboards capturing verification actions; standardized taxonomies for financial errors.
- Assumptions/dependencies: Reliable financial reasoning beyond arithmetic; user education; auditability across heterogeneous data sources; robust model governance.
- Legal drafting and argument mapping
- Sector: Legal
- Use case: Lawyers visualize argument chains (precedents, facts, inferences) as graphs to verify logical consistency and detect contradictions or missing steps.
- Tools/products/workflows: iGraph adapted to legal reasoning (nodes = claims, evidence; edges = inferences); link-outs to sources; step-level peer review and citation checks.
- Assumptions/dependencies: Faithful mapping from text to structured argument graphs; domain-specific tagging schema; handling ambiguity and qualitative judgments.
- Robotics and autonomous systems planning verification
- Sector: Robotics
- Use case: Engineers and safety officers verify LLM-based planning steps (perception → planning → control) via iPoT/iGraph before deployment or during simulation.
- Tools/products/workflows: Planning trace viewer; simulation-integrated step-through; anomaly detection for incorrect operators or missing steps.
- Assumptions/dependencies: Accurate stepwise plans linked to sensor data; timing/real-time constraints; formal verification ties to planning graphs; safety certification paths.
- Enterprise decision-gating with human-in-the-loop verification
- Sector: Enterprise Software/Risk/Governance
- Use case: SOPs include a “two-person rule” where one generates a decision, and another verifies step-level reasoning via iGraph before execution (e.g., pricing, approvals).
- Tools/products/workflows: Workflow orchestration integrating interactive verification steps; audit logs with error localization; escalation and override controls.
- Assumptions/dependencies: Cultural adoption; throughput trade-offs; clear accountability; integration with existing BPM tools.
- Curriculum and assessment reform at scale
- Sector: Education policy
- Use case: Standardized tests and national curricula incorporate interactive reasoning tasks where students must verify and localize errors, not just give final answers.
- Tools/products/workflows: Digital assessment platforms with iCoT/iGraph; scoring rubrics for verification and localization; teacher training modules.
- Assumptions/dependencies: Infrastructure for equitable access; psychometric validation; accessibility for diverse learners; teacher professional development.
- Training and fine-tuning LLMs for faithful, verifiable reasoning
- Sector: AI/ML Research
- Use case: Use the paper’s tagging schema and error-injection taxonomy to train models that produce structured, interactive-ready reasoning traces with higher faithfulness.
- Tools/products/workflows: Datasets with tagged steps and synthetic errors; fidelity evaluation pipelines; loss functions encouraging step-level consistency and verifiability.
- Assumptions/dependencies: Stable correlation between interactive formats and faithfulness; methods to penalize hallucinated steps; cross-domain generalization.
- Commercial platforms and APIs for “Reasoning as a Service”
- Sector: Software
- Use case: SaaS APIs that take any LLM explanation and return iCoT/iPoT/iGraph artifacts with verification hooks and logging for governance.
- Tools/products/workflows: Rendering SDKs; multi-tenant governance dashboards; connectors for chat platforms, IDEs, LMSs; enterprise SSO and data residency options.
- Assumptions/dependencies: Secure, reliable HTML/JS rendering; model-agnostic tagging; performance and cost optimization; privacy-by-design and SOC2/ISO compliance.
Cross-cutting assumptions and dependencies
- Faithfulness: Interactive formats must faithfully reflect the model’s actual reasoning; otherwise they may create a false sense of trust.
- Generalization: The study’s gains (e.g., iGraph verification accuracy ≈ 85.6%, faster mean response times) were observed on GSM8K-style math with injected errors; replication is needed in other domains and with naturally occurring errors.
- Access to reasoning traces: Many deployments require access to CoT or structured steps, which may be restricted by providers or disabled for safety reasons.
- UI and accessibility: Color coding, dual panels, and step controls must be accessible (contrast, screen readers, keyboard navigation).
- Training and change management: Users need brief training to interpret graphs or pseudo-code; organizations must adapt workflows to include verification stages.
- Security and privacy: Rendering HTML/JS from LLM outputs must follow strict content security policies; audit logs may contain sensitive data requiring governance.
- Throughput and cost: Generating and verifying stepwise reasoning may add latency and cost; optimization and selective gating (only for high-risk tasks) may be necessary.
Glossary
- Between-subjects design: An experimental setup where different groups of participants are exposed to different conditions, with each participant experiencing only one condition. "The study follows a between-subjects design, where each participant was randomly assigned to one of four interface formats (CoT, iCoT, iPoT, or iGraph)."
- Bonferroni correction: A statistical adjustment used to counteract the problem of multiple comparisons by making significance thresholds more stringent. "with Bonferroni correction to account for multiple comparisons."
- Chain-of-Thought (CoT) prompting: A technique that elicits step-by-step intermediate reasoning from LLMs to improve performance on complex tasks. "chain-of-thought (CoT) prompting"
- Cognitive engagement: The degree of mental effort and involvement a user invests in a task or learning activity. "increase learners' focus and cognitive engagement without introducing cognitive load"
- Cognitive load: The amount of working memory resources required to process information or perform a task. "reduce the cognitive load of users."
- Controlled user study: A structured experiment with predefined procedures and conditions to systematically evaluate user behavior or system performance. "we conducted a controlled user study"
- Dual-Panel Layout: A UI design that displays two synchronized panels (e.g., problem and explanation) side-by-side to reduce context switching. "Dual-Panel Layout"
- Explainable AI (XAI): A field focused on making AI systems' decisions and behaviors understandable to humans. "the explainable AI (XAI) literature"
- GSM8K: A benchmark dataset of grade-school math word problems designed to evaluate multi-step reasoning. "GSM8K, a multi-step mathematical reasoning benchmark."
- Human-centered explainability: An approach to AI explanation design that prioritizes users’ needs, interpretability, and practical utility. "human-centered explainability"
- Interactive Chain-of-Thought (iCoT): An explanation format that preserves text reasoning while adding interactive elements like step controls and highlights. "Interactive Chain-of-Thought (iCoT)"
- Interactive Graph (iGraph): A visual explanation format that presents reasoning as nodes and edges to show logical flow. "Interactive Graph (iGraph) renders reasoning as a node-link diagram"
- Interactive machine learning: Systems where users can interactively guide, query, or correct machine learning models and their explanations. "interactive machine learning"
- Interactive Program-of-Thought (iPoT): A code-like explanation format representing reasoning as stepwise pseudo-code with variable updates. "Interactive Program-of-Thought (iPoT) shows explanations in a structured, code-like format"
- Intermediate representation: A structured, tagged form of content used to consistently render multiple interface formats from the same underlying reasoning. "tagged intermediate representation"
- KruskalâWallis ANOVA: A nonparametric statistical test for comparing medians across three or more groups. "A KruskalâWallis ANOVA is conducted to examine whether verification accuracy differed significantly across the four explanation formats (CoT, iCoT, iPoT, and iGraph)."
- Likert scale: A psychometric scale commonly used in questionnaires to measure attitudes or perceptions across ordered response options. "7-point Likert scale (1 = Strongly Disagree, 7 = Strongly Agree)"
- MannâWhitney U test: A nonparametric test used to compare differences between two independent groups when the dependent variable is ordinal or not normally distributed. "MannâWhitney U tests"
- Node-link diagram: A visual representation where entities (nodes) are connected by relationships (links/edges), commonly used to depict graphs. "node-link diagram"
- “Program of Thoughts Prompting”: A prompting framework that structures reasoning as executable or pseudo-code-like programs to improve interpretability and consistency. "âProgram of Thoughts Promptingâ framework"
- Progressive disclosure: A design principle that gradually reveals information to reduce overload and aid comprehension. "principle of progressive disclosure"
- Tagging schema: A structured set of tags used to annotate elements of problems and explanations (e.g., facts, steps, formulas) for consistent rendering. "This tagging schema allows us to separate independent information."
- Taxonomy: A systematic classification scheme; in this context, categorizing error types for controlled evaluation. "we adopt a taxonomy of nine error categories"
- Trust calibration: The process of aligning users’ trust in AI systems with the systems’ actual reliability and limitations. "trust calibration"
- Verification accuracy: A measure of how accurately users can judge whether an explanation or solution is correct. "verification accuracy"
Collections
Sign up for free to add this paper to one or more collections.