- The paper presents the Variational Mixture Graph Autoencoder (VMGAE) that leverages Gaussian mixture embeddings to improve clustering of time series data.
- It constructs graphs from time series using Weighted DTW and employs GCN layers to learn robust, temporally-aware embeddings.
- Empirical results demonstrate that VMGAE outperforms state-of-the-art methods in metrics like NMI and RI, with strong implications for finance and other domains.
Clustering Time Series Data with Gaussian Mixture Embeddings in a Graph Autoencoder Framework
The paper "Clustering Time Series Data with Gaussian Mixture Embeddings in a Graph Autoencoder Framework" (2411.16972) presents a novel methodology for clustering time series data using graph-based approaches, particularly leveraging the benefits of the Variational Mixture Graph Autoencoder (VMGAE). This method addresses the inherent complexity of temporal dependencies in time series data by using graph structures and improves clustering accuracy by producing Gaussian mixture embeddings.
Introduction and Motivation
Time series analysis is critical in various domains like finance, healthcare, and environmental monitoring. Traditional clustering techniques struggle with time series data due to the complex temporal dependencies and varying dimensional properties across different fields. The VMGAE introduces a graph-based approach utilizing the structural advantages of graphs to capture enriched data relationships, effectively addressing the shortcomings of conventional methods. This paper proposes turning time series data into graph representations, hence providing enriched embeddings that improve separability.
Graph Construction and Methodology
The key innovation of VMGAE lies in its graph construction from time series data using Weighted Dynamic Time Warping (WDTW), which captures relationships between individual sequences. The process involves converting the distance matrix obtained from WDTW into a similarity matrix to form graph structures, ensuring better representations of time dependencies.
The methodology follows two main steps:
- Graph Construction: Each time series is represented as a node. The adjacency matrix is constructed based on distances computed using WDTW, followed by a novel approach to transform these into similarity scores, fixing density rates to compute thresholds dynamically.
- Learning Representations: A graph convolutional autoencoder architecture processes this graph to learn embeddings. It uses a mixture of Gaussians in its latent space, enhancing clustering performance through better representation.
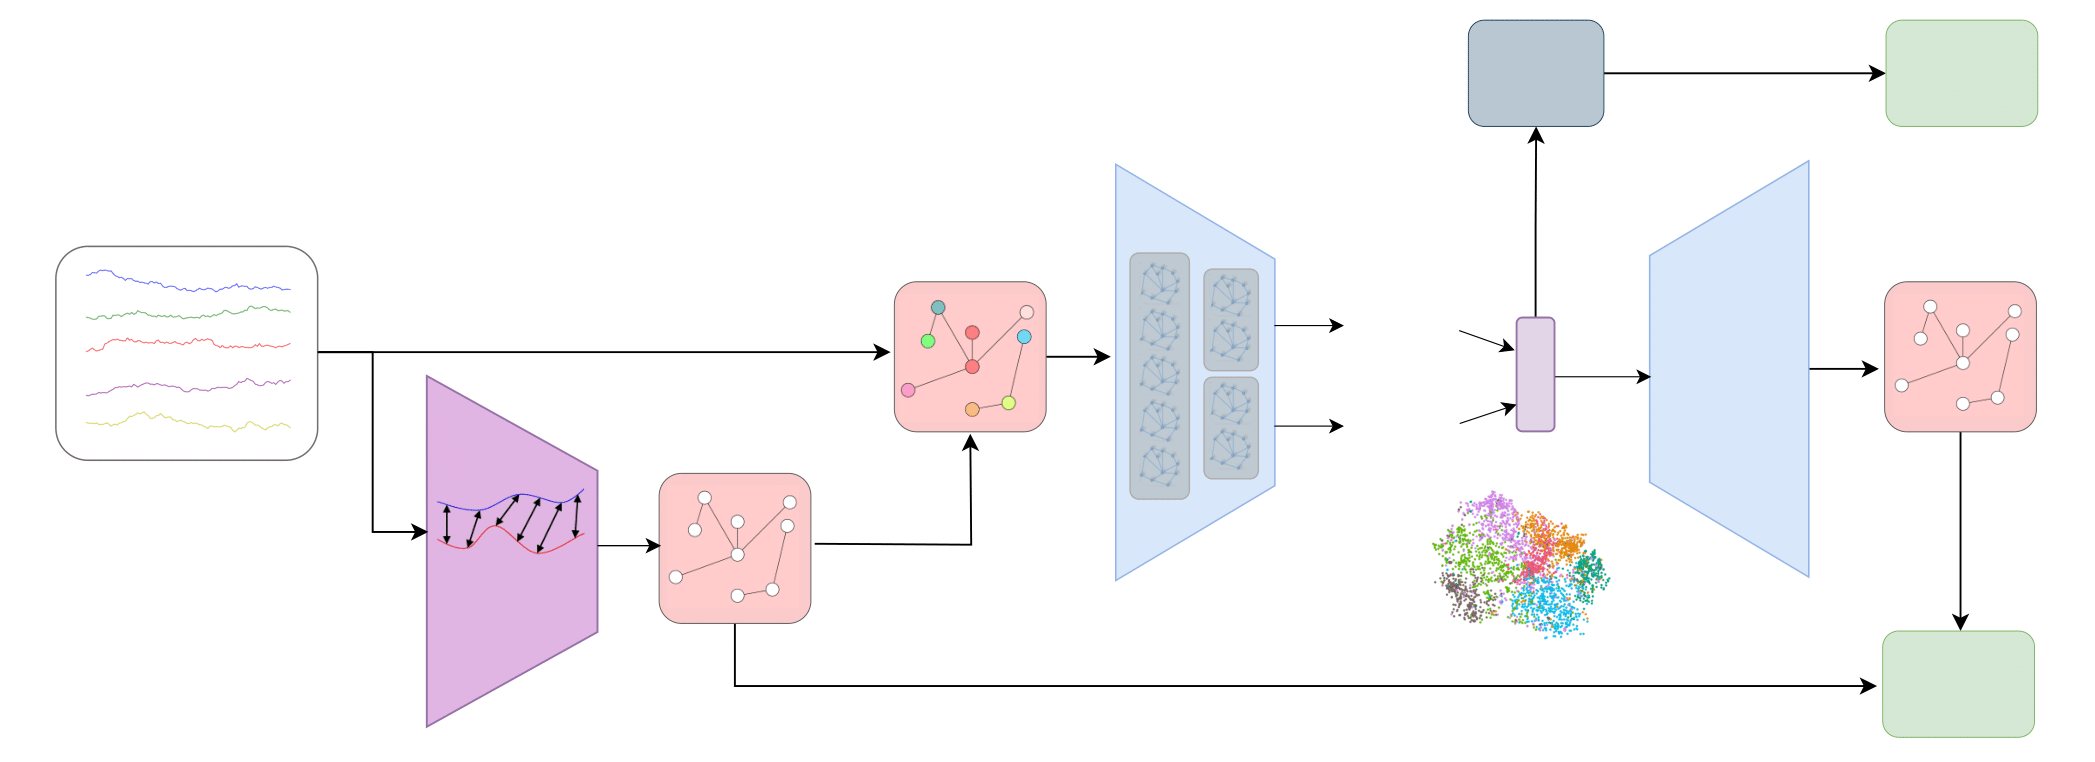
Figure 1: The general architecture of the Variational Mixture Graph Autoencoder (VMGAE).
Implementation and Training
Encoder and Decoder
The VMGAE utilizes a convolutional network with shared weights across layers to learn mean and standard deviation for its latent space. The process uses GCN layers to integrate graph structure and node features effectively, preserving both structural data and feature details in embeddings.
Learning Algorithm
The learning algorithm maximizes the Evidence Lower Bound (ELBO) of data likelihood, transforming time series data into robust embeddings by optimizing reconstruction and regularization losses. It also fits a Gaussian Mixture Model (GMM) on learned representations, enhancing clustering through more precise latent space structuring.
Experiments and Results
A comprehensive comparison against state-of-the-art time series clustering methods demonstrates superior performance of VMGAE in both NMI and RI across various datasets from the UCR archive. VMGAE achieves significantly better results in key datasets, emphasizing its effectiveness in creating discriminative and well-separated clusters.
Additionally, VMGAE's application to real-world financial data uncovers community structures in stock markets, validating its practicality in finance for improving market prediction and risk management.
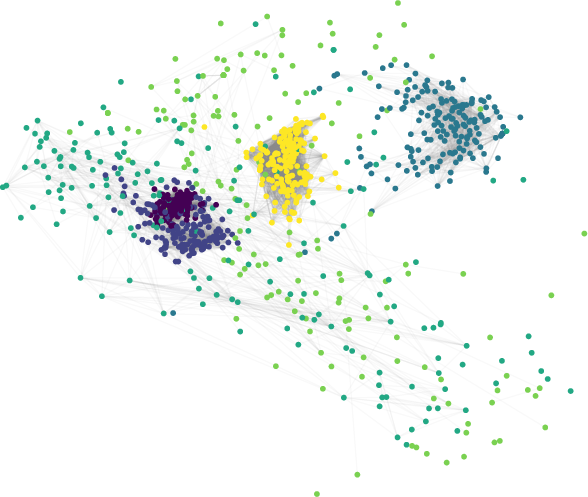
Figure 2: Graph visualizations of the Symbols dataset, illustrating effective data separation. Different colors correspond to distinct labels.
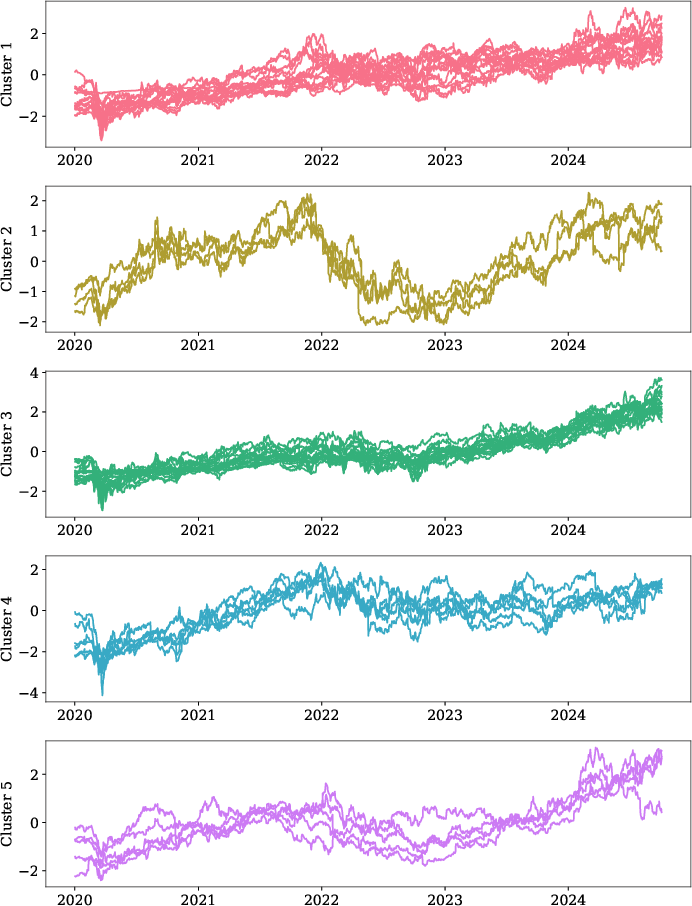

Figure 3: (a) Clustering results of the normalized closing prices for the top 50 U.S. stocks, grouped into five clusters. (b) The average normalized closing price for each cluster shows distinct patterns across the clusters.
Conclusion
VMGAE represents a significant advancement in clustering time series data, leveraging graph structures for enhanced representation and separability. It provides practical solutions across domains like finance, with strong performance metrics in clustering tasks. Future developments could explore its scalability and adaption to real-world data complexities across different applications. Through its innovative use of graph autoencoders and Gaussian mixtures, VMGAE sets a new benchmark in time series clustering methodologies.

